HAL Id: halshs-00820754
https://halshs.archives-ouvertes.fr/halshs-00820754
Submitted on 6 May 2013
HAL is a multi-disciplinary open access
archive for the deposit and dissemination of
sci-entific research documents, whether they are
pub-lished or not. The documents may come from
teaching and research institutions in France or
L’archive ouverte pluridisciplinaire HAL, est
destinée au dépôt et à la diffusion de documents
scientifiques de niveau recherche, publiés ou non,
émanant des établissements d’enseignement et de
recherche français ou étrangers, des laboratoires
A Multidimensional Perspective of Poverty, and its
Relation with the Informal Labor Market: An
Application to Ecuadorian and Turkish Data
Armagan-Tuna Aktuna Gunes, Carla Canelas
To cite this version:
Armagan-Tuna Aktuna Gunes, Carla Canelas. A Multidimensional Perspective of Poverty, and its
Relation with the Informal Labor Market: An Application to Ecuadorian and Turkish Data. 2013.
�halshs-00820754�
Documents de Travail du
Centre d’Economie de la Sorbonne
A Multidimensional Perspective of Poverty, and its Relation
with the Informal Labor Market: An Application to
Ecuadorian and Turkish Data
Armagan Tuna Aktuna G
UNES,Carla C
ANELASA Multidimensional Perspective of Poverty, and
its Relation with the Informal Labor Market:
An Application to Ecuadorian and Turkish Data
Armagan T. Aktuna Gunes
∗Carla Canelas
†March, 2013
Abstract
In this paper, we study the links between time use, informal labor market, and poverty measures in two countries that strongly differ on their level of development, by means of a multidimensional poverty index, and a bivariate probit model to assess the changes in the joint probability of working in the informal sector while being considered poor.
Résumé
Dans cet article, nous étudions les liens entre l’utilisation du temps, le marché du travail informel, et les mesures de la pauvreté dans deux pays
qui diffèrent fortement par leur niveau de développement. Au moyen
d’un indice de pauvreté multidimensionnelle, et d’un modèle probit bidi-mensionnel, nous évaluons les changements dans la distribution conjointe de probabilité de travailler dans le secteur informel et d’être considérés comme pauvres.
1
Introduction
Informality in the labor market has gained particular attention from policy mak-ers and researchmak-ers in the last decades. The increasing size of the informal sector and the important heterogeneity in the activities encompassed on it, give us an idea of the possible implications that the non regulation of this market has in the economic performance of the countries and most importantly on the well-being of the informal workers. The estimations of the OECD reveals that over half of all jobs in non-agricultural sectors in developing and emerging economies can be considered informal. Depending on the definition of informality, the conclusions
∗Paris School of Economics, Université Paris I Panthéon-Sorbonne. Centre d’Economie de
la Sorbonne, 106-112 Boulevard de l’Hôpital, 75647, Paris Cedex 13, France.
†Paris School of Economics, Université Paris I Panthéon-Sorbonne. Centre d’Economie
de la Sorbonne, 106-112 Boulevard de l’Hôpital, 75647, Paris Cedex 13, France. carla.canelas@malix.univ-paris1.fr.
regarding these implications vary across studies. For few, working in the infor-mal sector is a voluntary choice related with the possible financial advantages (J. Heckman). For most, the informal market is the only available option for people already excluded from the formal labour market (G. Fields). A third brunch of studies, relies on the possibility of the informal market segmentation. While for a group of people, working in the informal sector is voluntary, for most it is nothing but a last resource option to get out of unemployment. In line with the idea of last resource, we believe that there exist a strong link between infor-mality and poverty. Indeed, the majority of the working poor in the world work in the informal sector (OECD). Which implies a lack of social protection, and safety work conditions, as well as low pay wages. At this point, some questions deserve special attention; what is the role of poverty in determining the proba-bilities of working in the informal sector? And is that working in the informal sector a determinant of poverty? That is, informality and poverty, are they interrelated? And if so, to what extend? Most of the studies on informality or poverty, do not take into consideration the simultaneous causality that may exist between both of them, and so the estimates may be biased.
The aim of this paper is twofold. First, to contribute to the incorporation of time use analysis into poverty analysis, and second, to examine the simultaneous causality that exist between poverty and informality. For this, we study the links between time use, informal job market, and poverty measures in two countries that strongly differ on their level of development, by means of a multidimensional poverty index, and a bivariate probit model to asses the changes in the joint probabilities of working in the informal sector while being considered poor.
The article is organized as follows: Section 2 describes the sample and pro-vides some descriptive statistics of both economies. Section 3 presents the con-ceptual and methodological framework for the study of time, poverty, and in-formality, and describes the econometrical model used in order to compute joint probabilities of working in the informal sector and being poor. Section 4 presents and discusses the results, and Section 5 concludes.
2
Data
We use Time Use surveys and Family Expenditure surveys for both, Turkey (2006) and Ecuador (2006-2007); we consider the household as the unit of analysis, and we work with a reduced sample of households that have either non-children or children aged less than 16 years old. We regroup time activ-ities on seven categories that are compatible with the monetary expenditure ones: Personal Care Time – Personal Care Expenditure (including Health Care, eating and cooking time and food expenditure, given separability limitations of the data), House Maintenance Time – Dwelling Expenditures, Clothing Mainte-nance Time - Clothing Expenditures, Education Time – Education Expenditure, Transportation Time- Transportation Expenditures, Leisure Time- Leisure Ex-penditures, and Miscellaneous Time - Miscellaneous Expenditures. We proceed with the matching of the surveys by a Tobit regression (the selection equation
concerns the households which have a positive time use of their activities) on similar characteristics in both datasets. For each activity on the Time Use sur-vey, we estimate time use equations for all the observation units on the dataset and we use this estimates for predicting the time spent on this activities in the corresponding units in the Family Expenditure Budget Survey. See the Appendix for Descriptive Statistics of each of the datasets.
Limitations
The inclusion of time on the analysis of poverty is not free of cost. The principal limitation is that one of letting outside of the sample the poorest households. The first restriction comes from the fact that we cannot assume the income pooling hypothesis whenever we find households in which members of the ex-tended family or domestic employees live in. Since it has been already establish in many studies, in most developing countries households with large families tend to be among the poorest. A second limitation comes from the division of time itself. Most of the time is not possible to differentiate activities that can usually be done at the same time ( i.e. taking care of the children and cleaning the house). Since one of the objectives of this article is to introduce time into the study of poverty, the analysis of the results must be carefully done taking into account these limitations.
3
Conceptual and Methodological Framework
In this Section, we first discuss the relationship between poverty and time use, we explain how we incorporate domestic production into the poverty index, and we explicate the construction of this last one. Finally, we give the definition for informality, and we introduce the models that were estimated.
Poverty and Time Use:
The definition of poverty has evolved significantly over time. Nowadays, poverty is no longerviewed uniquely as an economic problem based either on the level of income or consumption. Rather, poverty is conceived as a multidimensional phenomenon encompassing several dimensions like income, expenditure, various kinds of deprivation, vulnerability, and exclusion, among others. But while most of these dimensions has currently being incorporated in the literature, the role of time use in the studies of poverty has yet not been widely explored. In fact, time is one of the most valuable resources we have and disparities in time use within and among households can provide important insights for the comprehension of poverty. Revealing the characteristics and the time share of the non-market unpaid work as well as leisure, time use surveys allow us to compute the cost of time spent on unpaid work activities, and therefore to add to the monetary expenditures the non-monetary ones, obtaining what we call the expenditure full cost. Recent literature on the studies of the non-monetary component of
full expenditure can be found, among others, on the works of Gardes et al. (Oct. 2011), and Gronau and Hamermesh (March 2006).
One of the difficulties for the incorporation of domestic production in economic studies is the way in which we can assign a given value to it. In this paper, we follow a simple method developed by Gardes et al. ( 2011) , in which the value of the domestic production equals the sum of the monetary value of given goods and services and the value of the time spent by the individuals of the household for its production. Given than individuals spend their time in the production of these goods and services, and that this time has a cost, we consider the full income of the households as the sum of their monetary income plus the cost of time; with the cost of time spent on domestic activities being nothing but the value that it has in the labor market. That is, one hour spent on domestic activities has the same value as one hour spent on the paid labor market. For those individuals who do not work, we impute salaries by Heckman’s method. Regarding the construction of the index, we have chosen three dimensions, that we consider, reflect in a relevant way the different faces of poverty. These dimensions are: relative income, budget share of food in the household total expenditure, and standard of living. Each of these dimensions is composed by one indicator, although the deprivation index, that is the indicator for the third dimension, is itself composed by different indicators that can be chosen according to the society and situation. See the Appendix for a complet list of the indicators.
Even though, we are aware that income is not a sufficient condition to identify those households living in poverty, we do consider relative income as one impor-tant dimension of it. At the end, income is a good measure of what individuals can and cannot afford in a given period of time. Regarding, the budget share of food, many studies have already corroborate what is call the Engel law. The fact is, that the proportion of the budget share that is allocated to food tends to be higher for those individuals living in poverty than for those who do not. The third dimension, as it is explained below, allows us to measure the individual’s relative deprivation within the society.
An important decision in the construction of a multidimensional index is the selection of the relative weights for the different dimensions. Different methods have been widely discussed regarding this issue, but none of them has actually given a normative solution to the problem. The important point to have in mind is that any weighting scheme implies a trade-off between the dimensions, and so we have to be careful while interpreting the results. In this paper, with no other reason than simplicity, we have chosen the equal weighting scheme. We consider a person/ household to be deprived in the first dimension if his total income is strictly lower than the 60% of the median revenue of the population. The same person/ household is considered to be deprived in the second dimen-sion if the proportion of the household budget allocated on food is at least 30% greater than the average budget share of the population. For the third dimen-sion, we constructed a deprivation index following the methodology developed
by Dessai and Shah (1988). The idea is to capture one possible dimension of poverty through a measure of individual’s relative deprivation within the so-ciety. That is, we calculate the distance that exists between the consumption events experienced by each individual in the society and the events experienced by the community as a whole.
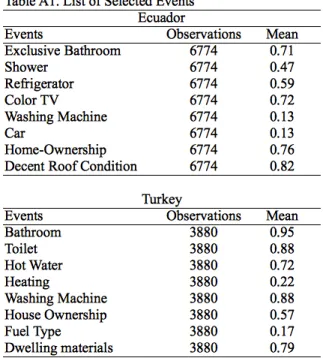
The approach consists in a two-step procedure in which first, we select a bundle of “consumption events” that are experimented or not by the individuals in the sample, and we calculate the probabilities of occurrence of these events by means of a logit model. In the second step, the deprivation index is constructed as a weighted sum of the previously estimated individual probabilities, with population means of the events used as weighs. See the Appendix for a detailed explanation.
Once the deprivation status for each of the three dimensions has been stated, we classify the population in four groups according to the number of dimensions in which they are or they are not deprived. That is, a person/ household is considered to be extremely poor if he/she is deprived in all the dimensions; poor if he/she is deprived in two dimensions; middle class if he/she is deprived in one dimension, and rich when there is not deprivation at all. In order to include the cost of time in the estimations, we follow exactly the same procedure explained above, but instead of total monetary income of the household we used the full income define in the previous section.
Informality:
Many definitions of informality exist, so the results concerning its determinants vary according to which one has been used. In the literature, the most common one refers to an individual being informal if he/she works but does not have social security. A second definition uses the size of the enterprise as a reference, while a third one is more focus on whether or not the individual is engaged in black or unregistered activities. In this paper, we consider a household to be informal if two conditions are satisfied: first, at least one of the adult working members of the household does not have social security and second, there exist under-declaration of the total income of the household. The last condition being measured by the difference between reported income and reported expenditure. Aware of the difficulties of correctly measuring this difference, we consider that the household under-declare its income, if the difference is strictly smaller than the average of the sample difference. Once informality has been defined, and the poor households has been identified, we proceed to the calculations of the probabilities of working in the informal market conditional on the poverty status of the households. Since one of the objectives of the paper is to analyze the simultaneous relationship between poverty and informality, we use a bivariate probit model that allows for correlated unobserved heterogeneity. The model is specified as follows:
y∗1i= X1iβ1+ u1i (1)
y∗2i= X2iβ2+ u2i (2)
where y∗
1i is a dummy variable indicating the ith household’s informality status,
y2i∗ is a dummy variable indicating the ith household’s poverty status, and Xji
is a vector of socio demographic and work-related characteristics of the ith household head.
4
Results
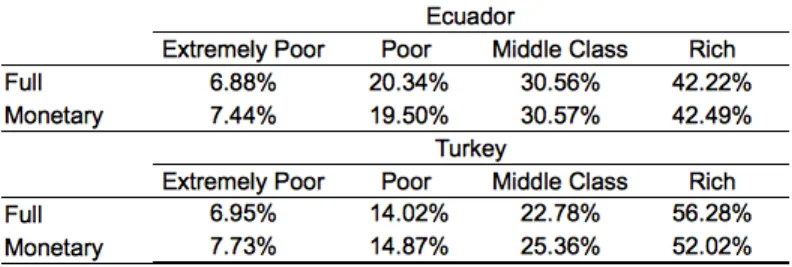
Table 1 presents the classification of the population according to the multidi-mensional poverty index. Even though, the differences on the results between the indices (monetary and full) is small, the fact that there exist a change tells us already that we have a substitution between time and money and that given the characteristics of the households, this substitution effect will vary across groups. What it is interesting to see, is how the structure changes across coun-tries; for intance, while in Ecuador the proportion of people classified as middle class and rich seems to be invariant under both definitions, in Turkey it is the proportion of poor and middle class who remains almost constant.
Table 2 presents the results from the joint estimation of equations (1) and (2) for Ecuador and Turkey. After controlling for unobserved heterogeneity we can see that individuals living in the urban areas have a lower risk of being in poverty than those living in the rural ones. However, they are also more inclined to work in the informal sector, probably due to the difficulties that they face when looking for a job in the formal market. Difficulties that are accentuated for the important migration that takes place from the rural area towards the big cities. Age, entered linearly, has a negative effect on both poverty and job on the informal sector, reflecting a more conservative behavior from the part of the older workers who may be less willing to participate in entrepreneurial adventures. The negative effect that it has on poverty can be explained by the idea that the command on economic resources increases with age. The level of
education of the household head decreases the probability of being in poverty and of working in the informal sector with respect to those individuals that have just primary school or not education at all; reinforcing the idea that mostly poor households work in the informal labor market.
Regarding the household structure, couples with or without children are more incline to work in the informal market but less likely to be in poverty than single persons. Actually, having two salaries reduces the chances of being poor; but also, if one of the salaries comes from the formal sector, the couple may be more inclined to entrepreneurial activities given the more safety environment in which they are, when at least one of them has a proper contract and is covered by the social security (See definition of informality in above section). What is more striking, is the fact that monoparental families are more likely to be in poverty and work in the informal sector at the same time. Possibly, because there is not other immediate option, and it is better for them to work even under bad conditions than not work at all when there are children to take care of. Basically, they have not other choice than work informally. It is also interesting to see, for the case of Ecuador where we were able to control for ethnicity, how minorities (black and indigenous people) are more likely to be in poverty than mestizos or white people.
Finally, Table 2 also reports the results for the correlation coefficient of the error terms, which is statistically significant for both countries; and the results for the Wald statistics, which rejects the null hypothesis that ρ = 0. So we can conclude, that the error terms of the equations jointly estimated varies together.
To summarize, our estimations confirm previous results in the literature that despite of controlling for many relevant variables, informality is highly corre-lated with poverty, and so this simultaneity should be taking into account when studying them. In general, informal workers are found to have a relatively low education and low pay wages, which supports the idea that these workers have no choice but to work informally.
5
Conclusion
This study uses microeconomic data from Time Use surveys and Family Expen-diture surveys for two countries that strongly differ on their level of development, Turkey and Ecuador, in order to examine first, the substitution effect that ex-ist between income and time; and second, the possible simultaneity that exex-ist between poverty and informality.
The analysis uses a multidimensional poverty index in order to classify the population in four different states, and compares the results with those ones obtained under the full income hypothesis. It uses a a bivariate probit model framework in order to account for the unobserved heterogeneity of household
poverty and work in the informal sector.
From the analysis of poverty we see that, even though, the differences in results between the indices (monetary and full) is small, the fact that there exist a change tells us already that there is substitution between time and money and that given the characteristics of the households, this substitution effect will vary across groups.
Regarding informality and poverty, our estimations confirm previous results in the literature that despite of controlling for many relevant variables, informality is highly correlated with poverty and vice-versa , and so this simultaneity should be taking into account when studying them. In general, informal workers are found to have a relatively low education and low pay wages, which supports the idea that these workers have no choice but to work informally.
References
[1] Amuedo-Dorantes, C. 2004. Determinants and Poverty Implications of In-formal Sector Work in Chile, Economic Development and Cultural Change, Vol. 52, No. 2, pp. 349-368.
[2] Becker, G.S, 1965, A Theory of Allocation of Time, The Economic Journal, vol 75, 493-517.
[3] Delhausse, B., Axel Luttgens, and Sergio Perelman, 1993. Comparing mea-sures of poverty and relative deprivation: An example for Belgium, Journal of Population Economics.
[4] Desai M, Shah A, 1988. An econometric approach to the measurement of poverty. Oxford Econ Pap 40:505-522
[5] Fields, G.S., 1975. Rural-Urban Migration, Urban Unemployment and Under- employment, and Job Search Activity in LDCs. Journal of Devel-opment Economics 2 (1975): 165–87.
[6] Gardes, F., Sayadi, Y., Starzec, C., 2011, The Full Cost of a Child: Time and Monetary Expenditures Combined, Cahiers du Centre d’Economie de la Sorbonne,University Paris 1. 7
[7] Gronau R, Hamermesh D. S., 2006, Time Vs. Goods: The Value of Measuring Household Production Technologies, Review of Income and Wealth, Series 52, N°1, March 2006, 1-16.
[8] Heckman, J. , Guilherme S., 1985. Heterogeneity, Aggregation and Market Wage Functions: An Empirical Model of Self-Selection in the Labor Market, Journal of Political Economy , 93, 1077–1125.
[9] Henrik H., Sida, and Johannes Jütting. Informality and Informal Employ-ment. OECD Development Centre.
Appendix I
Following Desai and Shah (1988), the index of relative deprivation Dj
corre-sponding to the household j, is estimated as: Dj= 1I
I
P
i
λiδˆij , with j = 1, ..., J
where each i corresponds to a consumption event, ˆδij to the estimaded
dis-tance between the household and the community experience for the ithevent,
and λi the weigh of the ithevent. In this article, following Delhausse et al., ˆδij
was redifined on the basis of probabilities as : ˆ
δij = −(ˆθij− ¯θi)
where ¯θiis a central probability measure, and ˆθij is the estimated probability
for household j, to experiment the ithevent. Also, (1/ P ¯θ
i)was taken as factor,
instead of (1/I), in order to normalize index magnitudes. Finally, it is assumed that each experience has a specific weight λi = ¯θi in order to take prevalent
social norms into consideration.
The estimation of the probabilities, was carried out by logit regression of household experiences, indicated by dichotomous variables, on several variables representing socio-demographic characteristics.