HAL Id: hal-01119163
https://hal.archives-ouvertes.fr/hal-01119163
Submitted on 21 Feb 2015
HAL is a multi-disciplinary open access
archive for the deposit and dissemination of
sci-entific research documents, whether they are
pub-lished or not. The documents may come from
teaching and research institutions in France or
abroad, or from public or private research centers.
L’archive ouverte pluridisciplinaire HAL, est
destinée au dépôt et à la diffusion de documents
scientifiques de niveau recherche, publiés ou non,
émanant des établissements d’enseignement et de
recherche français ou étrangers, des laboratoires
publics ou privés.
Spectral self-action of THz emission from ionizing
two-color laser pulses in gases
Eduardo Cabrera-Granado, Yxing Chen, Ihar Babushkin, Luc Bergé, Stefan
Skupin
To cite this version:
Eduardo Cabrera-Granado, Yxing Chen, Ihar Babushkin, Luc Bergé, Stefan Skupin. Spectral
self-action of THz emission from ionizing two-color laser pulses in gases. New Journal of Physics, Institute
of Physics: Open Access Journals, 2015, 17 (2), pp.023060. �10.1088/1367-2630/17/2/023060�.
�hal-01119163�
This content has been downloaded from IOPscience. Please scroll down to see the full text.
Download details:
IP Address: 192.195.94.136
This content was downloaded on 19/02/2015 at 05:26
Please note that terms and conditions apply.
Spectral self-action of THz emission from ionizing two-color laser pulses in gases
View the table of contents for this issue, or go to the journal homepage for more 2015 New J. Phys. 17 023060
(http://iopscience.iop.org/1367-2630/17/2/023060)
New J. Phys. 17 (2015) 023060 doi:10.1088/1367-2630/17/2/023060
PAPER
Spectral self-action of THz emission from ionizing two-color laser
pulses in gases
Eduardo Cabrera-Granado1
, Yxing Chen2
, Ihar Babushkin3,4
, Luc Bergé5
and Stefan Skupin6,7,8
1 Facultad de Óptica y Optometría, Universidad Complutense de Madrid, 28037, Madrid, Spain 2 Laboratory for fundamental BioPhotonics, Ecole Polytechnique Fédérale de Lausanne, Switzerland 3 Humboldt University, Institute of Mathematics, 12489 Berlin, Germany
4 Institute for Quantum Optics, Leibniz Universität Hannover, Welfengarten 1, 30167 Hannover, Germany 5 CEA-DAM, DIF, F-91297 Arpajon, France
6 Max Planck Institute for the Physics of Complex Systems, 01187 Dresden, Germany
7 Institute of Condensed Matter Theory and Solid State Optics, Abbe Center of Photonics, Friedrich-Schiller-Universität Jena, 07743 Jena,
Germany
8 Univ. Bordeaux— CNRS — CEA, Centre Lasers Intenses et Applications, UMR 5107, 33405 Talence, France
E-mail:ecabrera@ucm.es
Keywords: ultrafast nonlinear optics, photoionization, THz generation, far infrared spectroscopy, multi-color pulses
Abstract
The spectrum of terahertz (THz) emission in gases via ionizing two-color femtosecond pulses is
ana-lyzed by means of a semi-analytic model and numerical simulations in 1D, 2D and 3D geometries
taking into account propagation effects of both pump and THz
fields. We show that produced THz
signals interact with free electron trajectories and thus significantly influence further THz generation
upon propagation, i.e., make the process inherently nonlocal. This self-action contributes to the
observed strong spectral broadening of the generated THz
field. We show that diffraction of the
gener-ated THz radiation is the limiting factor for the co-propagating low frequency amplitudes and thus for
the self-action mechanism in 2D and 3D geometries.
1. Introduction
Research on intense terahertz (THz) electromagnetic sources has received an increasing amount of attention owing to their numerous applications, for example, in time-domain spectroscopy, biomedical imaging or security screening [1]. Among the various techniques employed to generate THz radiation, focusing intense two-color femtosecond pulses in air or noble gases provides interesting features like the absence of material damage, large generated bandwidths (up to∼100 THz) and high amplitudes of the emitted THz pulses (>100 MV m−1) [2]. First reported by Cook et al [3], THz emission from intense two-color pulses was initially attributed to optical rectification via third-order nonlinearity. However, it was shown later that the plasma built-up by tunneling photoionization is necessary to explain the high amplitudes of the THzfield [4–6], and a quasi-dc plasma current generated by the temporally asymmetric two-colorfield is responsible for THz emission [7,8]. Plasma oscillations leading to strong THz radiation were also reported for single-color pump pulses with few-cycle duration or at higher intensities [9,10].
Apart from energy scaling [11] and polarization control [12], tailoring the shape of the broadband radiated THz pulse is one of the current goals with respect to applications. In the case of two-colorfilaments in air it was already demonstrated experimentally that the geometry of the plasma channels and the initial carrier envelope phase of the laser pulse can be used to control the THz waveform [13,14]. Recently, controlling THz generation in gases by more involved spectral engineering of the IR pump pulse was also suggested, i.e., by modifying the temporal positions of the electricfield maxima resp. ionization events [15].
One of the main challenges on the route towards THz spectral control is to understand the influence of the complicated nonlinear propagation dynamics of the electromagnetic radiation. It is known that ionizing femtosecond laser pulses undergo strong spatiotemporal modifications during propagation, and that these
OPEN ACCESS
RECEIVED
25 July 2014
REVISED
2 December 2014
ACCEPTED FOR PUBLICATION
16 January 2015
PUBLISHED
18 February 2015
Content from this work may be used under the terms of theCreative Commons Attribution 3.0 licence.
Any further distribution of this work must maintain attribution to the author (s) and the title of the work, journal citation and DOI.
propagation effects have a tremendous impact on the emitted THzfields [16]. Moreover, shortly after the onset of THz generation the gas atoms or molecules and ionized electrons are exposed to the co-propagating low-frequencyfield as well. In particular, because asymmetrically ionized gases were already successfully used for remote detection of THzfields through coherent manipulation of the ionized electron drift velocity and subsequent collision-inducedfluorescence emission [17], we can expect tofind a self-action mechanism of already generated THz radiation on the THz generation itself.
2. Model
In the present work we will shed light onto the pulse propagation effects in the plasma, and the interaction of the generated terahertzfield with the ionized medium. Our starting point is a semi-analytic model developed in [15] based on the local current (LC) approximation, i.e., considering a small volume of gas irradiated by the ionizing field. Let us assume that the free electron density is governed by
ρ ρ ρ
∂t ( )t =WST( )E ⎡⎣ at − ( ) ,t ⎤⎦ (1) where WST(E) is afield-dependent tunneling ionization rate [5], leading to a stepwise increase ofρ( )t in time
(seefigure1(d)). The nth ionization event with amplitude δρnand temporal shape Hn(t) corresponds to a
maximum of the incomingfield at time tn. Because all ionization events share a similar shape9, we can simplify
τ
≃ − =
{
+ −}
H tn( ) H t( tn) 1 erf [(t tn) ] 2, with characteristic temporal width τ = 0.2 fs. This value was found tofit well the ”typical” duration of an ionization event (see appendix A.1. of [15]). The events are well separated in time, so we can give a semi-analytic expression forρ( )t by summing up all contributions
∑
ρ( )t ≈ρ˜ ( )t = δρH t
(
−t)
. (2)n
n n
For a given electricfield amplitude E(t), the δρnand tncan be extracted from the numerical solution of
equation (1).
If we assume zero velocity for newly born electrons and neglect ponderomotive forces, the equation for the plasma current density reads
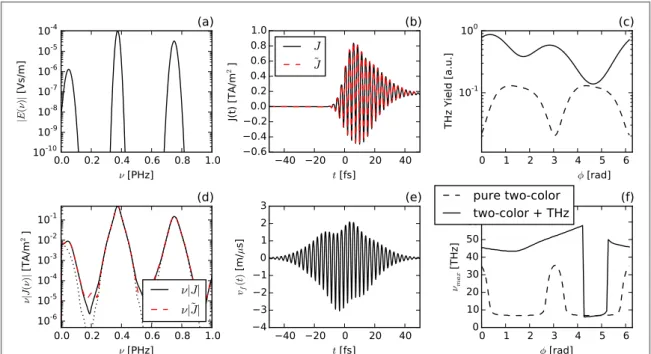
Figure 1. (a) Exemplary two-color electricfield E(t) (see equation (7) and text below for details); (b) corresponding spectrum; (c) current density J(t) and (d) plasma densityρ( )t given by equations (3) and (1). (e) The resulting spectrum of the secondary electric fieldEJ∝νJ(see equation (6)), and (f) the free electron velocity vf(see equation (5)). Results of our semi-analytic model equations (2)
respectively (4),ρ˜ ( )t andJ t˜ ( ), are marked as red dashed lines in (c), (d), and (e), showing excellent agreement. Red dots in (a) and (d) indicate the temporal positions tnof the ionization events.
9
Provided that pump pulses are multi-cycle, andρ( )t ≪ρat.
2
γ ρ + = J t t J t q m t E t d ( ) d ( ) ( ) ( ). (3) 2
Here,γ is a phenomenological electron–ion collision rate, andq m, represent electron charge and mass,
respectively. We chooseγ=7.7ps−1throughout this paper, a value compatible with usual estimates [18] for free electron densities and velocities of the order of1018− 1019cm−3and ∼106m s−1, respectively. Finally, plugging
the above approximation ρ t˜ ( ) (equation (2)) for the plasma densityρ( )t into equation (3) yields a semi-analytic expression for the current
∑
δρ≈ =
(
−)
− γ(
−)
( )
J t( ) J t˜ ( ) q H t t v t( ) e v t . (4)
n
n n ⎡⎣⎢ f tn t f n ⎤⎦⎥
Here, the expression
∫
τ τ = γ τ −∞ − v t q m E ( ) ( )e d (5) f t t ( )can be interpreted as the free electron velocity. Figure1confirms excellent agreement between numerical evaluation of equations (1), (3) and our semi-analytic expression equations (2), (4) for both plasma and current density. In fact, throughout the whole analysis presented in this paper we found that the approximations
ρ( )t ≈ρ˜ ( ) andt J t( )≈J t˜ ( ) are always close to equality.
The emitted secondary electricfield due to the plasma current can be calculated in frequency domain as
ω = ω ω
EJ( ) g J( ), (6)
where g is a constant [19]. Infigure1(e) we show the spectrum of the secondary radiation according to equation (6) for a representative (linearly polarized) two-color pumpfield
ω ω ϕ = − + − + E t( ) E0 e cos( t) re cos(2 t ) , (7) t t p t t p 2 2 2 2 2 ⎡ ⎣ ⎢ ⎤ ⎦ ⎥
whereE0= 31GV m−1, tp= 24 fs, ω=2πνwith ν = 375 THz, and the ratio r = 0.44 between the fundamental
and second-harmonic. The relative phase between bothfields has been set to ϕ=π 2, to ensure optimum conditions for THz generation [5]. Throughout this paper all quantities, including spectra, are expressed in physical units.
3. THz spectral self-action
It is a reasonable assumption that an additional small low frequencyfield will co-propagate with the pump pulse shortly after the onset of THz generation. Thus, let us now investigate the impact of such afield on the secondary radiation spectrum. To this end, we add a third component centered at 50 THz,∼15 fs duration and with only 2 % the amplitude of the fundamental IR frequency to the two-colorfield equation (7) (seefigure2(a)). As can be seen infigure2(d), the low-frequency spectral shape of the secondary radiation changes noticeably compared tofigure1(e), a peak around the frequency of the new pump component now dominates the low frequency range. This simple example already indicates that generated THzfields have an important impact on the subsequent THz generation process, and thus produce a self-action. In other words, the THz generation process from ionizing two-color pulses is nonlinear, and the nonlinearity is significantly nonlocal in propagation direction of the pump laser.
Before performing any further analysis, we want to investigate the influence of the phase angle ϕ between the fundamental and second-harmonicfield. The secondary radiation spectra shown in figures1(e) and2(d) are obtained for ϕ=π 2. It is well known that for a pure two-color drivingfield this value ensures maximum THz yield∝
∫
ν ∣J ( ) dν ∣ ν0
100 THz 2 2
, as recalled by the dashed line infigure2(c). With the small THz component present in the drivingfield, this THz yield increases considerably for almost all values of ϕ (see solid curve in figure2(c)), and the frequency of the maximum spectral density increases as well (seefigure2(f)). The jump in figure2(f) aroundϕ=3 2π is linked to the exceptionally low THz yield in this parameter range (see
figure2(c)). Thus, we can state that the additional THz pumpfield component, even with a small amplitude, dominates the low frequency spectral shape of the secondary emission for almost all values ofϕ. We also found that the phase angle of the THz pump component itself is of minor influence (not shown), which is probably due to the much longer duration of the THz optical-cycle.
We can use the semi-analytic approximate expression for the plasma currentJ t˜ ( ), equation (4), to gain further insight into the THz spectral self-action mechanism. To this end, we rewrite the secondaryfield as the sum of two contributions,
3
ω = ω ω ≈ ω ω = ω − ω EJ( ) g J( ) g J˜ ( ) g A[ ( ) B( )], (8) where
∑
ω = ω δρ(
−)
A( ) q FT v t( ) H t t , (9) n n n f ⎡ ⎣ ⎢ ⎢ ⎤ ⎦ ⎥ ⎥∑
ω = ω δρ(
−)
γ(
−)
( )
B( ) q FT H t t e v t . (10) n n n tn t f n ⎡ ⎣ ⎢ ⎢ ⎤ ⎦ ⎥ ⎥Here, FT[ ] denotes the Fourier transform. Interestingly, for a two-color pumpfield without any low-frequency components, in the optimum configuration (ϕ=π 2, seefigure1), the secondary radiationE ( )J ν
below 100 THz is determined solely byB ( ) [15ν ]. This is confirmed by figure3(a), where the secondary radiationEJ( )ν ∝νJ( )ν is separated intoA ( ) andν B ( ) according to equations (9ν ) and (10). Once
low-frequency components are present,A ( ) starts to contribute as well through the free electron velocity vν f(t).
Figure3(b) illustrates the impact ofA ( ) andν B ( ) for the pumpν field configuration of figure2and reveals the THz spectral self-action mechanism: the termA ( ) describes the impact of the electricν field on the plasma
current, becauseA ( ) contains vν f(t)10. In fact, the change in the free electron velocity v tf( )is clearly visible when
comparingfigure1(f) withfigure2(e). As we can observe fromfigure3(c), the low frequency component of E(t) resp. vf(t) can significantly alter the free electron trajectory and thus the secondary radiation spectrum. From the
mathematical structure of equation (9) we can infer thatA ( ) yields a similar spectrum to the pumpν field νE ( )
but broader due to the convolution ofFT[ ( )]v tf withFT[ ( )]in the Fourier domain, which is confirmed byH t
figure3. Because the secondary radiation is co-propagating with the pumpfield, a spectral self-action occurs and we expect a THz spectral broadening upon propagation.
4. Simulations
To confirm our previous hypothesis of THz spectral self-action, we present several numerical simulations in various geometries ranging from 1D (hollowfiber waveguide) to 3D (bulk material, gas) configurations. In a first attempt, we propagate the two-color field equation (7)11over 400μm in argon gas by means of the
1D-Figure 2. (a) Spectrum of the exemplary pumpfield with THz component centered at 50 THz (see text for details); (b) corresponding current density J(t); (c) yield of secondary radiation below 100 THz for the pumpfield in (a) (solid curve) and the pure two-color field offigure1(dashed curve) versus phase angleϕ. (d) Spectrum of the secondary electric fieldEJ∝νJ; the spectrum offigure1(e) is
recalled by the black dotted curve. (e) Free electron velocity vffor the pumpfield in (a). (f) Position of the maximum spectral density
of secondary radiation below 100 THz, same line coding as in (c). Results of our semi-analytic model (J˜, see equation (4)) are marked as red dashed lines in (b) and (d), again showing excellent agreement.
10
In contrast toB ( )ν, which contains v tf( )n only.
11
In all simulations no THz component is present at the beginning of the simulation.
4
finite-difference-time-domain (1D-FDTD) algorithm [20]. Nonlinear generalization of the FDTD algorithm offers the possibility to simulate Maxwell’s equations without further approximations [21]. Linear dispersion of argon is included via the refractive indexn ( ) given in [22ω ]. The plasma densityρ( )t obeys equation (1), and the resulting plasma current J(t) is accounted for via equation (3). Figure4(a,d,g) shows the spectrum of the propagatedfield νE ( ) at three different distances. We can clearly see that the low frequency spectrum (red part of
the curve) broadens up to frequencies well above 100 THz during propagation in the medium, in agreement with our previous expectations. Solid black lines infigure4(b,e,h) show the corresponding local secondary emissionEJ( )ν ∝ νJ( )ν. Interestingly, the maximum of the low frequency secondary emission spectrum shifts
toward larger frequencies with increasing propagation distance, an effect already reported in [16,23]. In order to further corroborate the THz spectral feedback mechanism, hypothetical local secondary emission spectra computed from a modified pump field with the low frequency part (<200 THz) suppressed are plotted infigure4(b,e,h) for comparison (dashed lines). Obviously, local spectra generated by these artificially modified pump fields are less broad than the original spectra, in particular towards larger propagation distances where strong THz spectral broadening takes place. By using the semi-analytic model developed above, we can decompose the local secondary emission ν νJ ( ) into the contributions ofA ( ) andν B ( ). As predicted above andν
confirmed by figure4(c,f,i), the low frequency part ofA ( ) is determined by the low frequency part of theν
drivingfield E, and thus responsible for the THz spectral feedback mechanism. In contrast, we report minor changes only inB ( ) when the low frequency part of the pumpν field is suppressed (not shown).
Thus, in the present propagation regime with relatively narrow IR pump spectra, the THz spectral feedback mechanism is a key player with a strong impact on the emitted secondary radiation. At larger propagation distances, spectral broadening and shifting of the two-color pump pulse itself may become the dominant effect determining the local secondary emission THz spectra. In fact, it is important to keep in mind that the THz
Figure 3. Spectrum of secondary radiationEJ( )ν ∝νJ( )ν(black solid line) for (a) a pure two-color pump pulse (seefigure1) and (b)
with an additional low amplitude component centered around 50 THz (seefigure2). Our semi-analytic model, equations (9) and (10), allows a decomposition intoA ( ) (green solid lines) andν B ( ) (blue dashed lines). The termν A ( ), which contains the impact ofν
the electricfield on the plasma current via the free electron velocity vf(t), is clearly responsible for the modification of the secondary
radiation in THz spectral range. In (c) the phase-space representation of the motion of a free electron born att= −∞is shown for both pumpfield configurations. The dramatic impact of the THz component in the electron trajectory is clearly visible.
5
spectral feedback mechanism reported here is an additional effect, and other propagation effects modifying the THz spectra are present as well [7,16].
In 1D geometries investigated so far, high pump intensities are maintained over extended propagation ranges due to the absence of transverse diffraction, and thus nonlinear effects are stronger than in 2D or even 3D geometries. To address the role of diffraction, 2D-FDTD simulations have been performed, employing a focused (f=330 m) beam with initial widthμ w0=30.2μm. Results are shown infigure5. The initial fundamental
amplitude was taken as 11.5 GV m−1, in order to reach 47 GV m−1peak amplitude at focus. Other parameters are kept as in the 1D simulations (see equation (7)). The interaction of the generated THzfield with the newly born free electrons as thefield propagates through the medium is expected to be weaker than in the 1D configuration, because the low frequency part of thefield strongly diffracts and leaves the plasma channel. Nevertheless, as the field propagates, the maximum of the secondary radiation spectrum in THz range shifts towards higher frequencies until the focal point is reached (seefigure5(a,c,e)). Dashed curves infigure5(b,d,f) show on-axis local secondary emission spectraEJ( )ν ∝νJ( )ν computed from pumpfields with low frequency range
(<200 THz) suppressed. Local spectra generated near the focus by these artificially modified pump fields are shifted by more than 10 THz towards lower frequencies compared to the original local spectra plotted in black solid lines. We note that in simulations reaching higher peak electricfield amplitudes >50 GV m−1at focus, the THz self-action can be more pronounced. However, our model accounting for single ionization only becomes questionable in this strong-field regime [24], and we do not discuss this regime in the present work. In contrast, simulations with reduced fundamental peak amplitude reaching only 37 GV m−1at focus (not shown) feature no THz spectral self-action at all, simply because the on-axis THzfield amplitude remains one order of
magnitude lower. The rapid oscillations visible in the spectra infigure5(b,d,f) are numerical artefacts due to the limited propagation range (i.e., temporal extent of the recorded time series) in our 2D simulations.
In general, THz self-action in 2D geometry is less pronounced than in the former 1D case. Moreover, from the focal point onward,figure5(d,f) shows that the maximum of the secondaryfield spectrum remains fixed around ν ∼ 50 THz. These features can be readily explained by the strong diffraction of the THzfield beyond the focus, which prevents the low frequencyfield from driving the free electrons produced in the plasma channel,
Figure 4. (a,d,g) Recorded electricfield spectrum from 1D-FDTD simulations at indicated propagation distances, with the low frequency part marked in red. (b,e,h) Corresponding local secondary emissionEJ( )ν ∝νJ( )ν in the range below 200 THz (solid black
lines). The dashed lines show the same quantity computed from a modified pump field with the low frequency part (<200THz) suppressed. (c,f,i) The contributionA ( )ν to the local secondary emission according to equation (9) computed with (solid green lines) and without (dashed green lines) low frequency part of the pump.
6
and therefore arrests the THz spectral self-action mechanism. Infigure6the action of diffraction on the different spectral components of the electricfield at30 m after the geometrical focus is visualized. One can clearly seeμ
that diffraction delocalizes the THz radiation much more strongly than the IR and visible light, which rapidly decreases the on-axis THzfield strength. Thus, diffraction is a dominant mechanism in determining the final bandwidth of the secondary emission.
The strong impact of diffraction on the THz spectral self-action mechanism observed in the 2D simulations raises the natural question of what happens in a full 3D configuration. In many relevant cases the peak electric field amplitude is limited by so-called intensity clamping [25], and THzfields will undergo strong diffraction. Thus, it is a priori not obvious whether THzfield amplitudes inside the interaction volume are strong enough to observe THz spectral self-action or not. In order to check this point, we resort to full 3D simulation data of two-color femtosecondfilamentation published earlier in [7]. In this work, collimated two-color pulses were launched in an argon atmosphere at ambient pressure in order to producefilaments at clamping intensity over several tens of centimeters. Simulations were performed using the unidirectional pulse propagation model [16,26]. Strong broadband THz emission was observed for pump pulses with a peak power of 0.3 TW, i.e., 30 times the critical power for self-focusing (see original article for details). Infigure7, we present the analysis of one of the 3D simulation data (20 fs Gaussian pulse, red curves infigure 3 from [7]), in complete analogy to figure5. To this end, we re-processed the raw data of the 3D simulation to extract the on-axis electricfield as a function of time and propagation distance. Then,figure7was produced by using these electricfield data. In particular, the dashed lines infigure7(b,d,f) were obtained by calculating the local current from the extracted electricfields with low frequency range (<200 THz) suppressed. Figure7clearly confirms that (i) sufficiently high THz amplitudes for THz spectral action can be generated in 3D geometry and (ii) THz spectral self-action modifies the spectrum of THz emission from two-color femtosecond filaments.
Figure 5. (a,c,e) Recorded on-axis electricfield spectrum from 2D-FDTD simulations at indicated propagation distances, with the low frequency part marked in red. (b,d,f) Corresponding on-axis local secondary emissionEJ( )ν ∝νJ( )ν in the range below 200 THz
(solid black lines). The dashed lines show the same quantity computed from a modified pump field with the low frequency part (<200THz) suppressed. (g) Peak electricfield amplitude and plasma density versus propagation distance z, with z = 0 denoting the focal point.
7
5. Conclusions
In conclusion, we have investigated THz emission via ionizing two-color femtosecond pulses and revealed a THz spectral self-action mechanism. This mechanism stems from the interaction of the already generated THzfield with the subsequent free electron dynamics in the plasma channel and contributes to the strong THz spectral broadening frequently observed in experiments and simulations. Direct simulations in 1D, 2D and 3D geometries support our semi-analytic model and show that diffraction of the THz radiation plays an important role in determining thefinal bandwidth of the secondary emission by limiting the interaction length of the low-frequencyfield with the plasma. We believe that our findings may have implications beyond the generation of broadband THz radiation, namely, on the interpretation of recent experiments on high harmonic generation with two-color pulses [27]. Because of the similar pump pulse configuration, generated THz radiation may alter
electron trajectories on time scales relevant to the high harmonic generation process as well (seefigure3(c)).
Acknowledgments
Numerical simulations were performed using high performance computing resources at Rechenzentrum Garching (RZG). We acknowledge the development of IPython [28]. ECG and SS acknowledge support by the project PRI-AIBDE-2011-0902 resp. DAAD-PPP-54367872. IB acknowledges the support of DFG (SFB-910).
Figure 6. (a) Spatially resolved electricfield spectrum (log scale) of the propagating beam in 2D-FDTD simulations obtained at 30 μm after the geometrical focus. Because of symmetry we show the positive transverse x-axis only. Line-outs of spatial profiles versus coordinate x for frequenciesν=375THz, ν = 750 THz andν=30THz are shown in panels (b), (c) and (d), respectively. The white dashed line in (a) serves as an eye-guide and shows the expected beam widthw ( )ν ∝1νfor a perfect Gaussian beam for all frequencies. Beam parameters are the same as infigure5.
8
References
[1] Tonouchi M 2007 Nat. Photonics1 97
[2] Kim K Y, Glownia J H, Taylor A J and Rodriguez G 2012 IEEE J. Quant. Electron48 797
[3] Cook D J and Hochstrasser R M 2000 Opt. Lett.25 1210
[4] Kress M, Löffler T, Eden S, Thomson M and Roskos H G 2004 Opt. Lett.29 1120
[5] Thomson M, Kress M, Löffler T and Roskos H 2007 Laser Photonics Rev.1 349
[6] Kim K Y, Taylor A J, Glownia J H and Rodriguez G 2008 Nat. Photonics2 605
[7] Bergé L, Skupin S, Köhler C, Babushkin I and Herrmann J 2013 Phys. Rev. Lett.110 073901
[8] Borodin A V, Panov N A, Kosareva O G, Andreeva V A, Esaulkov M N, Makarov V A, Shkurinov A P, Chin S L and Zhang X C 2013 Opt. Lett.38 1906
[9] Chen M, Pukhov A, Peng X Y and Willi O 2008 Phys. Rev. E78 046406
[10] Wang W M, Kawata S, Sheng Z M, Li Y T, Chen L M, Qian L J and Zhang J 2011 Opt. Lett.36 2608
[11] Oh T I, You Y S, Jhajj N, Rosenthal E W, Milchberg H M and Kim K 2013 New J. Phys.15 075002
[12] Wen H and Lindenberg A M 2009 Phys. Rev. Lett.103 023902
[13] Manceau J M, Averchi A, Bonaretti F, Faccio D, Di Trapani P, Couairon A and Tzortzakis S 2009 Opt. Lett.34 2165
[14] Bai Y, Song L, Xu R, Li C, Liu P, Zeng Z, Zhang Z, Lu H, Li R and Xu Z 2012 Phys. Rev. Lett.108 255004
[15] Babushkin I, Skupin S, Husakou A, Köhler C, Cabrera-Granado E, Bergé L and Herrmann J 2011 New J. Phys.13 123029
[16] Babushkin I, Kuehn W, Köhler C, Skupin S, Bergé L, Reimann K, Woerner M, Herrmann J and Elsaesser T 2010 Phys. Rev. Lett.105 053903
[17] Liu J, Dai J, Chin S L and Zhang X C 2010 Nat. Photonics4 627
[18] Huba J D (ed) 2013 NRL Plasma Formulary (Washington, DC: U.S. GPO)
[19] Jefimenko O D 1966 Electricity and Magnetism: An Introduction to the Theory of Electric and Magnetic Fields (New York: Appleton-Century-Crofts)
[20] Taflove A 1995 Computational Electrodynamics: The Finite-Difference Time-Domain Method (Norwood: Artech House) [21] Etrich C, Iliew R, Staliunas K, Lederer F and Egorov O A 2011 Phys. Rev. A84 021808
[22] Dalgarno A and Kingston A E 1960 Proc. R. Soc. London A259 424
[23] Babushkin I, Skupin S and Herrmann J 2010 Opt. Express18 9658
[24] Geltman S 1996 Phys. Rev. A54 2489
[25] Bergé L, Skupin S, Nuter R, Kasparian J and Wolf J P 2007 Rep. Prog. Phys.70 1633
[26] Kolesik M and Moloney J V 2004 Phys. Rev. E70 036604
[27] Brugnera L, Hoffmann D J, Siegel T, Frank F, Zaïr A, Tisch J W G and Marangos J P 2011 Phys. Rev. Lett.107 153902
[28] Pérez F and Granger B E 2007 Comput. Sci. Eng.9 21
Figure 7. (a,c,e) Recorded on-axis electricfield spectrum from 3D unidirectional pulse propagation simulations [7] at indicated propagation distances, with the low frequency part marked in red. (b,d,f) Corresponding on-axis local secondary emission
ν ∝ν ν
EJ( ) J( )in the range below 200 THz (solid black lines). The dashed lines show the same quantity computed from a modified pumpfield with the low frequency part (<200THz) suppressed. (g) Peak electricfield amplitude and plasma density versus propagation distance z.
9


![Figure 7. (a,c,e) Recorded on-axis electric fi eld spectrum from 3D unidirectional pulse propagation simulations [7] at indicated propagation distances, with the low frequency part marked in red](https://thumb-eu.123doks.com/thumbv2/123doknet/13121545.387494/11.892.179.829.89.597/recorded-unidirectional-propagation-simulations-indicated-propagation-distances-frequency.webp)
