HAL Id: hal-02086490
https://hal.archives-ouvertes.fr/hal-02086490
Submitted on 10 Dec 2020HAL is a multi-disciplinary open access
archive for the deposit and dissemination of sci-entific research documents, whether they are pub-lished or not. The documents may come from teaching and research institutions in France or abroad, or from public or private research centers.
L’archive ouverte pluridisciplinaire HAL, est destinée au dépôt et à la diffusion de documents scientifiques de niveau recherche, publiés ou non, émanant des établissements d’enseignement et de recherche français ou étrangers, des laboratoires publics ou privés.
Nanoscale hyperspectral imaging of tilted cholesteric
liquid crystal structures
Aurélie Jullien, Adriana Scarangella, Umberto Bortolozzo, Stefania Residori,
Michel Mitov
To cite this version:
Aurélie Jullien, Adriana Scarangella, Umberto Bortolozzo, Stefania Residori, Michel Mitov. Nanoscale hyperspectral imaging of tilted cholesteric liquid crystal structures. Soft Matter, Royal Society of Chemistry, 2019, 15 (15), pp.3256-3263. �10.1039/c8sm02506a�. �hal-02086490�
Nanoscale hyperspectral imaging of tilted
cholesteric liquid crystal structures
Aurélie Jullien,
∗,†Adriana Scarangella,
‡Umberto Bortolozzo,
†Stefania Residori,
†and Michel Mitov
∗,‡†Institut de Physique de Nice (InPhyNi), Université Côte d’Azur, CNRS UMR 7010, 1361 route des Lucioles, 06560 Valbonne, France
‡Centre d’Elaboration de Matériaux et d’Etudes Structurales (CEMES), CNRS UPR 8011, University Paul-Sabatier, 31055 Toulouse, France
E-mail: [email protected]; [email protected]
Abstract
Ongoing research on chiral liquid crystals takes benefit of the peculiar behavior of twisted structures subject to curvature. We demonstrate the fine tunability of the characteristics of the bandgap of a cholesteric structure for which the orientation of the helix axis is spatially changing. To date, the spectral resolution of the order of 6 nm, here reached by hyperspectral imaging, was not solved in tilted helices. A correlation between spectral shift and spatial twist is thus made possible.
1
Introduction
1.1
Main features of cholesteric liquid crystals
The cholesteric liquid crystal (CLC) phase exhibits a helical structure with a twist axis
perpendicular to the local molecular director1–3 (fig. 1). The term cholesteric was coined
in 1922 by Georges Friedel because this state of matter was discovered in cholesterol esters
by Friedrich Reinitzer in 1888.4,5 Since then, cholesteric-liquid-crystalline states have been
found in substances not connected with cholesterol and another name for the CLC phase is the chiral nematic phase, e.g. the (achiral) nematic phase in which a twist is introduced in a direction perpendicular to the long axis of molecules (rod-like molecules as in many thermotropic CLCs). The CLC phase is characterized by two structural parameters: the helical pitch (p) and twist sense. The pitch gives the distance along the axis that corresponds
to a rotation of 360◦ in the orientation of molecules. The twist sense determines a left- or
right-handed helix.
Figure 1: Schematic representation of a cholesteric liquid crystal. p is the helical pitch. When light propagates in the Bragg regime through a CLC slab with a planar texture, the medium produces interference colors and gives rise to the fundamental property of
selec-the maximum selective reflection occurs at a wavelength λ0 directly related to p by λ0 = np,
where n is the average refractive index (n = (no+ ne)/2 and no and ne are the ordinary
and extraordinary indices of refraction, respectively, which are measured in directions per-pendicular and parallel to the local (uniaxial) director, respectively). The bandwidth ∆λ
is related to the birefringence ∆n = ne − no and p through the relationship ∆λ = p∆n.
Incident light with a wavelength λ not included in ∆λ is transmitted. ∆λ is limited to a few tens of nanometers in the visible spectrum because the birefringence of current cholesteric compounds is typically limited to 0.5.
Unlike common mirrors, which reverse the polarisation on reflection, the planar tex-ture reflects light with the same circular polarisation handedness as the twist sense of the cholesteric helix, and the other polarisation is transmitted. This constitutes the polarisation-selectivity rule, which is valid only at normal incidence. As a consequence, up to 50% of the ambient unpolarised light at the selective wavelength can be reflected. At oblique incidence, the reflected or transmitted light is elliptically polarised.
1.2
State-of-the-art and motivation of the research
The characteristics of the Bragg band are tunable by acting on the following structural parameters: (1) the pitch, (2) the helicity sense and (3) the orientation of the helix (fig. 1).
(1) Modulating the pitch means modulating the reflection color. Earlier contributions
have consisted in superimposing several cholesteric cells with different colors.12 Based on
multiple layers and interfaces, this solution can introduce parasite reflections and light scat-tering, and smooth variations of the pitch are not made possible. From mid-1990s, research activities oriented towards the fabrication of continuous pitch gradients inside single lay-ers.13,14
(2)In 2006, the reflectance limit of 50% was exceeded by generating both helicity senses in
a single layer of gel.15The topic of CLC materials with enlarged bandgap, as a consequence of
To date, pitch-gradient CLCs have generated much more solutions and publications than dual helicity CLCs.
(3) Fewer are the papers on tilted helices (our present framework). , however it appears
that the topic of planar films with a spatially-variable orientation of the helical axis gained
some revival in 2017-18 by inspiring different research.20–27 In 2011, tuning the orientation
of the twist and, in return, of the macroscopic color of a CLC slab with a polygonal texture
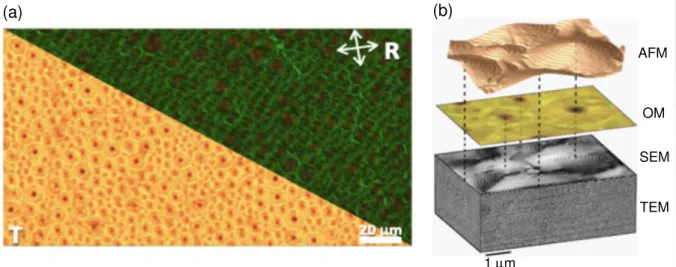
was demonstrated.28 Polygonal textures (Figure 2(a)), made of an array of micrometer-scale
polygonal cells, can be observed in flat CLC films when the helical axis is strongly tilted with respect to the substrates. This situation is promoted in an open film via an hybrid anchoring of molecules, which preferentially align tangentially to the solid substrate on which the CLC is coated and perpendicularly to the air interface. Polygonal fingerprint textures were imaged
by optical microscopy in large-pitch low-molar-mass CLCs in the early 1970s.29,30 In
mid-1990s, polygonal textures (in the film plane, like in Figure 2(a) and nested-arc textures (polygonal textures when observed in a transverse direction, as seen in the cross-sectional view in Figure 2(b)) were imaged in CLC oligomers similar to those of the present study
by TEM31 and AFM.32,33 Figure 2(b) gives the three-dimensional representation of the
polygonal texture by combining different microscopy methods.28 AFM imaging reveals the
cone shape of polygons, which are the locus of double-spiral patterned lines. The relief of polygons results from the competition between the surface energy and the bulk (free) energy. The surface tension minimizes the surface area by rearranging the fluid interface from a
planar state to a polygonal field.29 The energy is lowered by transforming the free surface
into a cone, thus reducing the bulk distortion energy at the cost of surface energy. It should be noted that the formation of series of valleys and crests at the free surface of LC films with
antagonist anchoring is also observable in nematic LC films.34 The double-spiral structures
correspond to the adaptation of the cholesteric structure to the relief and the anchoring conditions at the limits: rod-like molecules preferentially align tangentially to the substrate and perpendicularly to the air interface. Close to the air, the twisted structure cannot readily
adapt to the anchoring conditions. One solution to this boundary problem is the creation of
a series of alternating disclination lines at the surface.30 Nested-arc patterns (Figure 2(b))
develop because the anchoring at the free surface favors an oblique orientation of the helical axis relative to the surface. Such a situation corresponds to the director distribution of least elastic energy that allows for this surface anchoring together with the bulk planar structure.
(a) (b) AFM OM SEM TEM 1 µm
Figure 2: (a) Polygonal textures observed in the cholesteric material of the present study by optical microscopy in transmission (unpolarized light) and reflection (crossed polariz-ers) modes. The white arrows indicate the crossed polarizers orientation for the reflection mode. The micrographs reveal a mosaic of polygons with various sizes. (b) 3D structure of the polygonal texture by combing different microscopy methods: atomic force microscopy (AFM), optical microscopy (OM), scanning electron microscopy (SEM) and transmission
electron microscopy (TEM).28 The dotted lines link polygon vertices. ©The authors 2011.
Recent investigations on polygonal textures have focused on glass-forming oligomers.35–39
After quenching below the glass-transition temperature, the structure and the color prop-erties are stored inside a solid film ready to be handled at room temperature. Polygonal texture may act as a network of microlenses with wavelength-tunable focusing properties
(spot or donut).37The microlens size plays a role on the focused light intensity and the focal
length as well.40
The cholesteric structure is a recurring design in living matter, in vivo and in vitro,41and
gloriosa they were imaged by TEM,42 SEM43,44 and fluorescence confocal microscopy45.
Singularly, polygons behave as multiwavelength micromirrors in the cuticle of scarab beetle
Chrysina gloriosa.44 Synthetic and biological textures look similar by optical microscopy
but their internal structure and their optical response at the scale of single polygons reveal
fundamental differences.46
Revealing the internal structure of thermotropic CLCs was made possible by a variety
of imaging techniques such as TEM,31,47,48 SEM,49,50 AFM,32,33,51,52 fluorescence confocal
microscopy,53–55 multimodal nonlinear optical microscopy56 or super-resolution stimulated
emission depletion microscopy.57
Our purpose is to perform jointly spectral and spatial determination of CLCs with oblique helicity through a LC-based hyperspectral imaging (HSI), which is a compact and non-destructive technique ideally adapted to our objectives. Although LCs have already been
used to perform multispectral imaging,58 and, recently even HSI,59,60 they have not been,
to date, the subject of an HSI study. Spectro-spatial properties of the polygonal texture are measured with unprecedented spectral resolution for tilted CLCs, that is 6 nm over 400-1000nm. In particular, we demonstrate that a fine tuning of the spectral characteristics of the bandgap is possible into the part of a polygon in which the orientation of the helix axis is spatially changing. A correlation between spatial changes as shown in Figure 2(b) and spectral changes is therefore made possible.
2
Experimental setup
2.1
Material and preparation of samples
CLC oligomers from Wacker Chemie GmbH were used.61 The molecule consists of a siloxane
cyclic chain to which two types of side chains are attached via aliphatic spacers: an achiral
mesogen and a chiral mesogen (the chemical formula is given in62). The pitch and the
Green (SG) compound for which the mean position of the reflection band is located at ∼ 540 nm. The cholesteric structure is left-handed. The ordinary and extraordinary refractive
indices are assessed to be n0 = 1.4 and ne = 1.6.63 The cholesteric phase appears between
180-210◦C (clearing temperature range) and 40-50◦C (glass-transition temperature range).
We were easily able to freeze the film into a glassy solid state by simple thermal quenching on a metal plate after annealing. Advantageously, the optical film can be studied at room temperature.
The film was confined between two glass substrates (plate plus cover lamella) separated by spacers. The thickness of the film was found equal to 31.5 ± 1.5µm, as measured by interference method (based on the wave interference due to the internal reflection between
the two inner surfaces of the cell substrates64). No surface treatment or alignment layers
were used. The samples were kept in the cholesteric phase at 105◦C for 5 minutes. After
quenching, the film changed from a viscous to a glassy solid state. The samples were kept
at a low temperature (2◦C) for 5 minutes in order to remove the cover lamella and to
obtain a smooth interface. The film is kept in a viscous state at 140◦C for 85 minutes. The
polygonal texture spontaneously nucleates and grows. The film was finally quenched at room temperature.
2.2
Salient features of the hyperspectral imaging instrument
HSI delivers the image of a given sample, spectrally-resolved with numerous, narrow and
adjacent spectral bands.65 To do so, several methods have been proposed, among which
the combination of a Fourier spectrometer with an imaging system provides high-spectral
resolution with high signal-to-noise ratio.66 In this approach, the Fourier spectrometer is
either an intensity or a polarization interferometer.
In the current experiment, we make use of a formerly described LC-based HSI instrument,
sized so that two nematic LCs act as a Fourier spectrometer.59,67 Here, we summarize the
LC cells as a Fourier spectrometer when appropriately sized and driven with a dynamic volt-age step (Figure 3). The introduced optical phase-shift is then governed by the molecular orientation, tuning the LC birefringence. Once inserted into an imaging system with a 2D detector in the image plane, this polarization interferometer becomes an imaging spectrom-eter, or instrument for hyperspectral imaging. Collinear and free from moving parts, the setup is characterized by compactness and robustness.
Our approach has enabled to achieve a high spectral resolution over a broad spectral bandwidth for the following reasons. The spectral resolution of a Fourier spectrometer is inversely proportional to the introduced phase shift. To optimize this value, one needs to consider using a thick birefringent medium. We have thus demonstrated the ability to exploit the birefringence of thick nematic cells (200µm), and to control them dynamically. In order to avoid diffusion and optical losses due to the Freédericksz transition in thick nematic
layers,68 we exploit the transient relaxation of the molecules. By applying a bias voltage
onto the cell, LC molecules are brought out of equilibrium, then, the voltage is switched off, and LC molecules are dynamically driven back to their rest position. As the voltage step is applied, a fast scan of the optical phase shift is obtained. Finally, the interferometer is
calibrated thanks to broadband spectral interferometry with femtosecond laser pulses.69,70
As a result, the instrument output is an image with 512*128 pixels, each of them being spectrally resolved with a 6 nm resolution over 400nm-1000nm, that is a data set of 13.3M points. Extracted results then include the spectral transmittance or reflectance of a given pixel or cluster of pixels, but also monochromatic images of the sample (one hundred available
between 400nm and 1000nm), and finally the typical hyperspectral datacube.65
Hyperspectral imaging will thus undoubtedly provide a novel and enriched insight of the studied material. Furthermore, the proposed instrument is adapted to transmitting and reflective microscopy with a high field of view, and therefore particularly suited to image a CLC with polygonal texture. As underlined previously, this texture presents some contrasted wavelength-tunable light shaping properties on a micrometer spatial scale.
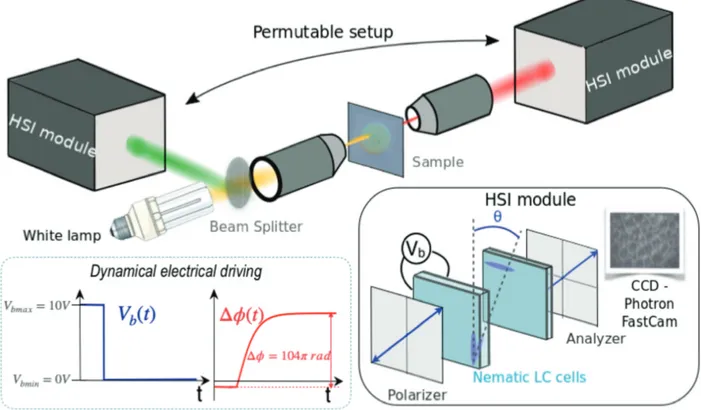
Figure 3: Experimental setup. The sample is positioned in the confocal plane of two micro-scopic objectives and illuminated with unpolarized white light. A beam splitter enables to collect the reflected light. The HSI instrument consists in two nematic LC cells comprised between two parallel polarizers and a fast camera. The anchoring conditions are planar (splay configuration) for both cells. The first polarizer creates two crossed-polarized waves propagating with different velocity in the birefringent nematics. One thick cell (200 µm), electrically-addressed, provides a tunable optical path delay between the two polarization
directions. This cell is dynamically driven : the bias voltage (Vb(t)) controls the nematic
molecular orientation (θ), so as to tune the introduced optical phase-shift (∆φ(t)), as indi-cated in the inset. The voltage step is 10V-0V and the overall introduced phase shift is 104π rad. A thin static cell, with crossed orientation with respect to the first one, is used as a temporal offset. The analyzer then permits the interference of the two phase-shifted waves. The module can be alternatively positioned in the transmitted or reflected beam, with the detector in the image plane. The images are then acquired every 8 ms during the nematic
2.3
Technical details
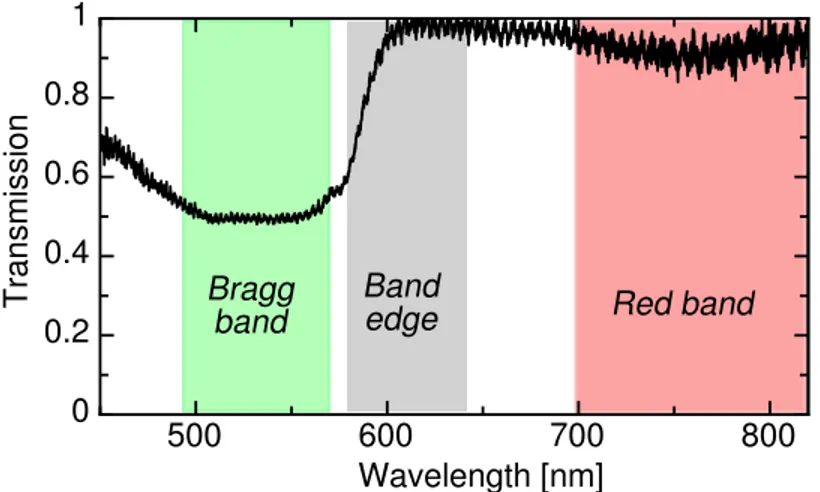
The experimental setup is sketched in Figure 3. The sample is inserted between confocal microscopic objectives and illuminated with unpolarized white light on a ∼ 150µm diameter area. The hyperspectral module enables to perform the analysis of the transmitted or re-flected light, as shown in the Figure. The average experimental sample spectral transmission
(e.g. not spatially-resolved) is shown in Figure 4. Following,37we define three relevant
spec-tral bands : the Bragg band corresponding to the reflected bandgap of the CLC structure
(λ0 ∼ 530nm, ∆λ ∼ 80nm), the band edge for the increasing spectral transmission edge at
the end of the gap (570 nm - 650 nm) and the red band further away from the Bragg band (λ > 700nm).
Wavelength [nm] Transmission Bragg
band
Band
edge Red band
500 600 700 800 0 0.2 0.4 0.6 0.8 1
Figure 4: Experimental spectral transmission of the CLC sample and definition of three relevant spectral bands (see text).
3
Results and discussion
3.1
Hyperspectral imaging in transmission
We first focus on the transmission study (the beam enters the sample from the side with the substrate). The main results appear in Figure 5.
400 500 600 700 800 900 0 5 10 15 20 25 Wavelength [nm]
Spectral intensity [arb. u.]
Transmitted intensity [arb. u.]
Transmitted spectral intensity [arb. u.]
(a) (b) (c) 553 nm 587 nm 621 nm 767 nm 692 nm 667 nm X (30µm) X (30µm) X (30µm) X (30µm) X (30µm) X (30µm) Y (40 µ m) Y (40 µ m) Y (40 µ m) Y (40 µ m) Y (40 µ m) Y (40 µ m) X (20µm) Y (20 µ m) Y X λ(nm) 4µm 4µm 0 400500 600700 800900 1000 2 6 10 14 18 2 4 6 8 10
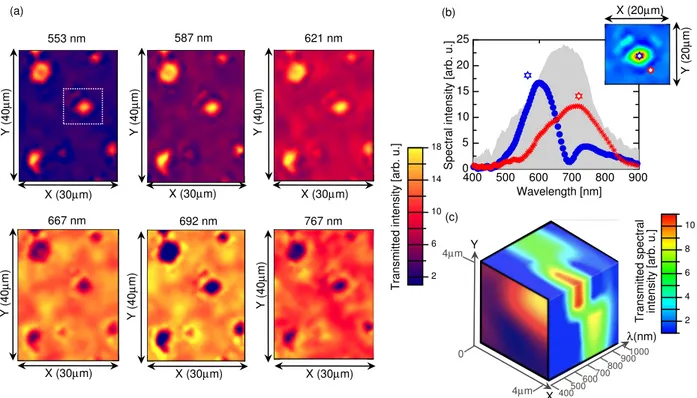
Figure 5: HSI analysis in transmission. (a) Some chosen monochromatic images of an array (30µm by 40µm) of polygons. The dashed white ZOI refers to (b). (b) Zoom on a polygon (represented in false colors) and measured transmitted spectral intensity for two spatial area: center and edge of the polygonal structure. The line color refers to the star color in the image and the shaded area is the lamp spectrum shown for comparison. (c) Hyperspectral data cube of a quarter of a polygon.
wavelengths (553nm, 587nm, 621nm, 667nm, 692nm, 767nm) are arbitrarily chosen among the one hundred available, as they enable to picture the evolution of the transmitted pattern. In the Bragg band and band-edge (images 553nm and 587nm), the light is mainly focused into the central part of the polygons, with a slightly narrower pattern and a lower transmission in the Bragg band. Indeed, due to the polarization-selectivity rule, no more than 50% of unpolarized incident light is reflected by a CLC slab with planar Grandjean texture. In the red band (images 692nm and 767nm), the pattern is inverted, as mainly the surrounding edges of the polygons focus this part of the spectrum, leading to a cluster of donut shapes. Between the band edge and the red band, one can see the progressive vanishing of the patterns, as the two spatial area (top of the polygon and lateral side) contribute to the transmission.
These observations are supported by the fine spectral distribution analysis of the image. We isolate the image of one polygon, as shown in Figure 5(b) and resolve the transmitted spectrum of each pixel. Figure 5(b) then compares the spectra from the center and the edge of the polygon, underlying their different spectral contribution. The maximum spectral intensity belongs to the band edge for the center with an optimum transmission around 600 nm, and to the red band for the edges. In the latter case, the maximum transmission is located around 750 nm.
Finally, these results are illustrated by the hyperspectral data cube (Figure 5(c)). A quarter of the polygon is deliberately selected, so as the lateral spectral maps underline the change of spectral transmission. Therefore, even in the mesoscopic spatial scale involved here, one can appreciate at a glance the spectral gradual changes simultaneously with the spatial modulation of the intensity.
To conclude this part, the HSI technique enables to spatially resolve the transmission spectrum of samples exhibiting chromatic patterns on a mesoscopic scale, with a spectral resolution much higher than conventional multispectral microscopy, usually limited to a few
the polygonal texture. This is achieved in the next section with the reflection study.
3.2
Hyperspectral imaging in reflection
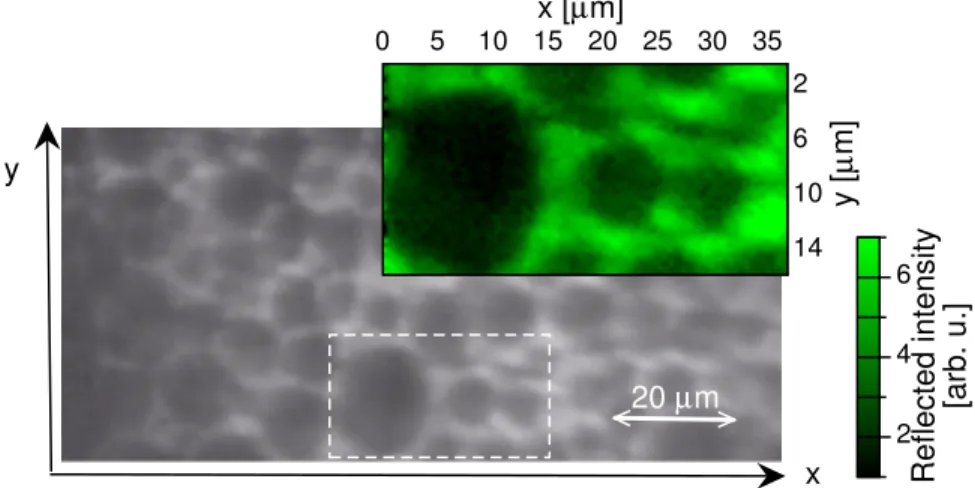
y 20 µm 2 4 6 Reflected intensity [arb. u.] 0 5 10 15 20 25 30 35 2 6 10 14 x [µm] y [ µ m] x
Figure 6: Unpolarized light microscopy in reflection of the sample. Dashed white line indi-cates the Z.O.I. The color plot is the monochromatic image of Z.O.I issued from HSI analysis for λ = 531nm (HSI module is in reflection mode).
For reflective measurements, the HSI module is moved in reflection mode and the free surface of the sample is exposed to the incident beam. Figure 6 represents the sample in the image plane. The first step of the analysis consists in extracting the monochromatic image of the zone of interest (Z.O.I.) chosen in Figure 6, corresponding to the maximum of spectral reflection, that is λ = 531nm, close to the center of the Bragg band. The polygons edges are then particularly bright, they mainly contribute to the light reflection in the spectral Bragg band.
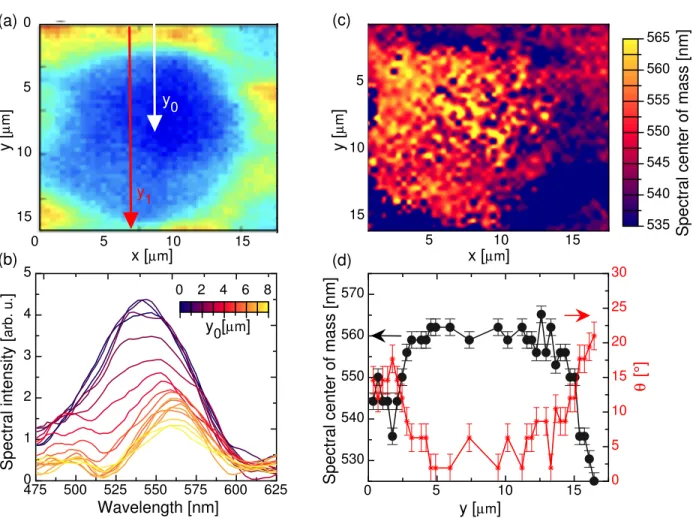
To go further, we isolate the large polygon on the left of the Z.O.I. (Figure 7(a)) and analyze the spectral evolution of the reflected light from the polygon edge to the center (along y direction). A background originating from partial lamp reflection on the substrate is subtracted. The resulting spectra are shown in Figure 7(b). From the edge to the center, in addition to a progressive decrease in intensity, one can see a red-shift of the maximum spectral intensity. This observation is confirmed by plotting the 2D spatial map of the
Spectral center of mass [nm] 5 10 15 5 10 15 x [µm] y [ µ m ] 535 540 545 550 555 560 565 (c) 0 5 10 15 530 540 550 560 570 0 5 10 15 20 25 30 y [µm] (d) θ [°]
Spectral center of mass [nm]
(a) 0 5 10 15 0 5 10 15 y0 x [µm] y [ µ m ] y1 475 500 525 550 575 600 625 0 1 2 3 4 5 Wavelength [nm] Spectral intensity [ arb. u. ] y0[µm] (b) 0 2 4 6 8
Figure 7: HSI analysis in reflection (a) Zoom on a large polygonal structure registered with the full white light spectrum (400nm-1000nm) and plotted in false colors. (b) Measured
reflected spectral intensity along the y0 direction indicated with the white arrow (a). The
line colors refer to the position on y0 and the spatial increment between two spectra is
∼ 0.5µm. The background spectrum originating from the lamp reflection on the substrate
is subtracted. (c) Color-map of the spatial distribution of the center of mass of the reflected
spectra. (d) Grey : Measured spectral center of mass as a function of y along the y1 direction
defined as follows :
λCM =
R λI(λ)dλ
R I(λ)dλ (1)
The spectrum of the light reflected in the center of the polygon is red-shifted compare to the main Bragg reflection, the whole spectral shift being spread over 30 nm only, with clear-cut increments of 6 nm. Although quite significant, the spectral shift is too narrow to be detected with traditional colored filters and a high-spectral resolution technique is necessary.
The explanation of the spectral shift resides in the conception of the polygonal texture. As mentioned in the introduction, the pattern relies on a twisted structure whose the orientation of the helical axis is slightly changing into the volume of the lateral part of a polygon.
Transmission electron microscopy images have given a direct evidence of this situation.28
This spatially-variable orientation of the twisted structure is accompanied with the spatial light-shaping property and its spectral dependence. In reflection, the orientation-changing
twist is associated to a change of the Bragg band following:16
λ0 = npcos(θ) (2)
with n the average refractive index of the LC, p the pitch of the helix and θ the angle between the helical axis and the direction of the incident light, which is kept as constant (normal to the film surface). Therefore, the HSI measurement of the transverse modulation of the central reflected wavelength enables to directly picture the local tilt of the helical axis on a micrometer spatial scale. To deduce θ from our measurements, we consider an average refractive index n = 1.5 and a pitch p = 330nm. The results obtained across a y-cross-section of Figure 7(a) are shown in Figure 7(d). The helical axis is found twisted by nearly
20◦ between the center and the edges of the polygon.
The HSI technique thus provides an original optical description of a complex twisted structure and supplies the measurement of the local oblique character of the helical axis.
4
Conclusions
To conclude, we have applied a compact liquid-crystal based hyperspectral imaging sys-tem, both in transmission and reflection, to a CLC with oblique helicity. The analysis of the transmitted light has confirmed the wavelength-tunable light shaping properties of the polygonal texture, seen as a micro-lenses array, with unprecedented spectral resolution (6nm over 400nm-1000nm spectral bandwidth). These spatio-spectral properties have been em-phasized through the reconstruction of the hyperspectral data-cube of a quarter of a polygon. Furthermore, the reflected light analysis of a single polygon (lateral dimension below 15µm) has revealed the local tilting of the CLC helical axis, that is the bulk distortion constituting the texture. The signature resides in the fine tuning of the spectral characteristics of the bandgap into the part of a polygon in which the orientation of the helix is spatially changing. To date, such a spectral resolution was not solved in tilted CLCs. A correlation between spatial changes, as imaged by the past, and spectral changes has been made possible with the proposed simple and non-destructive imaging method.
Additionally, these results have demonstrated the interest of hyperspectral imaging for the precise study of complex cholesteric components, also existing in biological samples. It thus opens many perspectives to enrich and deepen our knowledge on the fine structure of these materials.
Conflicts of interest
There are no conflicts to declare.
Acknowledgement
The authors thank the Agence Nationale de la Recherche (France) for financial support (Grant: ANR-17-CE30-0025) and Dr. E. Hanelt from Wacker-Chemie GmbH (Munich,
Germany) for providing them with oligomers. Experimental contribution from K. Talbi is acknowledged.
References
(1) H. Kelker and R. Hatz, Handbook of Liquid Crystals, Verlag Chemie, Weinheim, Ger-many, pp. 293-337, 1980
(2) V. A. Belyakov and V. E. Dmitrienko, Sov. Sci. Rev. A Phys., 1989, 13, 1-212.
(3) I. Dierking, Polymer-modified Liquid Crystals, I. Dierking ed., Royal Society of Chem-istry, 2019.
(4) T. J. Sluckin, D. A. Dunmur, and H. Stegemeyer, Crystals that flow-Classic papers from
the history of liquid crystals’, Taylor & Francis, 2004.
(5) M. Mitov, Chem Phys Chem, 2014, 15, 1245-1250.
(6) W. D. St-John, W. J. Fritz, Z. J. Lu and D.-K. Yang, Phys. Rev. E, 1995, 51, 1191. (7) H. Hirschmann, V. Reiffenrath, Handbook of Liquid Crystals, Vol. 2A, D. Demus, J.
Goodby, G. W. Gray, H.-W. Spiess and V. Vill eds., Wiley-VCH, Weinheim, Germany, p. 199, 1998.
(8) R. Smith, D. R. Sabatino, T. J. Praisner, Exp. in Fluids, 2001, 30, 190-201. (9) N. Tamaoki, Adv. Mat., 2001, 13, 1135-1147.
(10) S.-T. Wu and D.-K. Yang, Reflective Liquid Crystal Displays, John Wiley & Sons Ltd., Chichester, England, 2001.
(11) S. P. Palto, L. M. Blinov, M. I. Barnik, V. V. Lazarev, B. A. Umanskii and N. M. Shtykov, Crystallogr. Rep., 2011, 56, 622-649.
(12) D. M. Makow and C. Leroy-Sanders, Nature, 1978, 276, 48. (13) D. J. Broer, J. Lub and G. N. Mol, Nature, 1995, 378, 467.
(14) M. Mitov, A. Boudet and P. Sopena, Eur. Phys. J. B, 1999, 8, 327. (15) M. Mitov and N. Dessaud, Nature Mater., 2006, 5, 361.
(16) M. Mitov, Advanced Materials, 2012, 24, 6260.
(17) L. Y. Zhang, Y. Z. Gao, P. Song, X. J. Wu, X. Yuan, B. F. He, X. W. Chen, W. Hu, R. W. Guo, H. J. Ding, J. M. Xiao and H. Yang, Chin. Phys. B, 2016, 25, 096101. (18) R. Balamurugan and J.-H. Liu, Reac. Func. Polym., 2016, 105, 9.
(19) J. Sun, W. Zhang, M. Wang, L. Zhang and H.Yang, Liquid Crystal Sensors, A. P. H. J. Schenning, G. P. Crawford and D. J. Broer Eds. Taylor and Francis, 2018.
(20) P. Popov, L. W. Honaker, M. Mirheydari, E. K. Mann and A. Jakli, Scientif. Reports, 2017, 7, 1603.
(21) M. Yu, H. Yang and D.-K. Yang, Soft Matter, 2017, 13, 8728.
(22) H. K. Bisoyi, T. J. Bunning, and Q. Li, Adv. Mater., 2018, 30, 1706512.
(23) O. S. Iadlovska, G. R. Maxwell, G. Babakhanova, G. H. Mehl, C. Welch, S. V. Shiyanovskii and O. D. Lavrentovich, Opt. Lett., 2018, 43, 1850.
(24) C. Lim, S. Bae, S. M. Jeong and N. Y. Ha, ACS Appl. Mater. Interfaces, 2018, 10, 12060.
(25) P. Rofouie, Z. Wang and A. D. Rey, Soft Matter, 2018, 14, 5180.
(26) V. P. Tondiglia, M. Rumi, I. U. Idehenre, K. M. Lee, J. F. Binzer, P.P. Banerjee, D. R. Evans, M. E. McConney, T. J. Bunning and T. J. White, Adv. Opt. Mat., 2018, 6,
(27) M. Rumi, T. J. Bunning and T. J. White, Soft Matter, 2018, 14, 8883-8894. (28) G. Agez, R. Bitar and M. Mitov, Soft Matter, 2011, 7, 2841.
(29) Y. Bouligand, J. Phys., 1972, 33, 715.
(30) A. Saupe, Mol. Cryst. Liq. Cryst., 1973, 21, 211-238.
(31) T. J. Bunning, D. L. Vezie, P. F. Lloyd, P. D. Haaland, E. L. Thomas and W. W. Adams, Liq. Cryst., 1994, 16, 769-781.
(32) R. Meister, H. Dumoulin, M.-A. Hallé and P. Pieranski, J. Phys. II France, 1996, 6, 827-844.
(33) R. Meister, M.-A. Hallé, H. Dumoulin and P. Pieranski, Phys. Rev E., 1996, 54, 3771-3782.
(34) P.-G. de Gennes and J. Prost, The Physics of Liquid Crystals, Oxford University Press, Oxford, pp. 174-176, 1993.
(35) A. Bobrovsky, K. Mochalov, A. Chistyakov, V. Oleinikov, and V. Shibaev, Macromol.
Chem. Phys., 2012, 213, 2639.
(36) A. Bobrovsky, O. Sinitsyna, A. Abramchuk, I. Yaminsky, and V. Shibaev, Phys. Rev.
E, 2013, 87, 012503.
(37) C. Bayon, G. Agez and M. Mitov, Lab on a Chip, 2014, 14, 2063.
(38) O. V. Sinitsyna, A. Y. Bobrovsky, G. B. Meshkov, I. V. Yaminsky and V. P. Shibaev,
J. Phys. Chem. B, 2015, 119, 12708.
(39) O. V. Sinitsyna, A. Y. Bobrovsky, G. B. Meshkov, I. V. Yaminsky and V. P. Shibaev,
J. Phys. Chem. B, 2017, 121, 5407.
(41) M. Mitov, Soft Matter, 2017, 13, 4176-4209. (42) A. Pace, Science, 1972, 176, 678-680.
(43) L. Fernandez del Rio, A. Arwin, K. Järrendahl, Thin Solid Films, 2014, 571, 410-415. (44) G. Agez, C. Bayon and M. Mitov, Acta Biomater., 2017, 48, 357.
(45) V. Sharma, M. Crne, J. O. Park, M. Srinivasarao, Science, 2009, 325, 449-451. (46) G. Agez, C. Bayon and M. Mitov, Proc. SPIE, 2017, 10125, 10125OU.
(47) H. Hara, T. Satoh, T. Toya, S. Ikeda, S. Orii and J. Watanabe, Macromolecules, 1988,
21, 14-19.
(48) A. Boudet, C. Binet, M. Mitov, C. Bourgerette and E. Boucher, Eur. Phys. J. E, 2000,
2, 247-253.
(49) J. Voss and B. Voss, Z. Naturforsch. A, 1976, 31, 1661-1663.
(50) M. Mitov, A. Boudet, P. Sopena and P. Sixou, Liq. Cryst., 1997, 23, 903-910. (51) Y. Huang, Y. Q. Yang and J. Petermann, Polymer, 1998, 39, 5301-5306.
(52) A. Boudet, M. Mitov, C. Bourgerette, T. Ondarçuhu and R. Coratger, Ultramicroscopy, 2001, 88, 219-229
(53) G. A. Held, L. L. Kosbar, I. Dierking, A. C. Lowe, G. Grinstein, V. Lee, and R. D. Miller, Phys. Rev. Lett., 1997, 79, 3443-3446.
(54) I. I. Smalyukh and O. D. Lavrentovich, Phys. Rev. E, 2002, 66, 051703.
(55) B. I. Senyuk, I. I. Smalyukh, and O. D. Lavrentovich, Phys. Rev. E, 2006, 74, 011712. (56) T. Lee, R. P. Trivedi and I. I. Smalyukh, Opt. Lett., 2010, 35, 3447-3449.
(58) M. Abuleil and I. Abdulhalim, Opt. Lett., 2016, 41, 1957.
(59) A. Jullien, R. Pascal, U. Bortolozzo,N. Forget and S. Residori, Optica, 2017, 4, 400. (60) I. August, Y. Oiknine, M. AbuLeil and A. Stern, Nat. Scient. Rep., 2016, 6, 23524. (61) F.-H. Kreuzer, N. Haberle, H. Leigeber, R. Maurer, J. Stohrer, and J. Weis,
Organosil-icon Chemistry Set, eds. N. Auner and J. Weis, Wiley-VCH Verlag GmbH, pp. 566-586,
2005.
(62) G. Agez, and M. Mitov, J. Phys. Chem. B, 2011, 115, 642.
(63) D. C. Zografopoulos, E. E. Kriezis, M. Mitov, and C. Binet, Phys. Rev. E, 2006, 73, 061701.
(64) K. H. Yang, J. App. Phys., 1988, 64, 4780.
(65) H. F. Grahn and P. Geladi, Techniques and applications of hyperspectral analysis, Wiley, 2007.
(66) P. R. Griffiths and J. A. de Haseth, Fourier Transform Infrared Spectrometry, Wiley, 2007.
(67) A. Jullien, R. Pascal, U. Bortolozzo,N. Forget and S. Residori, Proc. SPIE Slow Light,
Fast Light and Opto-Atomic Precision Metrology, 2017, 10119.
(68) V. M. DiPietro, A. Jullien, U. Bortolozzo, N. Forget and S. Residori, Opt. Exp., 2018,
26, 10716.
(69) L. Lepetit, G. Chériaux and M. Joffre, J. Opt. Soc. Am. B, 1995, 12, 2467–2474. (70) A. Jullien, U. Bortolozzo, S. Grabielle, J.-P. Huignard, N. Forget and S. Residori, Opt.
Exp., 2016, 24, 14483.