Publisher’s version / Version de l'éditeur:
Technical Note (National Research Council of Canada. Division of Building Research), 1973-09-01
READ THESE TERMS AND CONDITIONS CAREFULLY BEFORE USING THIS WEBSITE. https://nrc-publications.canada.ca/eng/copyright
Vous avez des questions? Nous pouvons vous aider. Pour communiquer directement avec un auteur, consultez la
première page de la revue dans laquelle son article a été publié afin de trouver ses coordonnées. Si vous n’arrivez pas à les repérer, communiquez avec nous à [email protected].
Questions? Contact the NRC Publications Archive team at
[email protected]. If you wish to email the authors directly, please see the first page of the publication for their contact information.
NRC Publications Archive
Archives des publications du CNRC
For the publisher’s version, please access the DOI link below./ Pour consulter la version de l’éditeur, utilisez le lien DOI ci-dessous.
https://doi.org/10.4224/20338485
Access and use of this website and the material on it are subject to the Terms and Conditions set forth at
Exploratory Tests with Ionization Chamber Smoke Detector Heads
McGuire, J. H.
https://publications-cnrc.canada.ca/fra/droits
L’accès à ce site Web et l’utilisation de son contenu sont assujettis aux conditions présentées dans le site LISEZ CES CONDITIONS ATTENTIVEMENT AVANT D’UTILISER CE SITE WEB.
NRC Publications Record / Notice d'Archives des publications de CNRC: https://nrc-publications.canada.ca/eng/view/object/?id=6f602764-7932-4406-a30c-f130e17f816c https://publications-cnrc.canada.ca/fra/voir/objet/?id=6f602764-7932-4406-a30c-f130e17f816c
DIVISION OF BUILDING RESEARCH
NATIONAL RESEARCH COUNCIL OF CANADA
TECIHIN JIeAL
NOTJE
No.
578
PREPARED BY
J. H. McGuire CHECKED BY GWS APPROVED BY NBH
PREPARED FOR
SUBJECT
DATE
- September 1973
CSA Subcommittee on Automatic Detectors, Smoke CSA B222. 4.1
EXPLORATOR Y TESTS WITH IONIZATION CHAMBER SMOKE DETECTOR HEADS
The investigation reported in this Note was carried out to learn whether the limiting sensitivity of an ionization chamber could be
determined by a single simple test rather than by several tests using various fuels as is currently practiced by Underwriters' Laboratories.
Two considerations led to the suggestion that a simple test
using a single fuel would suffice. Firstly, simple theory suggests
that, provided a chamber is not operating near the saturation regime, neither its geometry nor the nature of the ionizing source should influence
the relative limiting sensitivity for different fuels. In other words, if
one detector requires twice as much of fuel A to give a response as of fuel B, then so should another detector. regardless of whether its absolute sensitivity be comparable.
Response results from ion recombination which. away from the saturation regime, should be inversely proportional to ion mobility
and thus directly proportional to ionic mas s. The nature of the ionizing
source is not relevant to relative sensitivity for different fuels and, if
a long time scale eliminates transient effects such as those associated with diffusion within the chamber. then relative limiting sensitivity (in relation to different fuels) should be invariant.
•セ ••1# ., セセ G[Zセ ',. • " '"w c' ( セ
2
-2-The second factor implying the validity of the suggestion is that a manufacturer does, in fact, ma,rket an instrument incorporating an ionization chamber sensing device that claims to measure particle concentrations in units of mass per unit volume regardless of the source.
Investigation of the validity of this concept was initiated by examining and developing the many test results from detectors of this
nature listed in an Underwriters' Laboratories Report (l). This was
followed by an exploratory experimental program. UL Results
The UL results utilized were the response times of five detectors tested at six spacings from various magnitudes of fires involving eight
fuels (1). The first approach adopted was to choose, for each fuel, a
merit sequence of the detectors on the basis that the greater the maximum distance at which a detector would respond to a fire the higher its merit
rating. For some fuels it was possible to derive such a sequence for
each of four different fuel levels. Where, for a single fuel, the several
sequences were not quite identical, a single sequence representative
of the fuel was obtained. The latter sequences are listed in Table I
in which the letters represent particular brands of detectors and where brackets around two or more letters indicate that no merit differentiation was possible between them.
The outstanding feature of the Table is that detector C does not
fit in with the two merit sequences that are apparent. Detector C was,
in fact, not an ionization chamber type detector; the remainder were. Dismissing C from further consideration, together with the fuel alcohol to which ionization chamber detectors will not respond, it can be seen that there is substantial agreement between the merit sequences within
each column. At minimum sensitivity the only departure from agreement
is the interchange of A and B in the response to excelsior. Other
sequences relate to cellulosic, plastic and hydrocarbon fuels and yet
all are idEmtical, except that differentiation between D and E was not
always possible.
At maximum sensitivity a more significant departure, that might
be related to fuel, is apparent. For the cellulosic fuels the sequence is
BE, whereas for the hydrocarbon fuels it is EB.
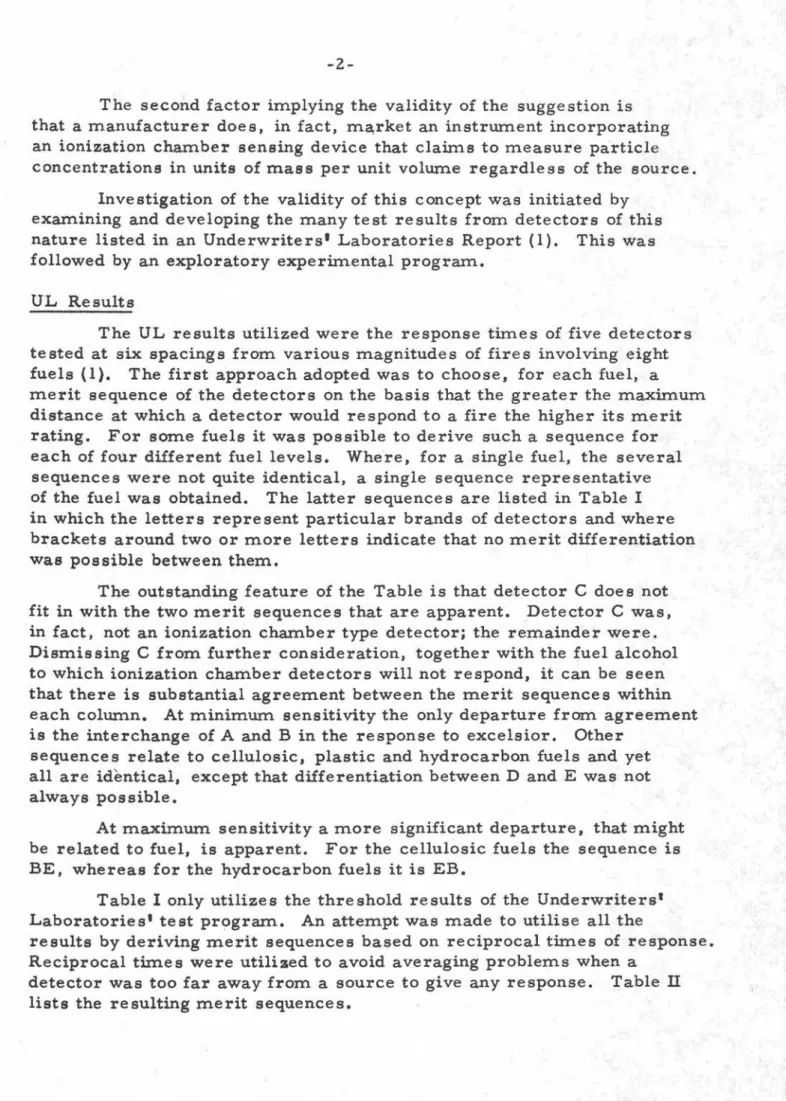
Table I only utilizes the threshold results of the Underwriters'
Laboratories' test program. An attempt was made to utilise all the
results by deriving merit sequences based on reciprocal times of response. Reciprocal tUnes were utilized to avoid averaging problems when a
detector was too far away from a source to give any response. Table II
-3-Again disregarding detector C', the sequences for the three hydrocarbon fuels are identical while detector D re sponds more
poorly to plastic packing. Within the group of cellulosic fuels there
are variations that had not shown up previously but it was thought that little significance should be placed on the sequence s given by Table II
in the context of ultimate sensitivity. Whereas Table 1 relates to
the limit of detection, Table 11 utilises every detector response, some of which were in quite short times.
This analysis thus proved inconclusive in determining whether the merit sequence of detectors, as far as ultimate limit of sensitivity
is concerned, is dependent on the nature of the fuel. An experimental
investigation was therefore initiated.
Expe rimental Inve stigation
Two manufacturers produce instruments intended to measure products of combustion quantitatively, using ionization chamber sensing units operating on the same principle as the corresponding
fire detectors. These instruments are, to all intents and purpose s,
appropriately powered fire detector heads instrumented to monitor their
response continuously. The geometry of the two sensing chambers
differs markedly, thus the two instruments were ideally suited to the investigation envisaged.
As a test chamber a sheet steel enclosure 5 ft 6 in. long by
18 in. square was constructed. The projected tests involved the
simul-taneous exposure of the two sensing heads to substantially identical
conditions and preliminary tests were carried out to ensure that conditions at two adjacent locations were in fact the same (at anyone time).
It was found that virtually uniform conditions throughout the
whole chamber (Figure I) could be established by using a small fan
located on the floor of the chamber, near the centre, directing air towards the source of the fire, also on the floor of the chamber 6 in.
from one end. It was decided to locate the test chambers at the end of
the chamber remote from the smoke source; at this location the
fan-induced air velocities did not exceed I ft/ sec. The sensitivities of
the sensing heads should not, therefore, have been markedly influenced by the mechanical air movement.
Some 50 tests were carried out to investigate the relationship
between response and the type of fuel utilized. In each case the small
fan just referred to was switched on for 3 minutes, when in general smoke generation had passed its peak, and was then disconnected.
. J
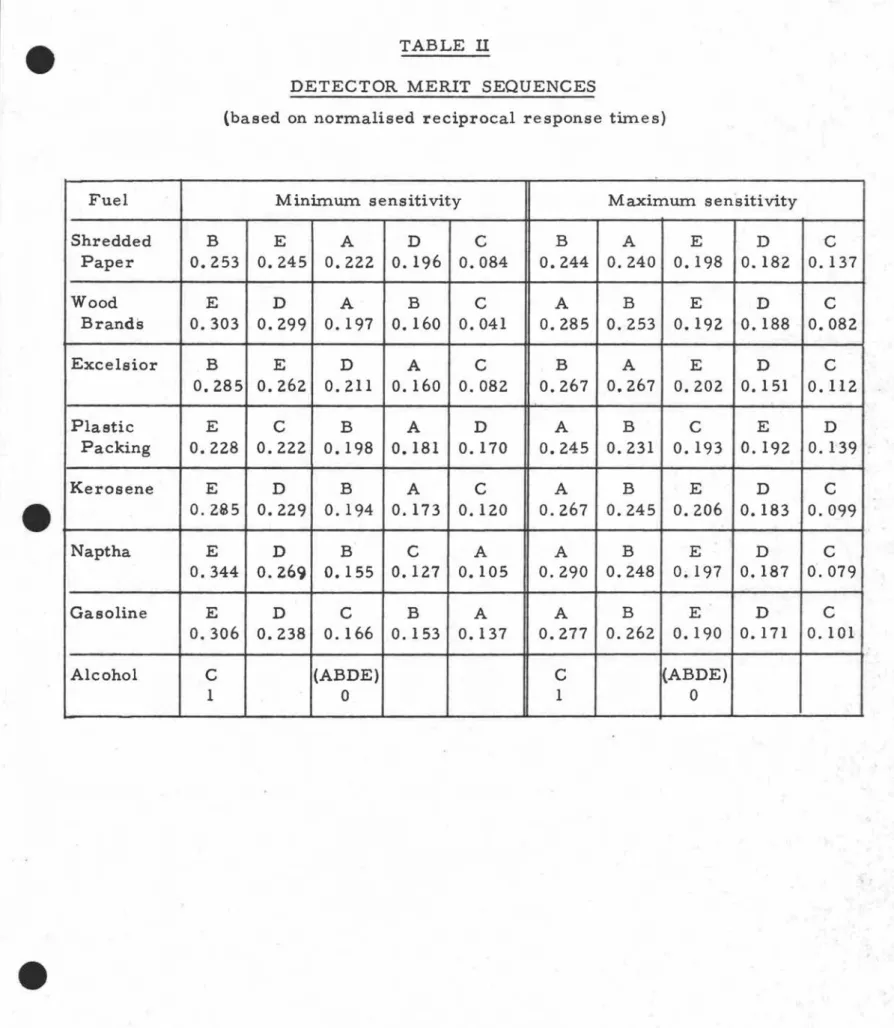
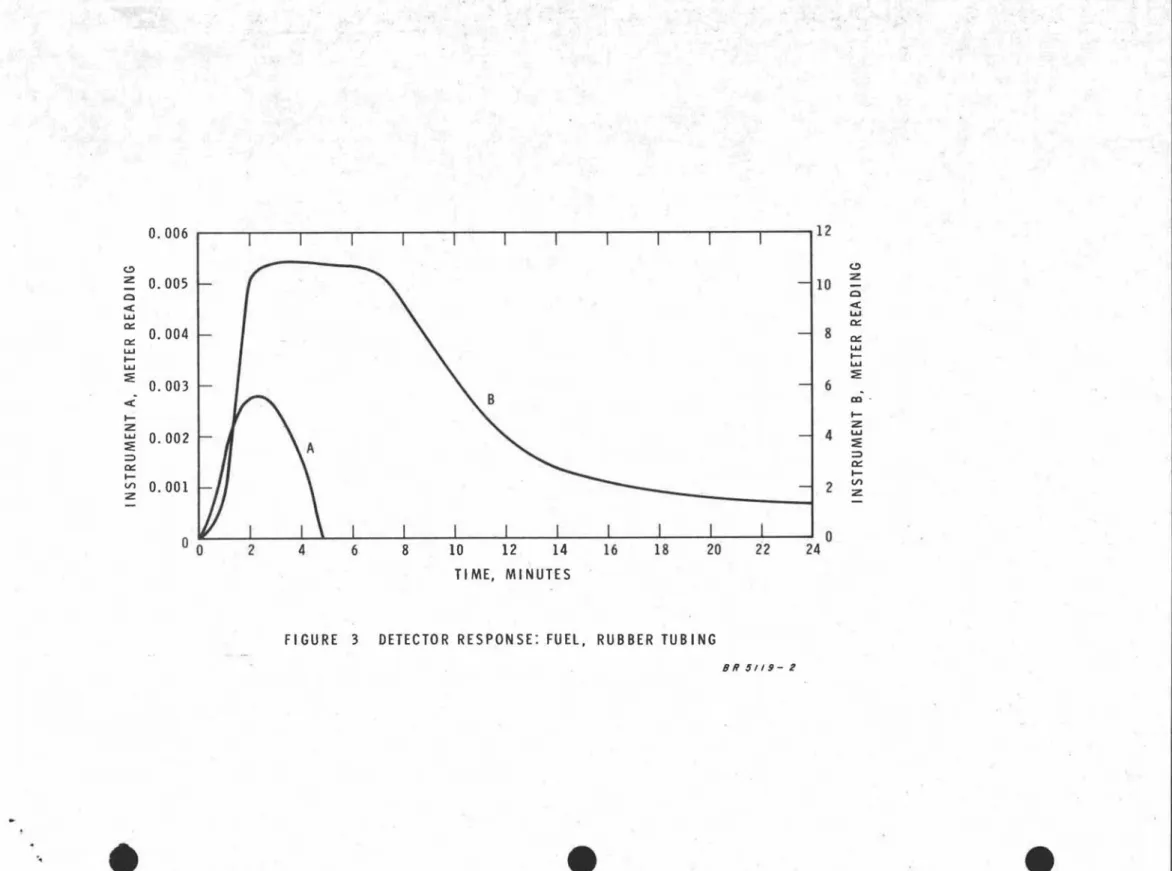
-4-Figures 2 and 3 show typical response curves using, respectively, a small piece of fibreboard (l/2 in. cubed) and a small portion of red
rubber tubing. The fibreboard was ignited, the flame extinguished,
and the sample left to smoulder in the chamber. In the case of the
rubber tubing, flaming prevailed until the specimen was destroyed, a period of little more than one minute.
It can be seen from Figures 2 and 3 that the ratios of the maximum responses of the two units differ and that the forms of the
response curves bear little relationship to each other. These
dis-crepancies cannot be attributed to scale non-linearities of the ionization
chamber instruments or to the operation of the fan. It can only be
concluded that the concept that the relative limiting sensitivities of different detectors is independent of fuel is not valid.
Discussion
The response of an ionization chamber detector certainly does result from ion recombination and the fallacy in the development of the concept concerning relative sensitivitie s is probably not as sociated with the simple theory cited on the subject of ion recombination
dependency. A more likely explanation is that the particulate matter
to which the chambers respond does not follow molecular behaviour
and hence may never become uniformly distributed. The concept of
inelastic collisions may be quite inappropriate in this context and the geometry of a chamber may be an important factor influencing response. Products of cornbustion might not readily reach secluded regions of a chamber.
Conclusion
The relative response of an ionization chamber to the products of combustion from different fuels is a function of the de sign of the chamber, contrary to the hypothe sis put forward at the beginning
of this Note. Until more is known of the nature of this dependency
it would seem necessary to test the sensitivity of detectors with a variety of fuels.
Acknowledgement
The author wishes to acknowledge the assistance of P. Huot
who performed the experimental work described in this Note.
Reference
(1) Dubivsky, P.M Report on Research Program. of Combustion Products
TABLE I
DETECTOR MERIT SEQUENCES
Detector Merit Sequences
Fuel MinimUIn sensitivity MaxirnUIn sensitivity
Shredded Paper D EAB C (A B D) E C
Wood Brands D E ABC (A D) B (E C)
Excelsior DE B A C (A D) B E C
Plastic Packing (D E) CAB
-
*
Alcohol C (A B D E) C (A BD E)
Kerosene (D E) A C B (A D E) B C
Naptha (D E) C AB (A D) E B C
Gasoline (D E) C AB ADEBC
."
TABLE II
DETECTOR MERIT SEQUENCES
(based on normalised reciprocal response times)
Fuel Minimum sensitivity Maximum sensitivity
Shredded B E A D C B A E D C Paper 0.253 0.245 0.222 0.196 0.084 0.244 0.240 0.198 0.182 0.137 Wood E D A B C A B E D C Brands 0.303 0.299 0.197 0.160 0.041 0.285 0.253 0.192 0.188 0.082 Excelsior B E D A C B A E D C 0.285 0.262 0.211 0.160 0.082 0.267 0.267 0.202 O. 151 O. H2 Plastic E C B A D A B C E D Packing 0.228 0.222 0.198 0.181 0.170 0.245 0.231 0.193 0.192 0.139 Kerosene E D B A C A B E D C 0.225 0.229 0.194 0.173 0.120 0.267 0.245 0.206 0.183 0.099 Naptha E D B C A A B E D C 0.344 0.Z69 0.155 0.127 0.105 0.290 0.248 O. 197 0.187 0.079 Gasoline E D C B A A B E D C 0.306 0.238 0.166 0.153 0.137 0.277 0.262 0.190 O. 171 0.101
Alcohol C (ABDE) C (ABDE)
29 27 25 23 21 RIGHT TOP LEFT TOP RIGHT BOTTOM LEFT BOTTOM
セセj[[
---
セセ
-
-
...
⦅MMMMMMMMMMMセ
15 17 19 TI ME. MINUTES 13 11 9 14 12 10r'
t::> :z -8 Cl <C....
c:: c:: 6....
I-....
::E 4 2 0 7 5FIGURE 1 UNIFORMITY OF CONCENTRATION WITHIN TEST CHAMBER
8Rf956
'.
12 t.:) 10 :z
-Q < ... 8 a::a:: ... I -... 6 :E. m I -4 :z... セ :=> a:: I -2 Vl :z -0 2 4 6 8 10 12 14 16 18 20 22 24 TIME. MINUTES 0.006 t.:) セ 0.005 Q < ... a:: 0.004 a:: ... I -... :E 0.003 . < I-セ
0.002 :E :=> a:: セ 0.001 :z -0 0FIG URE 2 0ETE CTOR RES PO NSE: FUEL. FIB REB 0 ARD
8 R 5 / / 9 - 1
..
0,006 12 C> C> z 0.005 10 z
-
-CI CI < < L.&.J L.&.J a:: a:: a:: 0.004 8 a:: L.&.J L.&.J....
....
L.&.J L.&.J :E 0.003 6 :E.
< a:l .....
....
z Z L.&.J 0.002 4 L.&.J :E :E ::> ::> a:: a::....
....
V! 0.001 2 VI z z -0 2 4 6 8 10 12 14 16 18 20 22 24 TIME, MINUTESFIGURE 3 DETECTOR RESPONSE: FUEl, RUBBER TUBING
B H 5 / 1 9 - 2
"