HAL Id: hal-02003839
https://hal.archives-ouvertes.fr/hal-02003839
Submitted on 14 Feb 2019HAL is a multi-disciplinary open access archive for the deposit and dissemination of sci-entific research documents, whether they are pub-lished or not. The documents may come from teaching and research institutions in France or abroad, or from public or private research centers.
L’archive ouverte pluridisciplinaire HAL, est destinée au dépôt et à la diffusion de documents scientifiques de niveau recherche, publiés ou non, émanant des établissements d’enseignement et de recherche français ou étrangers, des laboratoires publics ou privés.
Plasmonic quantum size effects in silver nanoparticles
are dominated by interfaces and local environments
Alfredo Campos, Nicolas Troc, Emmanuel Cottancin, Michel Pellarin,
Hans-Christian Weissker, Jean Lerme, Mathieu Kociak, Matthias Hillenkamp
To cite this version:
Alfredo Campos, Nicolas Troc, Emmanuel Cottancin, Michel Pellarin, Hans-Christian Weissker, et al.. Plasmonic quantum size effects in silver nanoparticles are dominated by interfaces and local environments. Nature Physics, Nature Publishing Group, 2019, 15, pp.275-280. �10.1038/s41567-018-0345-z�. �hal-02003839�
1
Plasmonic quantum size effects in silver nanoparticles are dominated
by interfaces and local environments
Alfredo Campos1, Nicolas Troc2, Emmanuel Cottancin2, Michel Pellarin2, Hans-Christian
Weissker3, Jean Lermé2, Mathieu Kociak1 & Matthias Hillenkamp*2,4
1 Laboratoire de Physique des Solides, UMR 8502 CNRS and Université Paris-Sud, Orsay, France 2 Univ. Lyon, Université Claude Bernard Lyon 1, CNRS, UMR5306, Institut Lumière Matière, F-69622
Villeurbanne, France
3 Aix Marseille University, CNRS, CINaM UMR 7325, 13288, Marseille, France
4 Instituto de Física Gleb Wataghin, Universidade Estadual de Campinas, R. Sergio B. de Holanda 777,
13083-859 Campinas-SP, Brazil
Abstract
The physical properties of metals change when their dimensions are reduced to the nano-scale and new phenomena like the Localized Surface-Plasmon Resonance (LSPR) appear. This collective electronic excitation can be tuned over a large spectral range by adapting the material, size and shape. The existing literature is as rich as controversial as e.g. size-dependent spectral shifts of the LSPR in small metal nanoparticles, induced by quantum effects, are reported to the red, to the blue or entirely absent. Here we report how complementary experiments on mass-selected small silver nanoparticles embedded in silica can yield inconsistent results on the same system: while optical absorption shows no size-effect in the range between only a few atoms and ~10 nm, a clear spectral shift is observed in single-particle electron spectroscopy. Our quantitative interpretation, based on a mixed classical/quantum model, resolves the apparent contradictions, not only within our experimental data, but also in the literature. Our comprehensive model describes how the local environment is the crucial parameter controlling the manifestation or absence of size effects.
Main
The in-depth understanding of the electronic structure and of the optical properties of metal nanoparticles is not only an extremely fruitful playground for the development of quantum theories for metal nanostructures and strongly correlated systems [1] but of fundamental importance for applications e.g. in catalysis [2], imaging [3] or biosensing [4]. Although investigated and discussed since several decades [5], the question of size dependent plasmonic resonances in NPs has regained new interest recently with the introduction of improved experimental techniques allowing for single particle experiments [6, 7, 8]. Here the inhomogeneous line broadening, omnipresent in older works, is circumvented and the plasmonic response can directly be correlated to the size and shape. One particularly powerful technique is Electron Energy Loss Spectroscopy in a Scanning Transmission Electron Microscope (STEM-EELS). STEM-EELS has encountered an impressive success [9, 10], as it allows mapping spatial and spectral variations of LSPR with a sub-10 nm spatial resolution [11, 12, 13]. In the case of relatively large (> 10 nm) NPs, strong experimental and theoretical evidence shows that STEM-EELS is an almost perfect nanoscale counterpart of optical extinction spectroscopies [14, 15].
Only recently has STEM-EELS pushed the accessible size range down to <10 nm, where quantum effects make the optical response much more complex, even for the simplest geometry of the sphere. These considerable advances have led to an experimental determination of a strong blue shift of the
2 LSPR with decreasing size for silver NPs fabricated by wet chemical methods and deposited onto a substrate [16, 17]. Here the so-called quantum plasmon resonances were interpreted using semiclassical models based on the hydrodynamic description of the electron density. This interpretation remains, however, highly controversial [18], as several fundamental aspects such as electronic spill-out or the influence of the substrate, are not taken into account and the obvious contradiction with literature results is not discussed [19, 20, 21, 22]. Furthermore, the equivalence between electronic and optical observables was only implicitly assumed in such small particles but never derived. In summary, the existing literature on size-dependent plasmonic properties of small metal particles shows large discrepancies and a strong need for clarification.
The first aim of this contribution is to define the open questions in the interpretation of the size-dependent plasmon resonance shift in small silver nanoparticles. Based on new, complementary experimental data we then discuss experimental considerations, propose a comprehensive interpretation, and give an adequate quantitative theoretical description.
Statement of the problem
In the recent work on the theoretical description of the plasmonic response of metal nanoclusters as measured by STEM-EELS [16, 17, 23, 24, 25], the electronic spill-out has been neglected, although it is known since a long time to be crucially important [26]. The hard boundary box models must always predict a systematic blue-shift of the LSPR, which is inconsistent with the red-shift reported for simple systems like alkali clusters [27, 22], and consequently cannot account for more complex systems like noble metals. Research in cluster physics since the 90s has described in particular the balance between the effects induced respectively by the electron spill-out (leading to a red shift) and the reduced screening of d-electrons near the surface (resulting in a blue-shift). This trade-off can in principle be implemented in different types of models: (1) addition of spill-out to a hydrodynamic model [28], (2) a purely top-down model [29], which profits from simplicity and lightness but suffers from simplistic
ad-hoc approximations, or (3) a more sophisticated model ensuring self-consistency of the electronic
description [26, 30, 31]. We will use a theoretical description of the third type in this article, extended to the proper description of the dielectric environment.
Furthermore, the interaction between the particles and their environment plays a crucial role, especially regarding the anisotropic geometry of particles supported on a surface. Gas phase investigations are conceptually the simplest but STEM-EELS with all its strength requires supporting or embedding the particles. While most of the recent STEM-EELS publications entirely neglected the support, first attempts to include substrate and matrix effects have been made [29, 32] but the approximations remain significant. In chemically stabilized nanoparticles not only is the electronic structure of the metal core strongly altered by the localized bonds but the radiolytic degradation of the ligand shell can lead to a significant shift of the plasmon resonance [33], making even a qualitative size dependence difficult to detect. Given the fact that optical absorption results have been soundly established for several decades, a unifying approach, where a unique system is investigated experimentally and theoretically by optical and electronic spectroscopy is clearly desirable.
Our approach to overcome the experimental challenges is (1) to use physically prepared, size-selected, pure silver particles, (2) to embed them in a homogeneous silica matrix and (3) to compare single-particle STEM-EELS measurements to ensemble averaged optical spectroscopy experiments of the same system. The comparability of the results from the two experimental methods is verified (cf. Supporting Information 2.2) and our findings are interpreted in the framework of a theoretical model taking into account all relevant classical and quantum effects of both the electronic density in the particle and its environment, as well as of the electric field excitation on a self-consistent level. The
3 only difference between the samples studied experimentally is their thickness of ~1 µm for optical and ~30 nm thickness for electronic spectroscopy.
Experiment
Optical spectroscopy
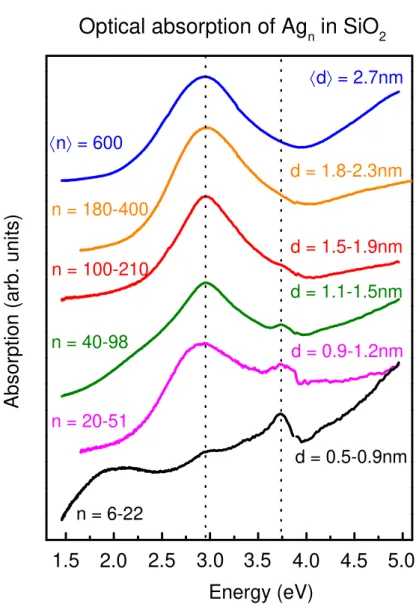
We have performed optical absorption spectroscopy on ensembles of silica-embedded, physically prepared silver NPs. In order to avoid a possible masking of size effects by the large-diameter tail of the size distribution we size-selected the NPs prior to deposition with a quadrupole mass spectrometer. We have extended the size range for Ag nanoparticles embedded in silica down to less than 1 nm diameter, deep into the regime where quantum size effects are expected [34, 35]. All but the smallest clusters display a strong absorption band centered at 2.95 eV, practically independent of size, as shown in figure 1. We have thoroughly verified that the observed absorption does not stem from larger particles generated by coalescence on the substrate (see SI). For clusters below 100 atoms, an additional peak at 3.75 eV is visible which we attribute to atoms from cluster fragmentation upon deposition. A comparable signal has been identified as the envelope of the atomic doublet 5sS1/2 –
5pP1/2 and 5sS1/2 – 5pP3/2 at 3.665 and 3.780 eV, respectively [36]. We furthermore notice the absence
of additional peaks between 3 and 4 eV, as previously observed for very small Ag clusters in rare gas matrices [35] and in photosensitive glasses in the very early stage of silver precipitation [37]. We assume these ultra-small clusters to react with the oxide environment and thus not to show an oscillator strength concentrated in a narrow spectral range.
By combining these results with earlier ones [20, 21] we can conclude that in the whole range between 1 and 5 nm diameter (corresponding to a range from ~20 to ~3600 atoms) no significant shift of the optical absorption peak for silica embedded silver nanoparticles occurs. This absence of size effects is consistent with earlier results on larger particles in different glassy matrices [37, 20, 38, 25] but in stark contrast with the observed shift of ≥ 0.3 eV for gas phase and supported NPs [19, 31, 39, 40, 16, 17, 18, 41].
4
d = 0.5-0.9nm
d = 0.9-1.2nm
d = 1.1-1.5nm
n = 100-210
n = 180-400
n = 600
5.0
4.5
4.0
3.5
3.0
2.5
2.0
d = 2.7nm
n = 6-22
n = 20-51
n = 40-98
d = 1.5-1.9nm
Optical absorption of Ag
nin SiO
2A
b
s
o
rp
ti
o
n
(
a
rb
.
u
n
it
s
)
Energy (eV)
d = 1.8-2.3nm
1.5
Figure 1 Optical spectroscopy. Optical absorption spectra for silver nanoparticles of varying size embedded in silica matrices. The topmost, blue curve is for a non-mass-selected ensemble centered on a diameter d = 2.7 nm, the other curves are for mass-selected distributions. The minimal and maximal number of atoms per particle transmitted through the mass spectrometer and the corresponding diameters are indicated. The broad signal around 2 eV for the smallest size is an artefact due to imperfect correction of Fabry-Perot interferences within the silica matrix. The atomic peak at 3.75 eV for small sizes is attributed to fragmentation upon deposition.
5
Electron spectroscopy
Single-particle STEM-EELS experiments were conducted over a large size range on thin samples fabricated under identical conditions as those for optical spectroscopy. Figure 2 shows typical example images of 6.5 and 2.0 nm Ag nanoparticles in silica and the corresponding EEL spectra. Clearly visible are the strong dipolar surface-plasmon peak at the particle surface as well as blue shifts between the spectra and with respect to optical spectroscopy.
Figure 2 Electron spectroscopy. STEM-HAADF image of a 6.5 nm (a) and of a 2.0 nm particle (b) embedded in silica at the top and the EEL spectra associated to the surface signal (blue region of interest) below.
A closer look at our data, however, reveals a more complex situation. The majority of NPs do not display a LSPR at the beginning of each experiment. They are surrounded by a diffuse layer (see Fig. 3) which can be attributed to silver oxide [42, 43]. Upon continuous electron irradiation, this diffuse layer disappears due to knock-on collisions. In these inelastic collisions, momentum is transferred from the swift electron to a single atom which can then, depending on the momentum transferred, be displaced from its initial position. As the atomic velocity resulting from momentum transfer is higher for light atoms, these are preferentially removed from the sample. Initially (at least partially) oxidized silver NPs do not display a LSPR [21, 42] and only after beam-induced reduction does the LSPR peak appear and rise with integral electron dose. Under continuing observation of individual particles, the LSPR peak also blue-shifts, as shown in figure 3. Even at lowest reasonable dose this electron beam damage of the sample is unavoidable. Note that this spectral shift is related to a different radiation damage than radiolysis, where chemical bonds are broken [33].
6 Figure 3 Electron beam induced interface reduction a) STEM-HAADF images of a 7.9 nm silver particle diameter embedded in silica at low and high electron dose. A diffuse layer related to silver oxide is visible at low and disappears at higher electron dose. The diameter of the particle remains the same. b) Surface plasmon evolution with the electron dose.
The obtained values for the dose-dependent peak position as a function of size are depicted in figure 4. The data for large diameters scatter around the classical value of 3 eV, but for smaller sizes shifted values of up to ~3.6 eV are observed. Our data are consistently red-shifted with respect to refs. [16, 17], which is explained by the homogeneous high-index environment. But the size-dependent evolutions of the spectral position of the LSPR seem to be contradictory between optical and electronic spectroscopy.
7 Figure 4 Electron-dose dependent LSPR shift. Evolution of the localized surface-plasmon peak position of silica-embedded Ag NPs as a function of exposition time, indicated in color code. The interaction with the high-energy electron beam shifts the plasmon to higher energies, the values for each particle being connected by a dotted line. At highest doses the size of some nanoparticles also decreases with exposition time. The central and right vertical lines depict the classical (size-independent) values for the Mie plasmon of free and silica-embedded Ag nanoparticles in the quasi-static limit and calculated using the values of [44]. The left-most vertical line has been obtained for the Mie plasmon of core@shell Ag@AgxO nanoparticles at 75% oxidation ratio (see SI).
8
Theoretical description
We resolve this apparent contradiction between optical and electronic spectroscopy and offer a comprehensive framework for the comparison with the existing literature data based on several theoretical descriptions, detailed in the Supporting Information. These comprise notably (1) mixed classical/quantum calculations for optical spectroscopy [45, 46] accounting for all relevant contributions to the size dependence of the LSPR in a self-consistent description, (2) the modelling of the electron energy loss for the case of a homogeneous spherical particle and (3) the proportionality between the spectral responses obtained by optical and EEL spectroscopy in spherically symmetric systems, thereby assuring the validity of the cross-comparison between the two experimental and the two theoretical approaches to our system. In particular, if is the EELS probability for an electron close to the surface of a sphere of radius a embedded in a medium of dielectric constant
and the optical absorption cross-section, then (cf. SI)
( )
32( )
2 1 a opt abs m EELSω
ω
σ
ε
ω
∝ Γ .This extends the pure classical result [9] to quantum limits, and legitimizes the discussion of both optical and spectroscopies on the same footage. In other words, the contradictions stated in the literature [18] are not due to the different experimental methods but must be attributed to other effects, notably different particle environments.
In the following we discuss results from the semi-quantal calculations of the optical properties. Briefly, we calculate the imaginary part of the dynamic polarizability of a silica-embedded Ag NP by describing the external excitation with all (classical) effects of interface polarization, and the electronic response of the metal particle through a quantum mechanical, non-local electronic susceptibility. The calculations are based on density-functional theory (DFT) for computing the ground-state and the time-dependent local-density-approximation formalism (TDLDA) for calculating the optical response. Our model includes phenomenologically (but self-consistently) the absorption/screening properties of the ionic core background (effects related to the bulk interband-transition contribution) and the polarization/screening properties of the surrounding transparent matrix. In particular, the model describes self-consistently the interplay between the optical excitations and induced fields in the various media.
The conduction electrons of the metal particle, corresponding to the bulk s-p band, responsible for the collective surface-plasmon excitation and underlying most of the (quantum) finite-size effects, are quantum mechanically treated, whereas the ionic background is phenomenologically described by a step-walled homogeneous spherical positively charged distribution (jellium). We furthermore describe the optical properties of the more localized d electrons through an additional homogeneous polarizable/absorbing dielectric medium characterized by a frequency-dependent complex dielectric function εib(ω) and extending up to Rc = R – d, where d is the skin thickness of ineffective ion polarizability [26, 34, 30].
Previous studies have shown that in experimental samples sometimes the NP-matrix interface is not perfectly homogeneous and that a local porosity has to be taken into account [30, 22]. We mimic this locally reduced effective dielectric constant by an additional layer of thickness dm and vacuum permittivity at the metal-matrix interface (see the SI for detailed comments). Although this local porosity correction is not needed to explain the data from optical spectroscopy presented here, we will use it for the interpretation of the dose-dependent spectral shift obtained in STEM-EELS. The geometry of concentric shells used in the calculations is depicted in figure 5.
9 Our self-consistent model accounts for all important contributions:
(1) the electronic spill-out, i.e. the extension of electron density beyond the particle radius in a non-infinite potential well;
(2) the surface layer of ineffective ion-core polarizability d;
(3) the surrounding dielectric matrix, including a possible local porosity and
(4) all the relevant finite-size quantum effects, in particular the non-locality of the electronic response.
Discussion
The maxima of the calculated optical absorption spectra for free and silica-embedded Ag NPs as a function of the inverse radius R are shown in Figure 5, together with experimental data. While contribution (1) results in a red shift of the LSPR with decreasing size, in agreement with experimental observations for simple metals like alkalis [22] (black squares), the second one can overcompensate the first, yielding e.g. an effective blue shift in gas phase Ag NPs [19] (red squares). The spectral position of the LSPR results thus from a delicate balance between two counteracting quantum size effects. Here we used a fixed value of d = 3.5 bohr (1.8 Å) [30]. The expected 1/R dependence is observed for both curves. Obviously for very small sizes the present jellium-type model is probably too simplistic for reliable quantitative predictions and the exact atomic structure needs to be into account. We nevertheless plot the obtained points to show the general evolution.
0,0 0,5 1,0 1,5 2,0 2,5 2,8 3,0 3,2 3,4 3,6 3,8 4,0 SiO2 εm(ω) εib(ω) R d dm 138 832 5000 vacuum d=0 silica d=3.5 d m=0 vacuum d=3.5 Ref. [20] Ref. [20] Ref. [21]
Ref. [19] this work
number of atoms 40 E n e rg y ( e V ) 1/R (1/nm)
Figure 5 Theoretical and experimental size dependencies. Size dependent shift of the LSPR energy of Ag nanoparticles in different environments. The solid squares are the calculated responses for particles in vacuum without (black) and with (red) the layer of reduced polarizability d (in bohr), compared to experimental values (open squares). The solid blue circles show the theoretical values for silica-embedded Ag particles with the same layer of reduced polarization and a perfect interface (dm = 0). Open circles depict experimental values. Dashed lines are guides to the eye. The insert at the right shows the concentric geometry used for the simulations.
10 Embedding the NPs in silica not only red-shifts the LSPR due to the increased surrounding refractive index but also changes the relative weight of the counteracting size-dependent shifts listed above. The obtained effective quenching of the size effect (solid blue circles) is in good agreement with our data. We thus have a theoretical description which correctly reproduces our optical experiments and we can now evaluate the influence of the electron-induced beam damage through the parameter dm describing the local porosity. Even though the samples for optical and electronic experiments are in principle identical, the difference in thickness changes the protection against oxidation and the responses to irradiation are not the same. We demonstrate that these effects, which could be considered minor, in fact dominate the spectral responses.
Thick silica layers efficiently protect the embedded nanoparticles against degradation and the optical response is stable over at least days. The optical experiments thus reflect averaged ensemble responses of metallic nanoparticles in intact silica matrices down to sizes below 1 nm diameter (~20 atoms).
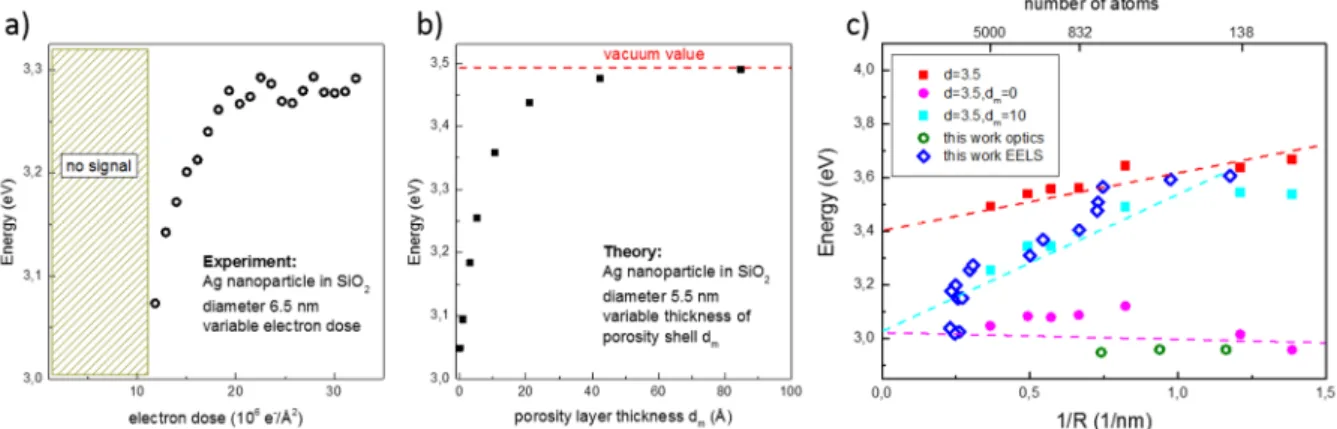
Figure 6 Plasmon peak shift. a: experimental shift of the LSPR as a function of electron dose for a 6.5 nm particle. After a minimal dose necessary for plasmonic activation, the peak blue-shifts by ~200 meV. The thickness of the initial oxide layer was ~1 nm. More example curves are given in the SI. b: simulated LSPR shift as a function of vacuum layer thickness
dm. A value of dm ≈ 5 Å results in a ~200 meV shift. c: Size dependence of the LSPR energy at high dose (like the saturated value in fig. 6a), as dark blue open diamonds. As comparison are shown the calculated values for free (red) and for silica-embedded particles with either a perfect interface (dm = 0 bohr, pink) or a porous interface layer (mimicked through a vacuum layer of dm = 10 bohr (5.3 Å), light blue). Also shown are some of the optical spectroscopy data as open green circles. Dashed lines are the same guides to the eye as in figure 5.
For the thin silica layers, as used in STEM-EELS, the short time of exposure to air between fabrication and experiment is sufficient to allow for diffusion of air or humidity into the silica network and (partial) nanoparticle oxidation [21]. Consequently, most of the particles do not display a clear plasmon resonance at the start of the EELS measurements. Under energetic electron irradiation, atoms are ejected out of their position by knock-on collisions. Here preferably light atoms are displaced, i.e. matrix and additional oxygen atoms at the particle interface. Rapidly the interface is cleaned of oxygen and the plasmon peak appears in the EELS spectrum. Throughout the ongoing observation, more and more matrix atoms are removed and the local porosity at the interface increases with time. As the effective index of the matrix εm decreases towards 1, the LSPR shifts to higher energies. The shift observed in the experiment is reproduced in our calculations, as shown in figures 6a and 6b. This effect
11 is stronger for smaller particles as their plasmon energy is more sensitive to the porosity, as demonstrated in our model calculations. Eventually, for higher electron doses, metal atoms can also be removed and the size of the nanoparticles decreases under the beam. Note that the largest particles investigated at small doses have LSPR energies lower than expected, a shift that can quantitatively be explained by partial oxidation (see Fig. 4 and SI).
Our theoretical model allows the quantitative and consistent interpretation of the plasmonic response of free and of embedded silver nanoparticles, even under conditions where the electron beam alters the nanoparticle environment (cf. Fig. 6c). All LSPR energies lie between the calculated limits of the free and the silica-embedded cases, and the high-dose values agree with pure Ag in the highly porous matrix. Based on this explanation, we can now also explain the size-dependent spectral shift observed in several experiments of supported silver nanoparticles [20, 40, 16, 17, 41]. Here the particles are not entirely surrounded by the high index matrix but only partially, their environment is intermediate between gas phase and embedding medium. Consequently, the influence of the reduced d electron screening prevails and the LSPR blue-shifts with decreasing size, although to a lesser extent than for free particles. For a quantitative comparison, several aspects have to be implemented in a theoretical description, notably the dielectric properties of the support, non-trivial because of the anisotropic distribution of electric fields. Additionally, we expect variations in local environment, possibly also electron-beam induced, to strongly contribute to the mean LSPR energies as well as to their dispersion.
In conclusion, we use a semi-quantal theoretical model to resolve apparent contradictions between optical and electronic spectroscopy results of silica-embedded silver nanoparticles, and with literature results in general. The energy of the surface-plasmon resonance, and thus the presence or absence of a size-dependent spectral shift, is determined by a delicate balance between competing quantum size effects. Our model quantitatively describes how this trade-off is dominated by interface effects between metal and matrix. We show that the interface is altered by the electrons in our STEM experiment and how this change of local environment induces a blue shift of the surface plasmon with respect to the values obtained in optical spectroscopy. Great care has to be taken in the interpretation of experimental STEM-EELS results in order to separate intrinsic from artificially induced size effects. We stress that small silver nanoparticles do show intrinsic size effects, but that these are often masked by environmental influences. Despite the unquestionable force of single-particle experiments we judge it indispensable to cross-check such experiments with complementary methods such as optical spectroscopy. Moreover, we emphasize the importance of implementing all relevant contributions in the theoretical description of quantum-plasmonic systems, as is demonstrated in this article.
Acknowledgments
We acknowledge financial support from the French National Research Agency (Agence Nationale de Recherche, ANR) in the frame of the project “FIT SPRINGS”, ANR-14-CE08-0009. This work has received support from the National Agency for Research under the program of future investment TEMPOSCHROMATEM with the Reference No. ANR-10-EQPX-50. This work was performed using the Lyon Cluster Research Platform PLYRA. M.H. acknowledges support from the Brazilian Science Without Borders "Special Visiting Scientist" program (88881.030488/2013-01), and from the São Paulo Research Foundation (FAPESP, 2013/14262-7 and 16/12807-4). We gratefully acknowledge technical support from O. Boisron, C. Albin and C. Clavier and fruitful discussions with D. Ugarte.
12
Author contributions
H.-C. W., M.K. and M.H. designed the project; N.T., E.C., M.P. and M.H. fabricated the samples and performed optical spectroscopy; A.C.O. and M.K. performed STEM-EELS experiments, treated the data and developed the corresponding theoretical description; J.L. developed the theoretical model of the optical response and its equivalence to EELS, performed the calculations and wrote the corresponding theoretical part in the Supplementary Information; M.H. coordinated the data interpretation and wrote the manuscript; all authors participated in the discussion.
Methods
Sample fabrication and optical spectroscopy
Bare silver nanoparticles were fabricated in the gas phase using two setups: a laser vaporization source (LVS) [47] for most of the STEM-EELS samples and a magnetron sputtering/gas aggregation source [48] for the optical spectroscopy samples and the samples for electron spectroscopy containing the smallest particles. In the LVS setup the second harmonic of a nanosecond Nd3+:YAG pulsed laser is
focused on the surface of a metallic target confined in a small chamber, generating atomic plasma in the presence of a continuous flow of helium gas. The atomic vapor is rapidly cooled down by collisions with the inert gas (static pressure of a few tens of mbar), inducing the nucleation and the growth of small metallic NPs. The particle/gas mixture expands into a high-vacuum chamber through a conical nozzle in the form of a supersonic beam toward a deposition chamber.
In the magnetron setup, silver cluster ions are generated in the gas phase using a home-built magnetron cluster source (based on the principle introduced by Haberland et al. [49]) and guided towards the deposition chamber. Time-of-flight mass spectrometry (TOF-MS) is used for in-situ characterization of the cluster ions in the gas phase and shows no trace of cluster oxidation or other complexes. Mass selection is achieved with a quadrupole mass spectrometer (QMS). The QMS is tuned to very low resolution in order to transmit sufficient cluster current for sample fabrication.
The kinetic energy of the clusters is adjusted below 0.5 eV/atom in order to ensure soft-landing conditions with minimal fragmentation [50]. The silica matrix is evaporated in a commercial electron beam evaporator and co-deposited simultaneously at room temperature onto an adequate substrate: ultrathin carbon films for STEM or fused silica for optical experiments. The nanoparticle concentration is controlled and adjusted so as to avoid inter-particle interactions with typical loadings of <1 vol.%. The absence of coalescence in the optical samples was verified with conventional TEM of grids prepared under identical conditions (cf. SI). Typical samples for STEM comprise a silica buffer of 5 nm followed by 10 nm of silica with embedded particles and a top protective layer of 10 nm. In order to obtain a sufficient optical density for conventional UV-vis absorption spectroscopy, silica films with embedded particles were typically between 1-2 µm thick. Optical extinction spectroscopy was performed at Brewster angle in a Perkin-Elmer Lambda 900 spectrophotometer with linearly polarized light (TM).
Electron microscopy and spectroscopy
EELS measurements were carried out using a NION USTEM 200 Scanning Transmission Electron Microscope (STEM) fitted with a cold field emission gun and a homemade EELS detection system. Throughout this study, we used a 60 kV acceleration voltage. Typically, the electron probe current was set between 40 to 100 pA and the electron probe diameter was of the order of 1 Å. Data were acquired in the so-called spectral image mode. In this mode, EEL spectra and High-Angle Annular Dark Field (HAADF) signals are acquired pixel by pixel. At the end of the spectral image acquisition we obtain a
13 spectrum image (spim) and a HAADF image. Dwell times per pixel were typically 1-3 ms and the number of pixels was set to 50 × 50. The spectral dispersion was 0.011 eV per channel and the spectrometer entrance aperture diameter was set to be slightly smaller than the transmitted beam angular spread (17 mrad half angle). The spectral resolution measured as the Zero Loss Peak (ZLP) full width at half maximum was 0.27 eV. In order to study the evolution of the plasmon signal and particle morphology with electron dose, stacks of spectrum images (and their associated HAADF images) were taken. Before and after a stack acquisition a high resolution HAADF image is taken in order to check, with a better spatial resolution, any change on the particle morphology or interface. As a post-processing treatment, all the spectrum images are spectrally aligned according to their ZLP maximum position using the open source software hyperspy 1.0 [51]. No deconvolution process was performed.
Theory and modelling
The theoretical description and modelling are described in great detail in the Supplementary Information. First the electron energy loss for the case of a homogeneous spherical particle is calculated in section 2.1. Next, in section 2.2, we show the proportionality between this electronic and an optical response beyond classical models for the polarizability for any spherically symmetric system. The self-consistent semi-quantal model is detailed and results relevant for our interpretations are discussed in section 2.3. Finally, we describe the classical calculations for Ag@AgxO core@shell
nanoparticles in section 2.4.
References
[1] Ekardt, W., editor. Metal clusters. Wiley Series in Theoretical Chemistry, (1999). [2] Heiz, U. and Landman, U. E., editors. Nanocatalysis. Springer, (2007).
[3] Odom, T. W. and Schatz, G. C. Chem. Rev. 111(6), 3667–3668 (2011).
[4] Anker, J. N., Hall, W. P., Lyandres, O., Shah, N. C., Zhao, J., and Van Duyne, R. P. Nat. Mater. 7, 442 (2008).
[5] Kreibig, U. and Vollmer, M. Optical properties of metal clusters. Springer series in materials science. Springer Berlin, (1995).
[6] Billaud, P., Marhaba, S., Grillet, N., Cottancin, E., Bonnet, C., Lermé, J., Vialle, J.-L., Broyer, M., and Pellarin, M. Rev. Sci. Instrum. 81, 043101 (2010).
[7] Celebrano, M., Kukura, P., Renn, A., and Sandoghdar, V. Nat. Photonics 5, 95 (2011).
[8] Ringe, E., Sharma, B., Henry, A.-I., Marks, L. D., and Van Duyne, R. P. Phys. Chem. Chem. Phys. 15, 4110–4129 (2013).
[9] Kociak, M. and Stéphan, O. Chem. Soc. Rev. 43, 3865–3883 (2014).
[10] Colliex, C., Kociak, M., and Stéphan, O. Ultramicroscopy 162(Supplement C), A1 – A24 (2016). [11] Rossouw, D., Couillard, M., Vickery, J., Kumacheva, E., and Botton, G. A. Nano Lett. 11(4), 1499– 1504 (2011).
[12] Ögüt, B., Talebi, N., Vogelgesang, R., Sigle, W., and van Aken, P. A. Nano Lett. 12(10), 5239– 5244 (2012).
14 [13] Bosman, M., Ye, E., Tan, S. F., Nijhuis, C. A., Yang, J. K. W., Marty, R., Mlayah, A., Arbouet, A., Girard, C., and Han, M.-Y. Sci. Rep. 3, 1312 (2013).
[14] Losquin, A., Zagonel, L. F., Myroshnychenko, V., Rodríguez-González, B., Tencé, M., Scarabelli, L., Förstner, J., Liz-Marzán, L. M., García de Abajo, F. J., Stéphan, O., and Kociak, M. Nano Lett. 15(2), 1229–1237 (2015).
[15] Hörl, A., Haberfehlner, G., Trügler, A., Schmidt, F.-P., Hohenester, U., and Kothleitner, G. Nat.
Commun. 8, 37 (2017).
[16] Scholl, J. A., Koh, A. L., and Dionne, J. A. Nature 483, 421 (2012).
[17] Raza, S., Stenger, N., Kadkhodazadeh, S., Fischer, S. V., Kostesha, N., Jauho, A.-P., Burrows, A., Wubs, M., and Mortensen, N. A. Nanophotonics 2, 131–138 (2013).
[18] Haberland, H. Nature 494, E1 (2013).
[19] Tiggesbäumker, J., Köller, L., Meiwes-Broer, K.-H., and Liebsch, A. Phys. Rev. A 48, R17492 (1993).
[20] Hilger, A., Cüppers, N., Tenfelde, M., and Kreibig, U. Eur. Phys. J. D 10, 115–118 (2000). [21] Hillenkamp, M., Di Domenicantonio, G., Eugster, O., and Félix, C. Nanotech. 18, 015702 (2007). [22] Cottancin, E., Broyer, M., Lermé, J., and Pellarin, M. Handbook of Nanophysics: Nanoelectronics
and Nanophotonics, chapter Optical Properties of Metal Clusters and Nanoparticles. CRC Press, Boca
Raton, FL, USA (2011).
[23] Mortensen, N. A., Raza, S., Wubs, M. Søndergaard, T., and Bozhevolnyi, S. I. Nat. Commun. 5, 3809 (2014).
[24] Christensen, T., Yan, W., Raza, S., Jauho, A.-P., Mortensen, N. A., and Wubs, M. ACS Nano 8(2), 1745–1758 (2014).
[25] Raza, S., Kadkhodazadeh, S., Christensen, T., Di Vece, M., Wubs, M., Mortensen, N. A., and Stenger, N. Nat. Commun. 6, 8788 (2015).
[26] Liebsch, A. Phys. Rev. B 48, 11317–11328 Oct (1993).
[27] Bréchignac, C., Cahuzac, P., Leygnier, J., and Sarfati, A. Phys. Rev. Lett. 70, 2036–2039 (1993). [28] Toscano, G., Straubel, J., Kwiatkowski, A., Rockstuhl, C., Evers, F., Xu, H., Asger Mortensen, N., and Wubs, M. Nat. Commun. 6, 7132 (2015).
[29] Monreal, R. C., Antosiewicz, T. J., and Apell, S. P. New J. Phys. 15(8), 083044 (2013).
[30] Lermé, J., Palpant, B., Prével, B., Pellarin, M., Treilleux, M., Vialle, J. L., Perez, A., and Broyer, M. Phys. Rev. Lett. 80(23), 5105 (1998).
[31] Kasperovich, V. and Kresin, V. V. Phil. Mag. 78, 385–396 (1998).
[32] Raza, S., Yan, W., Stenger, N., Wubs, M., and Mortensen, N. A. Opt. Express 21(22), 27344– 27355 (2013).
[33] Koh, A. L., Bao, K., Khan, I., Smith, W. E., Kothleitner, G., Nordlander, P., Maier, S. A., and McComb, D. W. ACS Nano 3, 3015–3022 (2009).
15 [34] Fedrigo, S., Harbich, W., and Buttet, J. Phys. Rev. B 47, 10706 (1993).
[35] Lecoultre, S., Rydlo, A., Buttet, J., Félix, C., Gilb, S., and Harbich, W. J. Chem. Phys. 134, 184504 (2011).
[36] Kreibig, U. Appl. Phys. 10(3), 255–264 (1976).
[37] Genzel, L., Martin, T. P., and Kreibig, U. Z. Phys. B 21, 339–46 (1975).
[38] Cottancin, E., Celep, G., Lermé, J., Pellarin, M., Huntzinger, J. R., Vialle, J. L., and Broyer, M.
Theor. Chem. Acc. 116, 514 (2006).
[39] Charlé, K.-P., König, L., Nepijko, S., Rabin, I., and Schulze, W. Cryst. Res. Technol. 33, 1085–1096 (1998).
[40] Nilius, N., Ernst, N., and Freund, H.-J. Phys. Rev. Lett. 84, 3994–3997 (2000).
[41] Lünskens, T., Heister, P., Thamer, M., Walenta, C. A., Kartouzian, A., and Heiz, U. Phys. Chem.
Chem. Phys. 17, 17541–17544 (2015).
[42] Sachan, R., Ramos, V., Malasi, A., Yadavali, S., Bartley, B., Garcia, H., Duscher, G., and Kalyanaraman, R. Adv. Mater. 25(14), 2045–2050 (2013).
[43] Römer, I., Wang, Z. W., Merrifield, R. C., Palmer, R. E., and Lead, J. Environ. Sci. Technol. 50(5), 2183–2190 (2016).
[44] Johnson, P. B. and Christy, R. W. Phys. Rev. B 6, 4370 (1972).
[45] Lermé, J., Palpant, B., Cottancin, E., Pellarin, M., Prével, B., Vialle, J. L., and Broyer, M. Phys.
Rev. B 60, 16151–16156 (1999).
[46] Lermé, J. Eur. Phys. J. D 10(2), 265–277 (2000).
[47] Pérez, A., Mélinon, P., Dupuis, V., Prével, B., Bardotti, L., Tuaillon-Combes, J., Masenelli, B., Treilleux, M., Pellarin, M., Lermé, J., Cottancin, E., Broyer, M., Jamet, M., Négrier, M., Tournus, F., and Gaudry, M. Mater. Trans. 42(8), 1460–1470 (2001).
[48] Hillenkamp, M., Di Domenicantonio, G., and Félix, C. Rev. Sci. Instrum. 77, 025104 (2006). [49] Haberland, H., Mall, M., Moseler, M., Qiang, Y., Reiners, T., and Thurner, Y. J. Vac. Sci. Technol.
A 12, 2925 (1994).
[50] Bromann, K., Félix, C., Brune, H., Harbich, W., Monot, R., Buttet, J., and Kern, K. Science 274, 956–958 (1996).