HAL Id: hal-01535613
https://hal.archives-ouvertes.fr/hal-01535613v2
Submitted on 21 Aug 2017
HAL is a multi-disciplinary open access
archive for the deposit and dissemination of
sci-entific research documents, whether they are
pub-lished or not. The documents may come from
teaching and research institutions in France or
abroad, or from public or private research centers.
L’archive ouverte pluridisciplinaire HAL, est
destinée au dépôt et à la diffusion de documents
scientifiques de niveau recherche, publiés ou non,
émanant des établissements d’enseignement et de
recherche français ou étrangers, des laboratoires
publics ou privés.
ASICS: an automatic method for identification and
quantification of metabolites in complex 1D 1H NMR
spectra
Patrick Tardivel, Cécile Canlet, Gaëlle Lefort, Marie Tremblay-Franco,
Laurent Debrauwer, Didier Concordet, Rémi Servien
To cite this version:
Patrick Tardivel, Cécile Canlet, Gaëlle Lefort, Marie Tremblay-Franco, Laurent Debrauwer, et al..
ASICS: an automatic method for identification and quantification of metabolites in complex 1D 1H
NMR spectra. Metabolomics, Springer Verlag, 2017, 13 (10), pp.Non Paginé.
�10.1007/s11306-017-1244-5�. �hal-01535613v2�
1
ASICS: an automatic method for identification and quantification of
metabolites in complex 1D
1H NMR spectra
Patrick J.C. Tardivel1,4, Cécile Canlet1,2, Gaëlle Lefort3, Marie Tremblay-Franco1,2, Laurent Debrauwer1,2, Didier
Concordet1, Rémi Servien1
1 Toxalim, Université de Toulouse, INRA, ENVT, INP-Purpan, UPS, F-31027 Toulouse, France.
2Axiom Platform, MetaToul-MetaboHUB, National Infrastructure for Metabolomics and Fluxomics, F-31027
Toulouse, France.
3 GenPhySE, Université de Toulouse, INRA, ENVT, Castanet Tolosan, France 4 Corresponding author: [email protected], +33561193995.
Abstract:
Introduction Experiments in metabolomics rely on the identification and quantification of metabolites in complex
biological mixtures. This remains one of the major challenges in NMR/mass spectrometry analysis of metabolic profiles. These features are mandatory to make metabolomics asserting a general approach to test a priori formulated hypotheses on the basis of exhaustive metabolome characterization rather than an exploratory tool dealing with unknown metabolic features.
Objectives In this article we propose a method, named ASICS, based on a strong statistical theory that handles
automatically the metabolites identification and quantification in proton NMR spectra.
Methods A statistical linear model is built to explain a complex spectrum using a library containing pure metabolite
spectra. This model can handle local or global chemical shift variations due to experimental conditions using a warping function. A statistical lasso-type estimator identifies and quantifies the metabolites in the complex spectrum. This estimator shows good statistical properties and handles peak overlapping issues.
Results The performances of the method were investigated on known mixtures (such as synthetic urine) and on
plasma datasets from duck and human. Results show noteworthy performances, outperforming current existing methods.
Conclusion ASICS is a completely automated procedure to identify and quantify metabolites in 1H NMR spectra
of biological mixtures. It will enable empowering NMR-based metabolomics by quickly and accurately helping experts to obtain metabolic profiles.
Keywords: Metabolomics – Nuclear magnetic resonance – Identification of metabolites – Quantification of metabolites – NIST Plasma.
Electronic supplementary material
The online version of this article contains supplementary material, which is available to authorized users.
1 Introduction
The development of new technologies has enabled the growth of the omics as a new science field. This refers to a field of biology focused basically on the study of the genome (genomics), the transcriptome (transcriptomics), the proteome (proteomics) or the metabolome (metabolomics) and their modulation by various stimuli. As a common trait, these different approaches produce very large datasets. Consequently, metabolomics experiments are conducted without any hypotheses on the discriminant metabolites to assess the differences between trial groups. Indeed, the whole characterization of the data would lead to intractable computational problems. Nevertheless, efficiency of metabolomics experiments relies on the identification and quantification of metabolites in complex biological mixtures (Blow 2008; Nicholson and Lindon 2008). One of the major challenges in NMR/mass spectrometry analysis of metabolic profiles remains the automatic metabolite identification from spectral data (Pontoizeau et al. 2010). Concerning proton NMR spectroscopy, each generated spectrum is usually first divided
2
into intervals called buckets (De Meyer et al. 2008; Alves et al. 2009). Then, the areas under the curve are computed for each bucket. These steps are repeated for each spectrum and multiple comparisons provide a list of buckets that are significantly different between the studied groups. Finally, NMR experts identify the metabolites involved in the significant buckets. By this approach, the identification of metabolites is restricted to significant ones. Another way to proceed would be to identify and quantify all the metabolites in each spectrum and to perform statistical analyses on these data. Today, this identification is mainly manually carried out by an expert, based on his knowledge and on direct comparisons with known metabolite spectra. This identification is tedious, time consuming and expert dependent (Tredwell et al. 2011). Furthermore, some problems, such as peak overlapping, warped spectra due to experimental variations or the high number of possible metabolites for a given chemical shift are very usual in complex mixtures and make identification very challenging. Recently, some automatic methods have been proposed for metabolite identification (see Ravanbakhsh et al. (2015) or Alonso et al. (2015) for a complete review) but none can be considered as an unanimous gold-standard. These methods could allow the use of metabolomics in a standard way using a priori formulated hypotheses on the metabolites by providing an automatic characterization of any complex 1D 1H NMR spectrum.
This article proposes a new method called ASICS (Automatic Statistical Identification in Complex Spectra). ASICS works relying on a library of pure metabolites spectra. The identification of metabolites is performed by comparing the spectrum of the mixture with spectra of the library. These comparisons are carried out using a statistical theory with established statistical properties (Tardivel et al. 2017). ASICS handles experimental problems such as the baseline correction or the variation of chemical shifts. This method is very fast, very competitive with the methods cited above and could help NMR experts in the analysis of complex mixtures. The R code is available as online resource and could be used with any Bruker NMR file of a complex mixture.
2 Materials and Methods
2-1 Sample preparation and NMR spectroscopy
A known mixture containing 5 metabolites in close concentrations and displaying close proton NMR signals was first prepared in replicate (n=5) to assess the performances of the method. Mean concentrations were 10.11 mM galactose, 4.86 mM GABA (-aminobutyric acid), 5.22 mM acetic acid, 20.10 mM lysine and 9.97 mM L-tryptophane. The samples were prepared in deuterated water phosphate buffer (pH 7.0).
Performances of ASICS were also assessed on the basis of a homemade synthetic urine sample (CDC 2010) prepared in ultrapure water (see Table S4 and Table S5 for details), duck plasma and a reference human plasma (NIST SRM1950). Details on the duck plasma analysis can be found in Theron et al. (2011) or in Bonnefont et al. (2014) and details on the plasma NIST SRM1950 are gathered as online resource 2.
For NMR analysis, 500 µl of this synthetic urine sample was mixed with 200 µl of phosphate buffer (pH 7.0) prepared in deuterated water and containing 1 mM TSP. The mixture was vortexed, centrifuged at 5000g for 10 min at 4°C and 600 µl of supernatant were transferred into a 5 mm NMR tube.
The 1D 1H NMR spectra of 175 reference compounds were collected to build the spectral library (Table S2 in
online resource 3). These compounds have been prepared at the concentration of 20 mM in phosphate buffer (0.2 M; pH 7.0) prepared in D2O/H2O in a 70:30 ratio (v/v).
All NMR spectra were recorded at 300 K using a Bruker Avance III HD spectrometer (1H frequency: 600.13 MHz,
Bruker, Germany) with a 5 mm CQPCI cryoprobe.
1H NMR spectra of synthetic urine sample and reference compounds were recorded using the Noesypr1d NMR
sequence for the suppression of water resonance, with a mixing time of 100 ms. A total of 128 transients were collected into 32k data points using a spectral width of 20 ppm, a relaxation delay of 2 s and an acquisition time of 1.36 s. Prior to Fourier Transformation, an exponential line broadening function of 0.3 Hz was applied to the FID.
All spectra were phase and baseline corrected using the Topspin v3.2 software (Bruker, Germany) and were calibrated to TSP signal ( 0 ppm). We apply BaselineCorrector (Wang et al. 2013) for automatically estimating the baselines of the different spectra
.
3
2-2 Modelling the spectrum of the complex mixture
A spectrum can be represented as a function over the range I of chemical shifts. All the spectra were normalized so that their area under the curve over I is 1.
To model the spectrum of the complex mixture 𝑔, possible slight variations of chemical shifts with the experimental conditions have to be taken into account. The warping function 𝜙: 𝐼 → 𝐼 allows to model the variation of chemical shift, where 𝜙 is an increasing function and 𝐼 is an interval of the chemical shifts associated to a spectrum. If 𝑓 denotes the spectrum of a metabolite of the library, 𝑓 ∘ 𝜙 models the warped spectrum of the same metabolite observed in a different experimental condition.
The spectrum of a complex mixture 𝑔 can be written as a combination of the warped spectra of the metabolites belonging to the library
𝑔 = ∑
1≤𝑖≤𝑝𝛼
𝑖𝑓
𝑖∘ 𝜙
𝑖+ 𝜀
,where p is the number of metabolites of the library, 𝛼𝑖 is a non-negative number depending on the proportion of the ith metabolite in the complex mixture and on its number of hydrogen atoms, 𝑓
𝑖 is the spectrum of the ith metabolite of the library and 𝜙𝑖 represents the corresponding warping function. Although the experimental conditions of the complex mixture spectrum 𝑔 are controlled, they are slightly different from those used to generate the spectra of the library. Finally, the term 𝜀 is a random error term. The structure of the noise 𝜀 is very important in the identification and quantification of metabolites in the mixture. Several observations of a spectrum obtained from the same metabolite allowed modeling the noise as
𝜀 = √ ∑
𝛼
𝑖𝑓
𝑖∘ 𝜙
𝑖 1≤𝑖≤𝑝𝜀1+ 𝜀2,
where 𝜀1 and 𝜀2 are standard independent white noises with known standard deviations 𝜎1 and 𝜎2. This equation models the signal taking into account both an additive noise 𝜀2 and a multiplicative one 𝜀1. The multiplicative noise is proportional to the intensity of the signal. The additive noise is the same whatever the signal and is always present even when the signal is equal to zero. These two noise parameters influence differently the performances of our method. The additive noise has a strong impact on the identification of the metabolites whereas the multiplicative one has a major impact on their quantification. It is very difficult to be more quantitative on the standard deviation of the additive noise on the detection performances because it depends strongly on some experimental conditions (operator, pH, equipment, baseline quality correction …). The multiplicative noise is commonly used in quantification methods. Usually values between 0.1 and 0.2 (which is quite common in metrology) are considered as acceptable to quantify. An estimation was carried out from our duplicated experiments and led to a value of 0.17.
In this model, 𝑔 is observed, the spectra 𝑓1, … , 𝑓𝑝 are known, the 𝛼𝑖's are unknown parameters, the 𝜙𝑖 are unknown warping functions, and the noise 𝜀 is unobserved.
2-3 Cleansing step
The first step of the method is to identify the metabolites of the library that cannot belong to the complex spectra. The chemical shift between two spectra of the same metabolites obviously depends on the experimental conditions (pH …). For a given metabolite, we assume that the maximum variation of the chemical shift is smaller than an upper bound M, which was fixed at 0.02 ppm. It is assumed that a metabolite belonging to a complex mixture must display its related signals in the complex spectra. Thus, a metabolite cannot belong to the complex mixture if at least one peak of its spectrum does not appear in the complex spectra. Consequently, a metabolite displaying a peak at a chemical shift 𝑑 cannot belong to a complex spectrum which does not present any peak in the interval [𝑑 − 𝑀, 𝑑 + 𝑀]. ASICS quickly detects these metabolites and reduces the number of metabolites of the library that need to be taken into account in the identification and quantification steps.
4
2-4 Identification of metabolites in a complex mixture
The 𝑖𝑡ℎ metabolite is considered as identified in the complex mixture when its coefficient 𝛼
𝑖 is greater than zero. The identification of the metabolites belonging to a complex mixture relies on the estimation of the active set 𝐴 defined as follows
𝐴 = {𝑖 ∈ {1, … , 𝑝} such that 𝛼𝑖≠ 0}.
If a sparse estimator (estimator whose some components are exactly zero) 𝛼̂ = (𝛼̂1, … , 𝛼̂𝑝) of (𝛼1, … , 𝛼𝑝) was available, the active set could be estimated as
𝐴(𝛼̂) = {𝑖 ∈ {1, … , 𝑝} such that 𝛼̂𝑖≠ 0}.
However, the warping functions 𝜙1, … , 𝜙𝑝 need to be known to obtain a sparse estimator of 𝛼1, … , 𝛼𝑝. To solve this problem, ASICS proceeds in two stages.
During the first stage, the warping functions are successively estimated using non sparse estimates of (𝛼1, … , 𝛼𝑝) . At the beginning of the kth step of this first stage, the estimates of the first k-1 warping functions 𝜙
1(1), … . , 𝜙𝑘−1(𝑘−1) and non-sparse estimates 𝛼1(𝑘−1), … , 𝛼𝑝(𝑘−1) of 𝛼1, … , 𝛼𝑝 are known. The superscript in 𝜙𝑖(𝑖) and 𝛼𝑖(𝑘−1) indicates the step at which the estimate was obtained.
The kth warping function is estimated by solving the following optimization problem
arg min
𝜙𝑘,𝛼𝑘‖𝑔 − 𝛼
𝑘𝑓
𝑘∘ 𝜙
𝑘− ∑ 𝛼
𝑖(𝑘−1)𝑓
𝑖∘ 𝜙
𝑖(𝑖) 1≤𝑖≤𝑘−1− ∑ 𝛼
𝑖(𝑘−1)𝑓
𝑖 𝑘+1≤𝑖≤𝑝‖
2.
The warping function 𝜙𝑘 is estimated so that the maximum variation of the chemical shift is smaller than M. This estimate is then used to update the non-sparse estimates of 𝛼1, … , 𝛼𝑝 as shown hereafter
(𝛼
1(𝑘), … , 𝛼
𝑝(𝑘)) = arg min
𝛼1,…,𝛼𝑝
‖𝑔 − ∑
1≤𝑖≤𝑘𝛼
𝑖𝑓
𝑖∘ 𝜙
𝑖(𝑖)− ∑
𝑘+1≤𝑖≤𝑝𝛼
𝑖𝑓
𝑖‖
2.
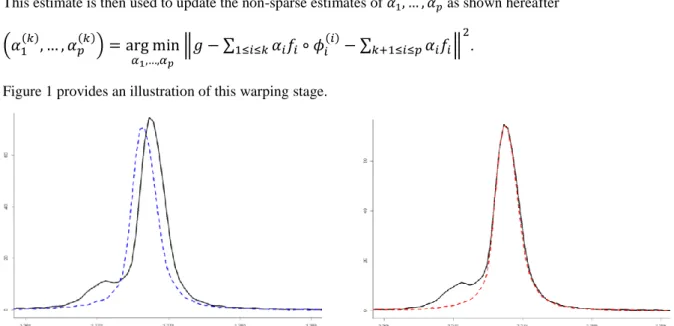
Figure 1 provides an illustration of this warping stage.
Figure 1. On the left in solid line, the main peak of the creatinine in the spectrum of the synthetic urine. In dotted line, the same peak observed on the spectrum of the creatinine before the warping stage. On the right in dotted line, the main peak of the creatine spectrum observed after the warping stage.
Note that, using this warping strategy, ASICS is able to take into account a chemical shift variation that is not only a unique translation on the whole spectrum. Local translations, dilations or tightenings would also been adjusted. However, this procedure is not able to create a new peak or to delete an existing one.
These estimated warping functions are used at the second stage to derive lasso-type sparse estimates of (𝛼1, … , 𝛼𝑝) (Tibshirani 1996, Bühlmann et al. 2011) by minimizing in 𝛼1, … , 𝛼𝑝 the following expression
5
‖𝑈 (𝑔 − ∑ 𝛼
𝑖 1≤𝑖≤𝑝𝑓
𝑖∘ 𝜙
𝑖(𝑖))‖
2+ 𝜆 ∑ |𝛼
𝑖|
1≤𝑖≤𝑝,
where 𝑈 is a linear transformation. This estimation gives a sparse estimation of the proportions 𝛼̂ and thus an estimation of the active set 𝐴(𝛼̂). When 𝜆 = 0, the so-called least squares estimator that is not sparse is obtained. Conversely, when the parameter 𝜆 is too large, all coefficients 𝛼1, … , 𝛼𝑝 become equal to zero. As a consequence the choice of 𝜆 plays an important role on the properties of the estimator 𝐴(𝛼̂). This choice, as well as that of the linear transformation 𝑈, is documented in Tardivel et al. (2017) to obtain an estimator of the active set showing good statistical properties. These properties guarantee a reliable identification of metabolites by controlling the two possible sources of errors: identify a metabolite that is not present in the complex mixture (false positive) or not identify a metabolite that is present (false negative). All these properties are based on an identifiability assumption: we assume that the library is identifiable up to a warping function i.e., in the library, there is no weighted sum of two (or more) spectra of pure metabolites (up to a warping function) that could result in a spectrum which could correspond to another metabolite. Assuming this assumption is met, all the properties of our lasso-type estimator applied and the signal overlap of the different metabolites can be handled by ASICS.
2-5 Quantification of the metabolites
Lasso-type estimators of the parameters 𝛼1, … , 𝛼𝑝 are known to be biased (Hastie et al. 2009). For this reason, the quantification of metabolites is performed with a least squares method limited to the metabolites identified (i.e with 𝛼̂𝑖 greater than zero) at the previous step . The quantification of the metabolites is obtained through the relative concentrations that could be easily computed form the coefficients 𝛼1, … , 𝛼𝑝 and the numbers of hydrogen atoms of the metabolites. The concentrations obtained are given relatively to the largest one. There is no maximum bound to the measured concentration and, according to the different experimentations, ASICS will be able to detect a relative concentration of approximately 1%. Regarding absolute concentrations, and taking into account our equipment and our experimental conditions for data acquisition, metabolites at concentrations lower than 1 µM will be not detected (signal/noise ratio too low) whereas metabolites at concentrations higher than 1 M will result in a broadening of NMR signals, increasing signal overlapping. Any additional reference compound with known concentration is sufficient to obtain the absolute quantities.
This whole procedure has been implemented on a R freeware code and all further results have been obtained using a classical personal computer and the R 3.2.2 version. All presented results could be computed using the code reported as online resource 1. The input parameters are the following: the complex mixture, the exclusion areas (by default [5.1;4.5] ppm to delete the water peak) and the maximum variation M allowed (by default 0.02 ppm). The output delivers the identified metabolites together with their estimated relative concentrations as well as both the estimated and real mixture spectra. The spectrum of the synthetic urine is gathered with an explanation on how to use the code. The interested user could also easily modify or replace our library by a personal / customized one. For a more user-friendly interface, ASICS is also implemented in Galaxy, a dedicated interface for metabolomic data treatment workflows (Guitton et al. 2017).
The accuracy measure reported on the following results has been defined in Ravanbaksh et al. (2015) by ratio of correct labels (true positives plus true negatives) to the library size.
3 Results and Discussion
3-1 Assessment on known mixtures
ASICS was firstly assessed on known mixtures. From the 5 metabolites mixture reported in table 1, ASICS always identified the 5 metabolites that are actually present. However, it provided some false positives (between 8 and 11 depending on the considered replicate) yielding an accuracy measure ranging from 96.6% to 98.2%. The quantification results of ASICS on the known mixtures are reported in Table 1.
Mean of the 5 estimated proportions Maximum of the 5 estimated proportions Minimum of the 5 estimated proportions Real proportion Lysine 1 1 1 1 Galactose 0.409 0.434 0.392 0.503
6
Tryptophane 0.446 0.462 0.430 0.496
Acetic Acid 0.156 0.125 0.180 0.259
GABA 0.248 0.278 0.237 0.242
Table 1. Results of ASICS on the known mixtures.
Due to the quantification of some non-present compounds, the mean estimated proportions were slightly below the real one. Indeed, the false positive compounds were all quantified below 3.3% with respect to the Lysine concentration. ASICS thus proved to be robust for the whole spectrum preparation and processing as the final results are not very sensitive to these bias.
3-2 Validation using comparisons with dosages
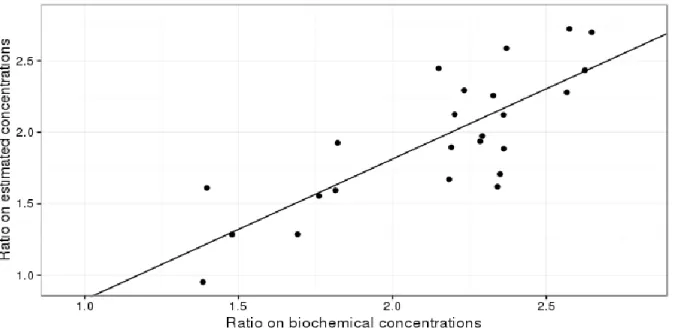
To validate ASICS quantifications, data available from previous works (Theron et al., 2011; Bonnefont et al., 2014) carried out on duck plasma were used. For two plasmatic metabolites, namely Glucose and Lactate, concentration ratios provided by ASICS were compared to those obtained by Theron et al. (2011) using a validated enzymatic method. Results presented in Figure 2 show that the two determination methods are well correlated with a correlation of 0.81.
Indeed, a linear regression applied on this dataset leads to the equation y=-0.15+0.98x. The intercept and the slope are not statistically different from their expected value (resp. 0 and 1). This good correlation validates the order of magnitude of the quantitative information obtained using ASICS.
Figure 2. Glucose and Lactate concentration ratios obtained by dosage (x-axis) and by using ASICS in the NMR spectrum (y-axis) on 24 ducks. The linear regression is plotted in straight line.
3-3 Comparison with other methods
ASICS was compared to other current methods available for the analysis of complex mixtures NMR spectra (i.e. MetaboHunter, Batman, Bayesil and Chenomx). Metabohunter (Tulpan et al. 2011) computes a score for each metabolite individually. This score gives the probability of presence of each metabolite in the mixture and is related to the number of signals found in the mixture spectrum for a given metabolite. This simple method is very quick but does not provide quantification. BATMAN (Astle et al. 2012; Hao et al. 2012, 2014) is based on a Bayesian model selection and combines the representation of peaks by Lorentzian curves with a MCMC algorithm. The estimation of proportions of each metabolite using this method provides good results. However, it is time-consuming and requires a careful description of each peak of a metabolite. This step can be very tedious especially with metabolites displaying a large number of peaks. To date, BAYESIL features (Ravanbakhsh et al. 2015) seem to outperform BATMAN ones. BAYESIL handles spectral matching as an inference problem within a probabilistic graphical model that rapidly approximates the most likely metabolic profile. Actually, the most used tool appears to be the Chenomx software (Weljie et al. 2006). Computations performed by this software are rather fast but it is
7
known to yield many false positive metabolites. Finally, it is a commercial tool that could be quite expensive. The comparisons were carried out using 2 different biofluids:
a) Synthetic urine containing salts to simulate a typical urine sample with known concentrations of metabolites;
b) Biological human plasma sample (NIST SRM1950 plasma): a reference plasma sample already annotated by NMR experts (Simón-Manso et al. 2014).
a) Synthetic Urine
For the synthetic urine sample, the 10 - 0.5 ppm spectral range was used, excluding the region between 6.5 and 4.5 ppm which include the very intense water and urea signals.
In order to accelerate spectra processing with BATMAN, its library was reduced to only 147 metabolites that were also present in our library (Table S3). The library of Bayesil does not contain Trimethylamine-N-Oxide and Trigonelline. All the methods have been ran using the default parameter settings as a new user would proceed. The results of identifications are presented in Table 2.
True Positive False Positive False Negative True Negative Accuracy (%) Compounds in library Computing Time ASICS 17 10 4 145 92 176 2 mn 38s MetaboHunter 4 51 17 795 92 867 < 1 mn Batman 21 125 0 1 18 147 74 hours Bayesil 12 17 7 53 73 89 10 mn 48s Chenomx 15 48 6 269 54 338 < 1 mn
Table 2. Comparison of the identification of the 5 methods on the synthetic urine.
ASICS was able to identify 17 metabolites out of the 21 actually present, with only 10 false detections, thus giving an accuracy of 92%. MetaboHunter analysis led to the same accuracy but with very different results: a very poor detection of true positive but a very high exclusion of true negative related to its very large library. BATMAN identified nearly all the metabolites in the mixture as already described by Ravanbakhsh et al. (2015) but yielded a very high number of false positives. Bayesil and Chenomx tools share a good accuracy but also a high number of false positives. As indicated in Table 2, in terms of computational time, ASICS lasts 4 times less than Bayesil for a twice as large library. Spectral processing with BATMAN was very long whereas Chenomx and MetaboHunter were the quickest.
Four metabolites (namely ascorbic acid, L-glutamine, malonic acid and formic acid) were not identified by ASICS. This can be due to different reasons. The missing of ascorbic acid is probably due to an experimental problem: its corresponding peaks are not present in the spectrum and this metabolite was identified neither by Bayesil nor by Chenomx. One can assume that the ascorbic acid has been degraded as it is known to be an easily oxidisable metabolite. The L-Glutamine was only identified by Bayesil with an unrealistic quantification. ASICS is missing this compound likely because its related signals are located in a range of the spectrum displaying many signals and thus, they may have been falsely attributed to other metabolites. For malonic acid, this can be attributed to acidic hydrogen-deuterium exchange occurring in deuterated water (D2O). Indeed, 1H NMR spectra of malonic acid and
urine sample have been obtained with different proportions of D2O, namely 70% for the pure compound, and 30%
for the urine sample. In the spectrum of malonic acid acquired in 70% D2O, a triplet is observed at 3.11 ppm
corresponding to the CHD signal, together with a singlet at 3.13 ppm corresponding to the CH2 signal (proportion
56/44 respectively). In the urine sample, the triplet signal is very weak compared to the singlet (proportion 14/86), due to the lower exchange rate, explaining why ASICS was unable to identify this metabolite. This underlines the fact that, for this kind of compound, a great attention has to be paid to this phenomenon and, that ideally, the library may include a spectrum for each potential matrix. Finally, ASICS did not identify formic acid whereas the other methods did. This highlights one of the limitations of our method: since it relies on a lasso-type estimator (and, by consequence, mean square thresholded estimator), it uses the area under the curve assigned to each metabolite, which is proportional to the concentration of the metabolite and to its number of hydrogen atoms. Therefore, a metabolite bearing a single non-exchangeable hydrogen atom, such as formic acid, displays a smaller area under the curve than another metabolite at the same concentration but with a higher number of hydrogen atoms. This may explain why formic acid was not identified by ASICS whereas other metabolites (e.g. L-Tyrosine with 7 hydrogen atoms) were identified due to their greater area under the curve.
8
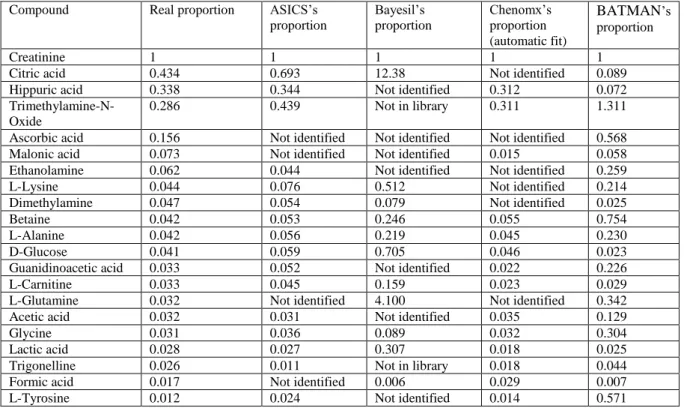
Performances of the various tested software were also compared in term of quantification. Results are summarized in Table 3.
Compound Real proportion ASICS’s
proportion Bayesil’s proportion Chenomx’s proportion (automatic fit) BATMAN’s proportion Creatinine 1 1 1 1 1
Citric acid 0.434 0.693 12.38 Not identified 0.089
Hippuric acid 0.338 0.344 Not identified 0.312 0.072
Trimethylamine-N-Oxide
0.286 0.439 Not in library 0.311 1.311
Ascorbic acid 0.156 Not identified Not identified Not identified 0.568
Malonic acid 0.073 Not identified Not identified 0.015 0.058
Ethanolamine 0.062 0.044 Not identified Not identified 0.259
L-Lysine 0.044 0.076 0.512 Not identified 0.214
Dimethylamine 0.047 0.054 0.079 Not identified 0.025
Betaine 0.042 0.053 0.246 0.055 0.754
L-Alanine 0.042 0.056 0.219 0.045 0.230
D-Glucose 0.041 0.059 0.705 0.046 0.023
Guanidinoacetic acid 0.033 0.052 Not identified 0.022 0.226
L-Carnitine 0.033 0.045 0.159 0.023 0.029
L-Glutamine 0.032 Not identified 4.100 Not identified 0.342
Acetic acid 0.032 0.031 Not identified 0.035 0.129
Glycine 0.031 0.036 0.089 0.032 0.304
Lactic acid 0.028 0.027 0.307 0.018 0.025
Trigonelline 0.026 0.011 Not in library 0.018 0.044
Formic acid 0.017 Not identified 0.006 0.029 0.007
L-Tyrosine 0.012 0.024 Not identified 0.014 0.571
Table 3. Comparison of the relative quantification of the 4 methods on the synthetic urine.
The quantifications provided by ASICS or by Chenomx both fit quite well the order of magnitude of the real proportion of the different metabolites. Conversely, some quantification results are very far from the real proportion for Bayesil (citric acid, L-glutamine …) and for BATMAN (citric acid, Trimethylamine-N-Oxide …). The same results were obtained using the synthetic urine without salts, highlighting the robustness of ASICS (data not shown). The Bruker file of the synthetic urine spectrum is included in online resource 1 and, thus, all the presented results can be easily recovered.
The above results suggest that ASICS represents the best trade-off between method accuracy (for both identification and quantification) and computational time. However, these results have to be analyzed with caution. First, depending on the experimental conditions, it is likely that a given method cannot be always better than others. Second, each method runs with its own specific library, which produces a bias in the comparison. Then, each method has been computed with default parameters and it is likely that, spending time to set these parameters, the performances of the different methods may be improved.
b) NIST Plasma
The NIST plasma sample is of particular interest since it represents a real biological sample and it has been extensively studied and characterized by several teams, making available several results on metabolites identification.
As the composition of the NIST plasma is still an open-question, it cannot be used to assess the superiority of any method. Nevertheless, it could be interesting to compare the different results to highlight the potential benefits of these automatic approaches. From the NIST plasma sample, 27 compounds were identified by an NMR expert at level 1 using the 1D 1H and 2D NMR spectra of plasma NIST sample and reference compounds. All the main
compounds identified by the experts were also identified by ASICS whereas it is not the case for the other methods. The quantification of these compounds by ASICS provides an accurate order of magnitude. BAYESIL identified 44 compounds (20 in common with the expert at level 1), Chenomx identified 78 compounds (17 in common with the expert at level 1) whereas Simón-Manso et al. (2013) identified 39 compounds in filtered plasma (21 in common with the expert at level 1). In addition to the 21 compounds common with Simón-Manso et al. (2013), ASICS allowed identifying L-Serine and GPC that were further confirmed by the NMR experts at level 1 using
9
compounds that were not identified at level 1 by the NMR expert. These compounds could be false positives (i.e. not present in the NIST plasma) or new detections. Some of these compounds (TMAO, L-Ornithine and Pantothenic acid) have been detected by ASICS and Chenomx but not by the expert at level 1, and so further work is required to assess the potential presence of these compounds. All these results show that these automatic approaches constitute a helpful tool for NMR experts, but have to be used with a careful control.
4 Conclusion
In this article we propose a method able to identify and quantify metabolites in a complex mixture of NMR 1D 1H
spectra. The warping strategy implemented in ASICS could deal with local modifications (including translations or more complex geometrical transformations) of the complex mixture spectra. ASICS proved to be helpful to save time for NMR experts, providing a useful method for the use of metabolomics in a standard way using a
priori hypotheses on metabolites. However, ASICS also obviously still has limitations. For example, the method
for correcting the baseline is likely to provide poor results in spectrum areas displaying a high number of peaks. Theoretically, identification and quantification methods require the library to contain all spectra of metabolites contained in the mixture. In practice, it is not possible to make such an assumption and a library containing the main metabolites spectra in terms of concentration yields satisfactory results for our method. Then, the estimation of warping functions could depend on the order in which they are estimated. In theory, it would be better to estimate all of them simultaneously, but this computation cannot be carried out within a reasonable time. The quantification step seems to be sensitive to the variability of the NMR spectrum and only provides an order of magnitude for the metabolites concentrations. Additionally, like all other automatic methods, metabolites with overlapping single resonances (for example formic acid, acetic acid and succinate) would potentially be difficult to identify and to quantify. The complex mixture spectrum also needs to be recorded at the same pH as the library spectra to reduce the potential variations of chemical shift. As pointed out using the synthetic urine sample, NMR spectra of metabolites that are very sensitive to proton exchanges with deuterated water (e.g. malonic acid), also need careful attention. Recording the spectra in the same conditions for both standard compounds and complex mixture would help overcoming potential differences between the two spectra.
Nevertheless, the study of examples of known compositions and comparisons with other methods show that this method provides better results than other existing methods. ASICS was also tested on two real matrices, providing good results on duck plasma and on the NIST plasma sample. Furthermore, ASICS is completely automated, freely available and the library of metabolites may easily be upgraded or replaced by an interested researcher. Finally, we hope that ASICS will enable the wealth of new applications of NMR by quickly and accurately help NMR experts for the study of metabolic profiles.
Acknowledgments
This work is part of the project GMO90+ (grant CHORUS 2101240982) from the French Ministry of Ecology, Sustainable Development and Energy within the national research program RiskOGM. Patrick Tardivel is partially supported by a PhD fellowship from GMO90+. The IDEX of Toulouse “Transversalité 2014" is thanked for its support to this project. The authors also thank the French National Infrastructure of Metabolomics and Fluxomics (MetaboHUB-ANR-11-INBS-0010) for their support. The authors thank Alyssa Bouville and Roselyne Gautier for help in the sample preparation and NMR analyses.
Compliance with ethical standards
Conflict of interest
The authors declare no conflict of interest regarding this work.
Ethical approval
10
References
Alonso, A., Marsal, S., & Julià, A. (2015). Analytical Methods in Untargeted Metabolomics: State of the Art in 2015, Frontiers in Bioengineering and Biotechnology, 3, 23.
Alves, A., Rantalainen, M., Holmes, E., Nicholson, J.K., & Ebbels, T.M.D. (2009). Analytic properties of statistical total correlation spectroscopy based information recovery in 1H NMR metabolic data sets. Analytical
Chemistry, 81, 2075-2084.
Astle, W., De Iorio, M., Richardson, S., Stephens, D., & Ebbels, T.M.D. (2012). A bayesian model of NMR spectra for the deconvolution and quantification of metabolites in complex biological mixtures. Journal of the American
Statistical Association, 107(500), 1259-1271.
Blow, N. (2008). Metabolomics: Biochemistry’s new look. Nature, 455(7213), 697–700.
Bonnefont, C.M., Guerra, A., Théron, L., Molette, C., Canlet, C., & Fernandez, X. (2014). Metabolomic study of fatty livers in ducks: Identification by 1H-NMR of metabolic markers associated with technological quality.
Poultry Science, 93(6), 1542-52.
Bühlmann, P., & van de Geer, S. (2011). Statistics for High-Dimensional Data: Methods, Theory and Applications.
Springer.
CDC (Center for Disease Control and Prevention). (2010). Bisphenol A and other environmental phenols and
Parabens in urine. Resource document.
https://www.cdc.gov/nchs/data/nhanes/nhanes_07_08/eph_e_met_phenols_parabens.pdf
De Meyer, T., Sinnaeve, D., Van Gasse, B., Tsiporkova, E., Rietzschel, E.R., De Buyzere, M.L., Gillebert, T.C., Bekaert, S., Martins, J.C., & Van Criekinge, W. (2008). NMR-based characterization of metabolic alterations in hypertension using an adaptive, intelligent binning algorithm. Analytical Chemistry, 80, 3783-3790.
Guitton, Y., Tremblay-Franco, M., Le Corguillé, G., Martin, J.-F., Pétéra, M., Roger-Mele, P., Delabrière, A., Goulitquer, S., Monsoor, M., Duperier, C., Canlet, C., Servien, R., Tardivel, P., Caron, C., Giacomoni, F., & Thévenot E.A. (2017). Create, run, share, publish, and reference your LC-MS, GC-MS, and NMR data analysis workflows with Workflow4Metabolomics 3.0, the Galaxy online e-infrastructure for metabolomics. Accepted in
International Journal of Biochemistry and Cell Biology.https://doi.org/10.1016/j.biocel.2017.07.002
Hao, J., Astle, W., De Iorio, M., & Ebbels, T.M.D. (2012). BATMAN—an R package for the automated quantification of metabolites from nuclear magnetic resonance spectra using a Bayesian model. Bioinformatics, 28(15), 2088-2090.
Hao, J., Liebeke, M., Astle, W., De Iorio, M., Bundy, J.G., & Ebbels, T.M.D. (2014). Bayesian deconvolution and quantification of metabolites in complex 1D NMR spectra using BATMAN. Nature Protocols, 9, 1416–1427. Hastie, T., Tibshirani, R., & Friedman, J. (2009). The Elements of Statistical Learning: Data Mining, Inference, and Prediction, Second Edition. Springer Series in Statistics.
Nicholson, J.K., & Lindon, J.C. (2008). Systems biology: Metabonomics, Nature, 455(7216), 1054-1056. Pontoizeau, C., Herrmann, T., Toulhoat, P., Elena-Herrmann, B., & Emsley, L. (2010). Targeted projection NMR spectroscopy for unambiguous metabolic profiling of complex mixtures. Magnetic Resonance in Chemistry, 48(9), 727-733.
Ravanbakhsh, S., Liu, P., Bjordahl, T.C., Mandal, R., Grant, J.R., Wilson, M., Eisner, R., Sinelnikov, I., Hu, X., Luchinat, C., Greiner, R., & Wishart, D.S. (2015). Accurate, Fully-Automated NMR Spectral Profiling for Metabolomics. PLoS ONE 10(5): e0124219.
11
Simón-Manso, Y., Lowenthal, M.S., Kilpatrick, L.E., Sampson, M.L., Telu, K.H., Rudnick, P.A., Mallard, W.G., Bearden, D.W., Schock, T.B., Tchekhovskoi, D.V., Blonder, N., Yan, X., Liang, Y., Zheng, Y., Wallace, W.E., Neta, P., Phinney, K.W., Remaley, A.T., & Stein, S.E. (2013). Metabolite Profiling of a NIST Standard Reference Material for Human Plasma (SRM 1950): GC-MS, LC-MS, NMR, and Clinical Laboratory Analyses, Libraries, and Web-Based Resources. Analytical Chemistry, 85(24), 11725-11731.
Tardivel, P.J., Servien, R., & Concordet, D. (2017). A powerful mutiple testing procedure in linear Gaussian model. Submitted. https://hal.archives-ouvertes.fr/hal-01322077
Theron, L., Fernandez, X., Marty-Gasset, N., Pichereaux, C., Rossignol, M., Chambon, C., Viala, D., Astruc, T., & Molette, C. (2011). Identification by Proteomic Analysis of Early Post-mortem Markers Involved in the Variability in Fat Loss during Cooking of Mule Duck “Foie Gras”. (2011) Journal of Agricultural and Food
Chemistry, 59, 12617–12628.
Tibshirani, R. (1996). Regression shrinkage and selection via the lasso. Journal of the Royal Statistical Society.
Series B (Methodological), 58(1), 267-288.
Tredwell, G.D., Behrends, V., Geier, F.M., Liebeke, M., & Bundy, J.G. (2011) Between-person comparison of metabolite fitting for NMR-based quantitative metabolomics. Analytical Chemistry, 83(22), 8683–8687.
Tulpan, D., Léger, S., Belliveau, L., Culf, A., & Čuperlović-Culf, M. (2011). MetaboHunter: an automatic approach for identification of metabolites from 1 H-NMR spectra of complex mixtures. BMC bioinformatics, 12(1), 1.
Wang, K.C., Wang, S.Y., Kuo, C.H., & Tseng Y.J. (2013). Distribution-based classification method for baseline correction of metabolomic 1D proton nuclear magnetic resonance spectra. Analytical Chemistry, 85(2), 1231-1239. Weljie, A. M., Newton, J., Mercier, P., Carlson, E., & Slupsky, C. M. (2006). Targeted Profiling: Quantitative Analysis of 1H NMR Metabolomics Data. Analytical Chemistry, 78(13), 4430-4442.