HAL Id: hal-00397967
https://hal.archives-ouvertes.fr/hal-00397967
Submitted on 23 Jun 2009HAL is a multi-disciplinary open access L’archive ouverte pluridisciplinaire HAL, est
Sewer asset management: from visual inspection survey
to dysfunction indicators
Mazen Ibrahim, Frédéric Cherqui, Pascal Le Gauffre, Caty Werey
To cite this version:
Mazen Ibrahim, Frédéric Cherqui, Pascal Le Gauffre, Caty Werey. Sewer asset management: from visual inspection survey to dysfunction indicators. leading edge conference on strategic asset manage-ment 2007, Oct 2007, France. pp.Proceedings on CD-Rom. �hal-00397967�
Sewer asset management: from visual inspection survey to
dysfunction indicators
M. Ibrahim* , F. Cherqui* , P. Le Gauffre* & C. Werey** *LGCIE, INSA-Lyon, 20 av. Einstein, 69621 Villeurbanne Cedex, France ; Université de Lyon, Lyon, F-69003, France ; Université Lyon 1, Lyon, F-F-69003, France
**
UMR Cemagref-ENGEES GSP, 1 quai Koch, BP 61039, 67070 Strasbourg Cedex, France. [email protected]
Keywords dysfunction; grade; indicator; misclassification cost; threshold; visual inspection, sewers. Abstract Asset management is an increasing concern for wastewater utilities and companies. Criteria are
developed for supporting the definition of investigation and rehabilitation programs. Dysfunction indicators contribute to the calculation of criteria, using expert rules. These indicators are mostly based on visual inspections, which provide major information. However, difficulties remain in the translation of visual inspection survey into dysfunction indicators. This article presents a methodological approach aiming to fill this lack. In the framework of the French RERAU program (Rehabilitation of urban sewer networks) a methodological approach has been developed in order to convert visual inspections of sewer segments into four possible condition grades {1, 2, 3, 4}, grade 4 corresponds to the worse condition. Three complementary procedures are thus executed: (a) expert rules based on sequences of observation codes, (b) comparison of single score to threshold and (c) rules based on analysis of segment profiles (scores distribution). An experiment lead in the Bas-Rhin (France) illustrates the different steps of the methodological approach and the applicability of the RERAU methodology on CCTV data. Moreover, confrontation between expert assessment of sewer segments (condition grade) and calculated scores has demonstrated the necessity of considering diagnosis imperfection, which may lead to misclassification in some cases. The algorithm proposed in this article aims to minimize a cost function with costs assigned to false positive diagnosis test (segment classified in worse condition than experts’ opinion) and false negative diagnosis test (segment classified in better condition than experts’ opinion). The algorithm is described in detail and applied to an example. Thus imprecision of assessment is taken into account: the threshold is chosen as to be the most efficient (in term of cost). This approach is generally applicable to numerous domains, when levels of performance need to be defined.
Introduction
Asset management is an increasing concern for wastewater utilities and companies, which aims to maintain infrastructure in a condition that is compatible with economic, environmental and sanitary stakes. Asset management includes data acquisition, performance assessment, and rehabilitation of element or sub-systems assessed as deficient or insecure. Asset valuation must include definition of performance indicators, such as the ones which have been defined in the framework of the French R&D RERAU1 program (Le Gauffre et al., 2004). These performance indicators use information obtained from
complementary sources: visual inspections of sewer segments, network monitoring, data issued from
network and treatment plant operation, data related to environment vulnerability, etc. Visual inspection and more especially closed circuit television inspection (CCTV), is nowadays a major method to assess condition of sewer networks and is widely used (Knolmar and Szabo, 2003). However, difficulty remains in the translation of visual inspection survey into a level of dysfunction, which is then used to determine if an action is necessary. This article presents a methodological approach aiming to fill this lack, in order to convert visual inspections of sewer segments into four possible condition grades {1, 2, 3, 4}, grade 4 corresponds to the worse condition.
The different steps of the methodology are detailed in the first section. The second section presents an experiment lead in the department of Bas-Rhin (France). After discussions related to results of the experiment, the case study illustrates different steps of the methodological approach. Confrontation between methodological approach and expert’s assessment leads to section 3 in which we propose a procedure in order to control misclassification errors.
Focusing on CCTV inspections
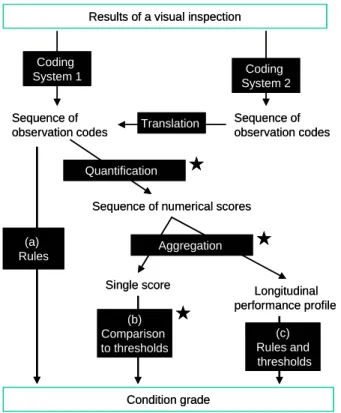
Question can be expressed in the following manner: how translating the observations obtained on a sewer segment into a level of dysfunction? This question can be divided into several steps presented in figure 1.1.
Results of a visual inspection
Sequence of observation codes
Sequence of numerical scores
Single score Condition grade Longitudinal performance profile (b) Comparison to thresholds Aggregation (a) Rules (c) Rules and thresholds Sequence of observation codes Coding System 2 Coding System 1 Quantification Translation
Figure 1.1 Translation of visual inspection survey into condition grade.
At first, the observations are converted into sequences of observation codes; coding system can be specific to a utility or standardization (for example the European standard EN 13508-2). A conversion system may allow linking two different coding systems. Then, the observation codes can be quantified in
order to obtain a distribution of scores on each sewer segment. The score of a section considers all defects, their gravity and their extent. Moreover, this single score is calculated for the sewer segment: it can be obtain from more or less complicated aggregation. Yet, this single score corresponds to the global density of defects. Three complementary procedures are then executed to obtain a condition grade related to the sewer segment: (a) expert rules based on sequences of observation codes, (b) comparing the single score with thresholds (cutoff values) and (c) rules based on the analysis of segment profiles (scores distribution).
European coding system
Concerning the coding system used, a major evolution is the recent application of the European standard EN 13508-2 (CEN, 2003). This standard guarantees the comparability of results and allows mutual capitalization of data. Each observation is described with a three letter code and with complementary information. For example, BAB-C-A is an open longitudinal crack, BAJ-A is a longitudinal displacement of adjacent pipes from their intended position, BBA-… means roots of trees or other plants growing into the pipeline through joints, defects or connections.
From visual inspection coding to condition grades
Given a CCTV report, each dysfunction is qualified using the procedure proposed on figure 1.1. The RERAU methodological guide (Le Gauffre et al., 2004; 2007) defines 12 types of dysfunction: degradation from abrasion, blockage, risk of collapse, degradation due to corrosion, excessive spillage, exfiltration (seepage loss), flooding, decrease in hydraulic capacity, infiltration, degradation due to roots intrusion, sand silting, destabilization of the ground-pipe system. Expert rules (procedure a in figure 1.1) depend on the studied dysfunction: they are veto forcing, grading in condition 4 (major dysfunction) on particular situation, for example when a specific combination of disorders may lead to a major dysfunction.
For each dysfunction, the quantification of a code i into an elementary score Ni takes into account the
gravity of the observation (through weight attribution) and the extend of observations (disorder length
Li). A defined extend P is attributed to pinpoints defects. The weight of each defect depends on a single
parameter α and four levels of gravity: 1, α, α², α3. Thus, each sewer segment is characterized with a set
of scores Ni based on equation 1:
)
(
in
i
P
or
L
N
=
α
×
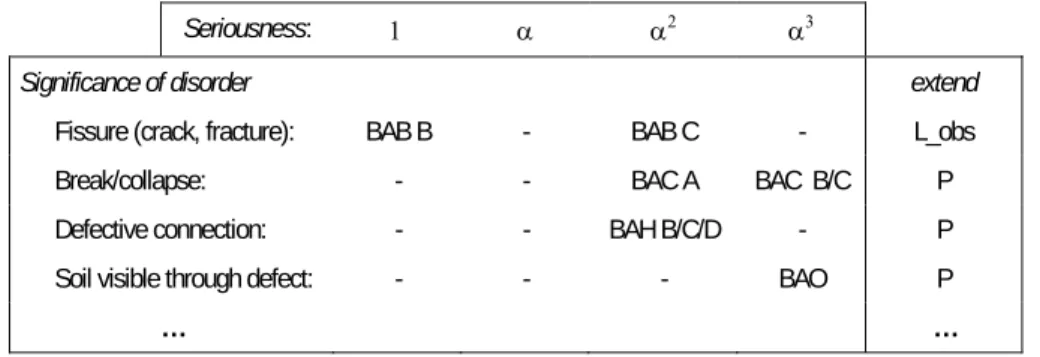
, with n = 0, 1, 2, or 3 and α = 2, 3, or 4 [1] Table 1.1 presents an extract from the evaluation table of indicator INF4 (infiltration assessed from CCTV inspection).Table 1.1 Extract from the evaluation table of dysfunction indicator INF4 (risk of infiltration: watertightness
deficiency assessed from CCTV results).
Seriousness: 1 α α2 α3
Significance of disorder extend
Fissure (crack, fracture): BAB B - BAB C - L_obs
Break/collapse: - - BAC A BAC B/C P
Defective connection: - - BAH B/C/D - P
Soil visible through defect: - - - BAO P
… …
The set of scores is then aggregated into a single score (procedure b in figure 1.1). Taking into account the length of each sewer segment (from 10 metres to more than 70 metres), the most appropriate single score seems to be the global density of defects D, as show in equation 2. We discuss this hypothesis in the next section.
∑
= N LT
D i with LT: total length of the sewer segment [m] [2] The global density is compared to 3 thresholds (S1, S2 and S3) in order to define the level of dysfunction:
- Grade 1 if D ≤ S1; - Grade 2 if S1 < D ≤ S2; - Grade 3 if S2 < D ≤ S3; and - Grade 4 if D > S3.
The threshold establishment influences classification and so it must be executed carefully: we propose an algorithm based on a cost function minimizing in section 4 entitled “Fixing thresholds: minimizing a cost function”. The density calculation assesses the overall condition of a sewer segment (regarding a given dysfunction); however this procedure cannot detect a critical concentration of defects. To fill this niche, scores Ni are aggregated per unit of length in order to obtain a longitudinal profile (procedure c in
figure 1.1). Then, the expert rules applied to longitudinal profile allow sewer segments to be classified. At last, the final grade is a synthesis of the 3 procedures (a, b and c in figure 1.1): the worst classification is retained.
Illustration: the sewer networks of the department of Bas-Rhin
Presentation of the case study
The experiment lead in the department of Bas-Rhin (Dorchies, 2005; Werey et al., 2006) follows the inventory of sewer networks carried out in 2003. This inventory, which does not include the urban community of Strasbourg, concerns 135 000 sewer segments for a total length of 5300 kilometres. Among these segments, 100 kilometres have been inspected since 1980, which represent 32 000 CCTV inspections. These closed circuit television inspections have been initially encoded using local coding
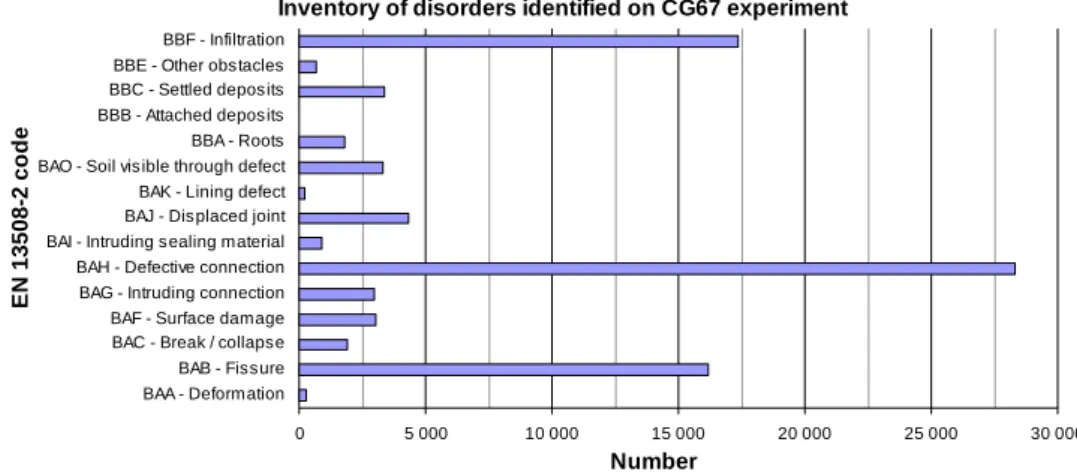
system; originally based on recommendations from the German Association for water management, wastewater and waste (ATV-DVWK, 1999). During the first stage of experiment, all observations have been re-encoded using the EN 13508-2 coding system. Then, for 7 indicators of the RERAU methodology (Le Gauffre et al., 2004), a single score has been calculated for each sewer segment (procedure b of figure 1.1). The 7 indicators are: INF/EXF – infiltration/exfiltration (seepage loss), HYD – decrease in hydraulic capacity, ENS – sand silting, BOU – blockage, DSC – destabilization of ground-pipe system, RAC – degradation from root intrusion and EFF – risk of collapse. INF and EXF are merged because they are currently evaluated with the same tables (see Table 1.1). These 7 indicators have been assessed for 17769 CCTV inspections. Figure 2.1 below presents an inventory of the observed disorders (in accordance with the EN 13508-2 coding system).
Inventory of disorders identified on CG67 experiment
0 5 000 10 000 15 000 20 000 25 000 30 000
BAA - Deformation BAB - Fissure BAC - Break / collapse BAF - Surface damage BAG - Intruding connection BAH - Defective connection BAI - Intruding sealing material BAJ - Displaced joint BAK - Lining defect BAO - Soil visible through defect BBA - Roots BBB - Attached deposits BBC - Settled deposits BBE - Other obstacles BBF - Infiltration E N 13508-2 co d e Number
Figure 2.1 EN 13508-2 codes of disorders and their numbers for the Bas-Rhin’s case study (Dorchies,
2005)
A preliminary analysis of the inventory shows 3 disorders which are more important than others: defective connection (BAH), infiltration (BBF) and fissure (BAB). These 3 disorders have often been observed on Bas-Rhin’s sewer networks. Moreover, considering the case study, several codes have never been found: defective brickwork or masonry (BAD), missing mortar (BAE), defective repair (BAL), weld failure (BAM), porous pipe (BAN), void visible through defect (BAP), ingress of soil (BBD), exfiltration (BBG) and vermin (BBH). Both of these observations can be:
- Due to re-encoding procedure (from home made coding system to EN-13508-2 coding system) which does not include some EN codes or transcripts too many disorders in the same codes (generally one line in home made coding leads to several lines in EN coding).;
- Most of the CCTV inspections were done after diagnosis studies regarding inflow/infiltration issues. Although these observations need further investigation and must be compared to other experiments to be generalized, second hypothesis is currently preferred to the first one.
Score of dysfunction indicators
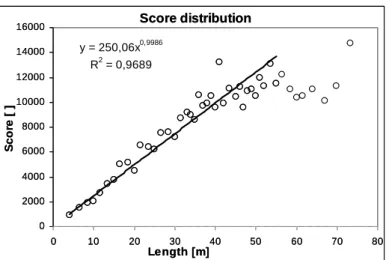
Figure 2.2 presents the score calculation related to infiltration dysfunction (INF) for more than 15205 sewer segments (from CCTV inspections); score is based on the aggregation of elementary scores calculated using equation 1 with values of table 1.1.
Score distribution 0 2000 4000 6000 8000 10000 12000 14000 16000 0 10 20 30 40 50 60 70 80 Length [m] Sc o re [ ] Score distribution y = 250,06x0,9986 R2 = 0,9689 0 2000 4000 6000 8000 10000 12000 14000 16000 0 10 20 30 40 50 60 70 80 Length [m] Sc o re [ ]
Figure 2.2 Average total score related to the different segment lengths, for a given dysfunction indicator
(INF4) – result of 15205 CCTV inspections
In the figure above, each dot represents an average of around 300 values (that is to say 300 inspected sewer segments) for a given range of sewer length. Another distribution with an average of around 150 values per dot was also tried and results were identical. As shown, concerning sewer segment length below 55 metres, there is a linear relationship between score and segment’s length (with a correlation coefficient of 0.9689). For length above 55 m, scores are lower. To explain this result, we propose some hypotheses that should be confirmed with further investigations:
- Re-encoding: transcription from home made coding system to EN 13508 may have induced some errors;
- Observation: the longer the segment is and the less the disorders are inventoried by operators (only major disorders are inventoried after some distance);
- Physical reality: in Bas-Rhin, installation of the longest segments date from 70s and so the longest segments are younger and may have less disorders; moreover the 70s correspond to better laying specifications and new materials;
- Other reasons…
The strong linear relationship between score and segment’s length confirms that the score density is a pertinent single score to characterize a segment, because this density is constant for segment’s length below 55 metres. Further investigations and experiments are required to characterize segment with length above 55 metres.
Dysfunction quantification versus expert opinion
The level of dysfunction is defined by comparing the single score to 3 thresholds S1, S2 and S3. The choice of thresholds is based, in this study, on expert’s propositions; moreover 2 values of α (3 and 4) are used for each dysfunction’s quantification (see equation 1). Results based on a panel of CCTV inspections were compared with an expert judgment and are presented in table 2.1.
Table 2.1 Synthesis of the confrontation of grade classification based on expert’s opinions and on
calculations (6 indicators for 13 sewer segments).
1 2 3 4 Total 1 2 3 4 Total 1 26 3 1 0 30 1 26 4 0 0 30 2 3 3 3 2 11 2 3 5 2 1 11 3 3 1 4 11 19 3 3 5 9 2 19 4 4 0 1 13 18 4 4 0 3 11 18 Total 36 7 9 26 78 Total 36 14 14 14 78 α = 3 α = 4 Expert's opinion
Dysfunction quantified Expert's opinion
Dysfunction quantified
This table compares expert’s opinions (each line corresponds to a dysfunction level) with single score calculations (in column). Diagonal values (in bold) correspond to judgment match: results show a good overall agreement between expert’s opinion and single score comparison to threshold. Moreover, α = 3 provides more dysfunction classified in grade 4 than α = 4: 13 cases among 18 are communally identified (11 for α = 4). These results attest importance of threshold determination. Any threshold will involve error in grade assignment. In the next section, we propose an algorithm to adjust threshold by controlling assignment errors.
Fixing thresholds: minimizing a cost function
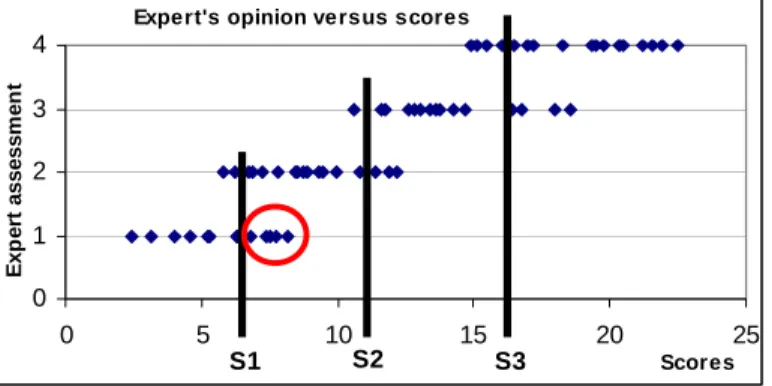
Figure 3.1 illustrates the assignment errors related to single value comparison to thresholds.
Expert's opinion versus scores
0 1 2 3 4 0 5 10 15 20 25 Scores E x p e rt assess m e n t S1 S2 S3
Figure 3.1 Experts’ opinion versus condition grades obtained by comparing scores with thresholds
(sample of 63 sewer segments).
The points encircled correspond to sewer segments assigned to grade 1 when considering expert’s opinion (this opinion is considered as reference) however assigned to grade 2 through the calculation procedure (segments’ score between thresholds S1 and S2). In this case, the level of dysfunction is overestimated and is called false positive (FP): segment wrongly assigned to a dysfunction situation (Le Gauffre et al., 2007). Conversely, a false negative (FN) concerns a sewer segment assigned for example to grade 3 according to expert’s opinion and assigned to grade 2 through calculation. In table 2.1, FP corresponds to the grey cells located in the upper triangle and FN corresponds to grey cells located in the lower triangle.
Fixing thresholds S1, S2 and S3 aims at minimizing consequences of assignment errors, that is to say the difference between the expert’s opinion and the single score utilization. An adjustment criterion C is proposed; it takes into account cost related to different situations of false positive and false negative, as given in equation 3:
∑ ∑
∑ ∑
= − = = =+ ⎟ ⎟ ⎠ ⎞ ⎜ ⎜ ⎝ ⎛ + ⎟ ⎟ ⎠ ⎞ ⎜ ⎜ ⎝ ⎛ = 4 2 1 1 3 1 4 1 ) ( ) / ( ) , ( ) ( ) / ( ) , ( i i j i i j FN i j i i i j FP i j P C E P E C i j PC E P E C C [3] With{
E1,E2,E3,E4}
Ei∈ level of dysfunction according to experts;
{
C1,C2,C3,C4}
Cj∈ level of dysfunction based on a single score comparison to thresholds;
P(Cj/Ei) occurrence probability of Cj for a segment in grade Ei (is determined with a calibration sample
and is depending on the 3 studied thresholds);
P(Ei) probability that a segment is in grade Ei (this probability is depending on the studied asset stock);
CFN(i,j) cost of a false positive FP(i,j), grade Ei and calculated value Cj with j>i ;
CFP(i,j) cost of a false negative FN(i,j), grade Ei and calculated valueCj with j<i).
Application on the studied population (experts’ opinion are unknown)
The calculation method is an iterative procedure. A chosen set k of thresholds (S1, S2 and S3)k applied to
the studied population enables to obtain the number (N(Cj)) and the proportion of segments in each grade P(Cj); using a score comparison to thresholds. Then, P(Ei) values are calculated with equation 4:
∑
∑
= = = = 4 1 4 1 ) ( * ) / ( ) ( ) ( ) ( i i i j j j j j P C E P E C N C N C P [4]The required values of P(Cj/Ei) depend only on thresholds and they are evaluated using a calibration
sample (see next section for further explanations). Thus the cost function C can be calculated for (S1, S2 and S3)k with equation 3. These steps are repeated for each different set of thresholds and the set which
minimized C is kept.
The criterion C, “total cost of all assignment errors”, is based on several costs CFP(i,j) and CFN(i,j).
Thresholds are thus strongly depending on costs related to false positives and false negatives. These costs represent the stakes chosen by wastewater services and represent also their practices (actions when a segment is classified in grade Cj).
Calibration sample (expert’s opinions are known)
An example of calibration sample is presented figure 3.1: as shown in this figure, grade assignment errors depend on thresholds. That is to say, given 3 thresholds, P(Cj/Ei) values can be calculated, it
corresponds to (the number of segments assigned to grade j according to score and to grade i according to expert’s opinion) divided by (the total number of segments assigned to grade i according to expert’s opinion).
In order to be used for calibration, a sample should present enough “dots” for each grade assigned by expert (each line). A dot corresponds to a sewer segment for which score and expert’s opinion are known. The calibration sample is considered representative for the French territory due to the fact that each grade is clearly defined.
Example: influence of false positive and false negative costs
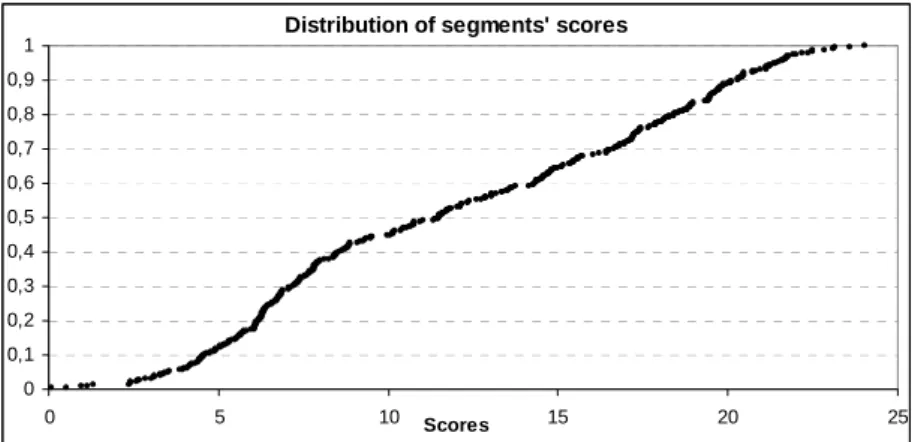
In order to attest influence of CFN / CFP ratio, 3 alternatives have been studied. The studied asset stock consists of 400 sewer segments; segments’ scores are between 0.098 and 24.03, as shown in figure 3.2. Figure 3.1 presents the sample used for calibration.
Distribution of segments' scores
0 0,1 0,2 0,3 0,4 0,5 0,6 0,7 0,8 0,9 1 0 5 10 Scores 15 20 25
Figure 3.2 Distribution of 400 segments’ scores of the studied asset stock.
Each alternative has a different CFN / CFP ratio, as presented in table 3.1 below:
Table 3.1 Three alternatives are proposed in order to adjust thresholds: in alternative 1, CFN / CFP = 1.5
(CFP = 1 and CFN = 1.5), in alternative 2, CFN / CFP = 3, and in alternative 3, CFN / CFP = 5.
1 2 3 4 1 2 3 4 1 2 3 4 1 0 1 1 1 0 1 1 1 0 1 1 1 2 1,5 0 1 1 3 0 1 1 5 0 1 1 3 1,5 1,5 0 1 3 3 0 1 5 5 0 1 4 1,5 1,5 1,5 0 3 3 3 0 5 5 5 0 Alternative 3 Dysfunction quantified Alternative 2 Expert's opinion
Dysfunction quantified Dysfunction quantified
Alternative 1
Alternative 3 has higher CFN / CFP ratio than alternatives 1 and 2, and alternative 1 has lower CFN /
CFP ratio than alternative 2. Both CFN and CFP depend on manager’s strategy. CFN corresponds to
costs related to consequences of a failure such as social costs due to disturbance for users, replacement costs instead of reparation costs. CFP corresponds to costs such as useless CCTV (required before any rehabilitation action). Alternative 3 represents high CFN / CFP ratio: for example a strategy in which the manager wants to avoid failures at any price. Results are presented in table 3.2:
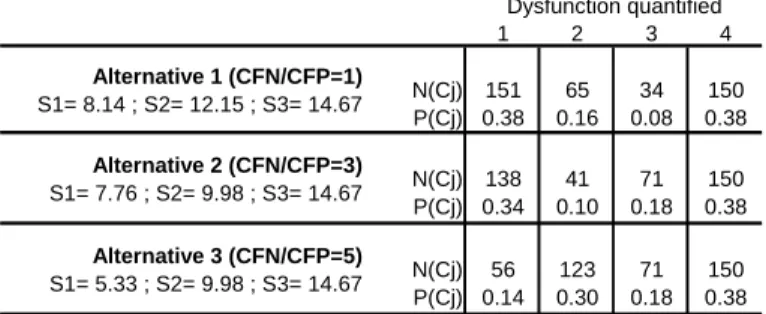
Table 3.2 Results for all alternatives: numbers of segment assigned to each grade (N(Cj)) and proportion
of segments in each grade P(Cj) calculated using score comparison to thresholds. Thresholds obtained
are displayed below each alternative.
1 2 3 4 Alternative 1 (CFN/CFP=1) S1= 8.14 ; S2= 12.15 ; S3= 14.67 N(Cj) P(Cj) 151 0.38 65 0.16 34 0.08 150 0.38 Alternative 2 (CFN/CFP=3) S1= 7.76 ; S2= 9.98 ; S3= 14.67 N(Cj) P(Cj) 138 0.34 41 0.10 71 0.18 150 0.38 Alternative 3 (CFN/CFP=5) S1= 5.33 ; S2= 9.98 ; S3= 14.67 N(Cj) P(Cj) 56 0.14 123 0.30 71 0.18 150 0.38 Dysfunction quantified
Concerning the studied asset stock, probabilities related to each grade Ei (and obtained for all
alternatives) are: P(E1)=0.3 ; P(E2)=0.2 ; P(E3)=0.2 ; and P(E4)=0.3. As shown in the table, increasing
CFN / CFP ratio involves the increasing of segments’ number assigned to grade 3 to the detriment of
grades 1 and 2 (comparing alternative 1 and 2). If CFN / CFP ratio increases more, segments’ number assigned to grade 2 increases to the detriment of grade 1 (comparing alternative 2 and 3). Decrease of segments’ number assigned to grade 4 is obtained for very low ratio of CFN / CFP (ratio < 0.4). Procedure based on a cost function is stable and the number of segments assigned to grade 4 varies less than numbers in grade 2 and 3.
Discussion
The first application on a large scale (Bas-Rhin – France) has demonstrated that RERAU methodology is operational in order to assess dysfunction indicators from CCTV inspections. This application has also highlighted importance of thresholds determination, allowing numerical values (scores) to be converted into level of dysfunction (grade from 1 to 4). We propose a calibration criterion (misclassification cost) enabling to take into account simultaneously false positive and false negative errors. Thus imprecision of assessment is taken into account: the threshold is chosen as to be the most efficient (in term of cost). This approach is generally applicable to numerous domains, when levels of performance need to be defined.
This cost minimizing procedure has a meaning exclusively at the scale of the asset stock; it induces errors punctually (at the scale of the sewer segment) which may be considerable. As a perspective, we propose to study the contribution of fuzzy theory applied to threshold determination. Fuzzy approach, introduced by Zadeh (1978), offers the possibility to include imprecise transition between the different states. That is to say it allows defining that a segment may belong to two grades when it is difficult to establish a sharp statement.
Acknowledgements
Results presented in this paper were initiated in the frame of the French R&D RERAU program (“Réhabilitation des Réseaux d’Assainissement Urbains”) and they are carried on in the frame of the INDIGAU research project (“Indicateurs de performance pour la gestion patrimoniale des réseaux d’assainissement urbains”; www.indigau.com) supported by the French National Agency for Research – ANR within the PGCU-2006 program. The authors would like to thank all the participants of the RERAU and INDIGAU projects.
References
ATV-DVWK. (1999) M 149 – Zustandserfassung, -klassifierung und -bewertung von Entwässerungssystemen
auβerhalb von Gebäude. Hennef, GFA, ISBN 3-933693-31-4.
CEN (2003) EN 13508-2 Condition of drain and sewer systems outside buildings, Part 2: Visual inspection coding
system, European Norms.
Knolmar, M. and Szabo, G. C. (2003). CARE-S report D3 - WP2 Structural condition - Classification systems based
on visual inspection, Technical report of the CARE-S project, Budapest University of Techonology and
Economics, 192 p.
Dorchies, D. (2005) Etude de l'applicabilité de l'outil d'aide à la décision RERAU pour la réhabilitation des réseaux
d'assainissement sur l'inventaire du département du Bas-Rhin, Mémoire de fin d’études, ENGEES Strasbourg,
UMR Gestion des Services Publics, 62 p.
Le Gauffre P., Joannis C., Breysse D., Gibello C. and Desmulliez J.J. (2004) Gestion patrimoniale des réseaux
d’assainissement urbains. Guide méthodologique. Paris, Lavoisier Tec&Doc, 416 p., ISBN 27430-0748-6.
Le Gauffre P., Joannis C., Vasconcelos E., Breysse D., Gibello C., Desmulliez J.J. (2007) Performance Indicators and Multicriteria Decision Support for Sewer Asset Management. Journal of Infrastructure Systems, ASCE,
13(2), June 2007, 105-114.
Werey C., Dorchies D., Mellac Beck I. (2006) Sewer asset management: assessing criteria for a multicriteria decision support on a county level data base. Joint int. conf. on Computing and decision making in civil and
building engineering, Montreal, June 14-16, 886-895.