HAL Id: hal-01796508
https://hal.archives-ouvertes.fr/hal-01796508
Submitted on 12 Sep 2018
HAL is a multi-disciplinary open access
archive for the deposit and dissemination of
sci-entific research documents, whether they are
pub-lished or not. The documents may come from
teaching and research institutions in France or
abroad, or from public or private research centers.
L’archive ouverte pluridisciplinaire HAL, est
destinée au dépôt et à la diffusion de documents
scientifiques de niveau recherche, publiés ou non,
émanant des établissements d’enseignement et de
recherche français ou étrangers, des laboratoires
publics ou privés.
Quick and Efficient Link Quality Estimation in Wireless
Sensors Networks
Henry-Joseph Audéoud, Martin Heusse
To cite this version:
Henry-Joseph Audéoud, Martin Heusse. Quick and Efficient Link Quality Estimation in Wireless
Sen-sors Networks. 2018 14th Annual Conference on Wireless On-demand Network Systems and Services
(WONS), Feb 2018, Isola, France. �10.23919/WONS.2018.8311667�. �hal-01796508�
Quick and Efficient Link Quality Estimation
in Wireless Sensors Networks
Henry-Joseph Audéoud and Martin Heusse
Univ. Grenoble Alpes, CNRS, Grenoble INP∗, LIG, F-38000 Grenoble France
∗Institute of Engineering Univ. Grenoble Alpes
Email: {henry-joseph.audeoud,martin.heusse}@univ-grenoble-alpes.fr
Abstract—In wireless sensor networks, link metric estimation at each hop should not require a long history of packet exchanges. In this paper, we explore several approaches to link quality estimation. We report on the results of experiments on the Grenoble testbed of the FIT IoT-lab composed of a set of Cortex M3 nodes with IEEE 802.15.4 radios. Whereas the received signal power is a poor indication of PDR (Packet Delivery Ratio) that one can expect on a given link, LQI (Link Quality Indicator) gives more accurate information. We propose a two stage classification, in which a very large fraction of links are immediately either deemed usable or not, while the remaining ones need a bit more testing before they are advertised by the routing protocol as good or weak links.
Index Terms—Wireless Sensor Networks, Link Metric Estima-tion, LQI
I. INTRODUCTION
Routing in multi-hop low power networks requires dedi-cated routing protocols like RPL [1], LOADng [2] or LRP [3]. These protocols have to keep their own footprint small while selecting the best way to route the data traffic. However, the routing protocol builds on the links that nodes announce to their neighbors, so that this preliminary link quality assessment needs to be precise and accurate for routing to succeed. Also, the metric (or metrics) estimation at this point should not require a long history of packet exchanges, since this would require that nodes passively monitor traffic or exchange dummy packets before effectively joining the network, or alternatively, it could cause several routing updates at the network initialization while the metric stabilizes. Furthermore, in the cases where energy or traffic generation would be much constrained like multi-hop LPWAN, it is easy to imagine situations in which nodes could not get to even overhear much of the packets from neighbors that they are not associated with.
On the Grenoble testbed of the FIT IoT-lab1, we have
used a set of Cortex M3 nodes with IEEE 802.15.4 ra-dios (AT86RF231 radio chip) to experiment with several approaches to link quality estimation. We have started with the observation that our testbed exhibits the same kind of packet delivery ratio variability un function of the distance and the received signal power as reported in the previous work (Section II). In contrast, we have obtained more accurate and smoother varying results by reading LQI (Link Quality Indi-cator) after packet reception, so we base our link classification
1http://www.iot-lab.info
on this measurement (Section III). Although LQI brings more valuable information, we show in Section IV that it is still safer to check connectivity in the reverse direction, whereas only a small fraction of the links basically require more effort to assess their reliability.
We end up with a metric that revives the weak link and
hop count of the early versions of LOADng: by classifying
suspicious links as weak links, they would be avoided by the routing protocol as long as other options exist. This classification only requires few packet exchanges and it can be far more stable than ETX that may lead to concentrate the power drain on the node at the head of a marginal link due to retransmissions.
II. BASICMETRICS ANDTHEIRFLAWS
The hop count is the most basic metric, it simply counts the number of nodes crossed to reach a destination. This metric is simple and straightforward to implement, but is too naive for wireless or PLC (Power Line Communication) links. Indeed, when building their routes, a node will tend to use more distant neighbors that appear closer from the intended destination. This bias has a drawback: the farthest neighbors are also those with which communication is the most difficult: long links tend to be at the edge of the communication range and thus more lossy.
The Packet Delivery Ratio (PDR) captures the link quality through its loss rate. Inverting PDR gives the number of trans-missions likely needed to get one packet through a link: this is ETX (Expected Transmission Count) metric of RPL [4]. The idea behind ETX is that, considering the network as a whole, it is equivalent to for instance retransmit the same packet twice on the same node or use a two-hop route. What ETX does not capture, though, is that it leads to disregard reliable multi-hop routes in favor of concentrating the (re)transmission effort on nodes at the head of lossy links.
Obtaining a reliable estimate of ETX (or PDR) may be challenging in itself. Woo et al. [5], [6] proposed a moving average estimator to dampen reception rate statistics over several time intervals, which trades stability for reactivity. Moreover, this type of estimators is usable a posteriori, i.e., it requires substantial traffic already sent from a neighbor node. So, although such an approach is useful to re-optimize the routes, it does not provide a priori information, i.e., when we have just received only one packet from a previously unknown
10
010
1link length [m]
90
80
70
60
50
40
30
20
RSSI [dBm]
links (used for regression)
links (not used for regression)
x-log regression
Fig. 1: Relation between the average RSSI of a link and its length (distance between the emitter and the receiver). Each point is a link between two of the 28 testbed nodes. The lack of reception below the radio sensitivity threshold (-91 dBm) biases the set of values; so the linear regression is computed only below 6 meters.
neighbor and when the first routing decisions need to take place.
The IEEE 802.15.4 standard proposes two ways of assessing the link quality after packet reception, both measured at the physical layer:
• the Radio Signal Strength Indicator (RSSI) that captures
the average power of the received signal over eight IEEE 802.15.4 symbols;
• the Link Quality Indicator (LQI) that characterizes if the
last packet was “heard” clearly or not.
The trend of RSSI vs. distance in Figure 1 corroborates already reported measurements [7], [8]. In the figure, each point is the average of ≈ 2000 measurements over each link, on all 16 available frequency channels. First, we observe two groups of dots: below 6 m, RSSI is well over the receiver sensitivity (-91 dBm for our chips) and it follows a clear linear trend. It reflects a linear relationship between the received
power and d1γ, with a good match between our measures and
the two-ray ground model, since we find γ = 4.12. There is quite a bit of variability, as the correlation coefficient is only
r2= 0.652. This distance exponent falls well within the decay
factor γ ∈ [1.90, 4.75] reported by Hara et al. [7].
Second, for distances where RSSI falls often below the sensitivity (beyond 6 m, in this setup), the measurements are biased by packet losses. So we do not use them for the linear fit, though the remaining points still follow the same trend.
Essentially, RSSI is very coarsely correlated with distance and longer links can be safely reachable while relatively short ones are unusable.
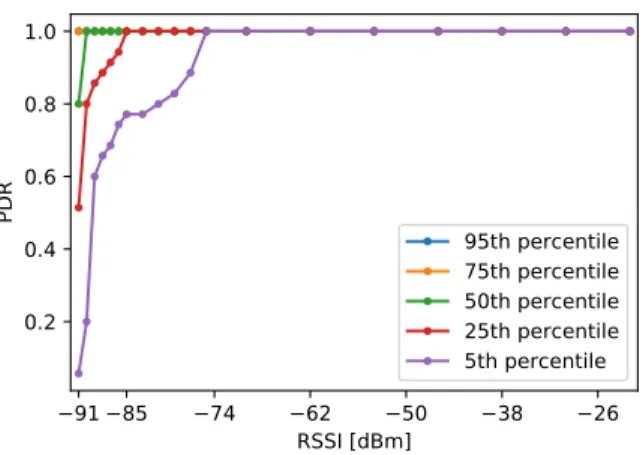
Looking at the relationship between RSSI and packet deliv-ery ratio in Figure 2 reveals that the links at least 6 dB above the radio reception power threshold (i.e., -85 dBm) are usable without question. However, RSSI gives little information for the links below this limit: a vast majority of the links are
91 85
74
62
50
38
26
RSSI [dBm]
0.2
0.4
0.6
0.8
1.0
PDR
95th percentile
75th percentile
50th percentile
25th percentile
5th percentile
Fig. 2: PDR of a link, as a function of the average perceived RSSI. Example interpretation: 5% of links with an RSSI of 85 dBm have PDR below 75%.
still usable, even where RSSI is near the radio reception power threshold (i.e., -91 dBm), whereas some others should be avoided because they lose 90% of packets, or more.
In an outdoor environment, also with IEEE 802.15.4 radios, Zennaro et al. [8] found the same kind of RSSI threshold value below which the link quality is all but certain although some links may be good.
III. CLASSIFICATION OFLINKSBASED ONLQI
RSSI indicates the power of the received signal on the IEEE 802.15.4 channel during the reception of the frame header. However, it does not provide information on the noise intensity nor on the interference. IEEE 802.15.4 proposes another metric called the Link Quality Indicator (LQI), which is an estimation of the quality of the received packet. The standard does not give a definite computation method for LQI; it thus depends on the chip implementation. This may explain why LQI is sometimes considered loosely related to PDR (e.g., Papadopoulos et al. [9]). The standard only states that LQI is a value between 0 and 255, where 0 corresponds to the worst links and 255 to the best ones. In the case of AT86RF231 used by the nodes of our testbed, the transceiver computes LQI from the correlation of multiple received symbols of the frame with the expected signal. The result intends to give insight on PDR that one can expect. We confirm this with the results in Section III-A that mostly match the claims of the datasheet [10].
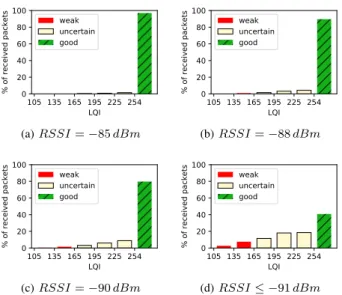
In Section II and Figure 2, we found that RSSI is not sufficient to classify the links when the signal power falls below −85 dBm. When RSSI becomes irrelevant, LQI begins to provide interesting information. Figure 3 summarizes the information provided by LQI within this range and shows that when RSSI reaches the radio reception threshold (−91 dBm), LQI still allows to consider 40% of them as certainly good links with perfect reception quality. By contrast, ETX is often a very unstable metric for these marginal links [11].
105 135 165 195 225 254 LQI 0 20 40 60 80 100 % of received packets weak uncertain good (a) RSSI = −85 dBm 105 135 165 195 225 254 LQI 0 20 40 60 80 100 % of received packets weak uncertain good (b) RSSI = −88 dBm 105 135 165 195 225 254 LQI 0 20 40 60 80 100 % of received packets weak uncertain good (c) RSSI = −90 dBm 105 135 165 195 225 254 LQI 0 20 40 60 80 100 % of received packets weak uncertain good (d) RSSI ≤ −91 dBm
Fig. 3: Distribution of LQI for a packet received with given RSSI. The classification follows the criteria in Table I. The rightmost bar is for LQI = 255 only, the other bars aggregate 30 consecutive values.
96
128
160
192
224
255
LQI
0.0
0.2
0.4
0.6
0.8
1.0
PDR
uncertain zone
95th percentile
75th percentile
50th percentile
25th percentile
5th percentile
Fig. 4: Distribution of PDR of a link as a function of the average perceived LQI. The uncertain zone corresponds to the values of LQI insufficient to classify the link as good or weak. Note that LQI = 255 is not included in the uncertain zone.
Appellation Criterion Recommendation good LQI = 255 Just use this link uncertain 165 ≤ LQI < 255
Not enough information to classify this link. Prefer known
goodlinks, or compute more statistics on this link to classify it weak LQI ≤ 165 Certainly a weak link: advertise it as such by the routing protocol
TABLE I: Classification of links according to measured LQI.
126 142 158 174 190 206 222 238 254
LQI
0
10
20
30
Std deviation of the LQI
uncertain zone
Fig. 5: Variability of LQI. Only links that offer average
RSSI ≤ −91 dBm are considered and the standard deviation is computed independently on every link.
A. Criteria for Link Classification
Figure 4 presents the correlation between PDR of a link and the average LQI perceived by a node. Considering that
good links are those whose PDR > 80%, we can identify
three zones summarized in Table I. On the right hand side, the links that expose LQI = 255 can be considered as good without any doubt; however, as soon as LQI falls below 254, the quantity of weak links (that experience PDR < 80%) is no more negligible. Further to the left, where LQI ≤ 165, almost all links (more than 95%) are definitively weak. Between these two limits, the links cannot be immediately classified as good or weak. To differentiate them, the node needs to dedicate more resources. These are called uncertain links.
This group of uncertain links is similar to the transitional
region defined by Woo et al. [5], [6] as well as others [12],
[13], although less links fall in this region when LQI is used instead of RSSI.
B. LQI Variability
In our experience, LQI is a relatively stable metric, though it may be sensitive to modifications of the environment. Figure 5 studies its variability, by presenting the standard deviation of LQI over each link, for all links that offer low RSSI (≤ −91 dBm) — for higher values of RSSI, LQI stays at 255, as depicted in Figure 3. To the right, the extremely small variability illustrates how the good links are really stable even though their RSSI is low, which calls for giving them priority. However, in the uncertain zone, the variability of LQI is not negligible, and this is one more reason to carefully check these
uncertainlinks before using them.
We note that below ≈ 222, LQI seems to keep the same variability, which is a border effect, due to the fact that the packets with the worst transmission conditions are not received at all. Figure 4 shows that half of the link have PDR < 70% at the low limit of the uncertain zone and the absence of these 30% packets in the data of Figure 5 implies a bias in favor of the best LQI values.
Y → X good uncertain weak X → Y
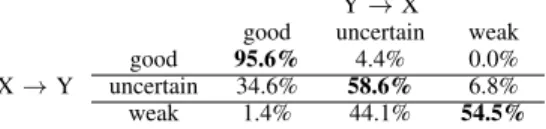
good 95.6% 4.4% 0.0% uncertain 34.6% 58.6% 6.8% weak 1.4% 44.1% 54.5%
TABLE II: Distribution of the quality of the link Y → X
when the quality of the link X → Y is known.
IV. ENSUREREVERSEDIRECTIONQUALITY
In general, simple propagation models assume that the links between nodes are symmetric, i.e., they have the same PDR in both directions. In practice, even if this hypothesis is valid for strong links that offer high RSSIs and for which a small difference in the radio circuits of localized interference does not impact PDR, it can be called into question once RSSI approaches the radio reception power threshold and when the link quality varies a lot for a given reception power [14].
Although Section III-A gives us useful information on the reliability of one direction of propagation (for the received packets), the information is only valid for this communication direction. Not much is known for the reverse direction (the packets sent by the node in question).
To evaluate the prevalence of asymmetric links, we report in Table II the proportion of links in each class once a given direction is known. All three lines confirm that the symmetric case is the most frequent case. 95% of the good links are also good in the reverse direction. The uncertain links perhaps require to dedicate more efforts to use them or not: more than one third is actually good in the other direction, which indicates a strong chance of acceptable PDR, however, they should be carefully checked.
V. CONCLUSION
Instead of pursuing elusive levels of precision for the assess-ment of link quality, we focus on quickly establishing if a link should be considered or not. This operation can be done with a little effort as long as the physical layer provides LQI after a packet reception. In the particular case of IEEE 802.15.4, spread spectrum (DSSS with SF=8) makes the physical layer robust enough to survive quite a bit of interference or noise. At the same time, the observation of the proportion of chip errors at the receiver gives valuable ancillary information about the channel quality. We expect that the same approach could be used for BLE (that uses FEC and DSSS) or LoRa.
From LQI, most unidirectional links are immediately either usable or not. Still, we stress that in many cases, it is safer to first check that a good candidate link is also reliable in the reverse direction, which requires just a basic handshake. Otherwise, a fraction of links requires more effort to be classified and the uncertainty can be sorted out through the exchange of a few additional packets.
We end up with a classification of the links in two cate-gories: reliable and weak links, with the idea to avoid the latter as much as possible, only if they are necessary to maintain connectivity.
A two-class categorization lends itself well to implementing hysteresis or other kinds of stabilizing mechanism to avoid that a link oscillate between the two classes. This issue will require more investigation, although we expect to observe such a behavior in rare cases.
VI. ACKNOWLEDGMENTS
This work has been partially supported by the French Ministry of Research projects DataTweet under contract ANR-13-INFR-0008-01 and the PERSYVAL-Lab under contract ANR-11-LABX-0025-01.
REFERENCES
[1] T. Winter and P. Thubert and A. Brandt and J. Hui and R. Kelsey and P. Levis and K. Pister and R. Struik and JP. Vasseur and R. Alexander, “RPL: IPv6 Routing Protocol for Low-Power and Lossy Networks,” Internet Requests for Comments, RFC Editor, RFC 6550, March 2012, http://www.rfc-editor.org/rfc/rfc6550.txt. [Online]. Available: http://www.rfc-editor.org/rfc/rfc6550.txt
[2] T. Clausen, A. Colin de Verdiere, J. Yi, A. Niktash, Y. Igarashi, H. Satoh, U. Herberg, C. Lavenu, T. Lys, and J. Dean, “The Lightweight On-demand Ad hoc Distance-vector Routing Protocol - Next Generation (LOADng),” IETF, Work in Progress draft-clausen-lln-loadng-15, Octo-ber 2016.
[3] H.-J. Audéoud and M. Heusse, “Experimental Comparison of Routing Protocols for Wireless Sensors Networks: Routing Overhead and Asymmetric Links,” in 29th International Teletraffic Congress, Genoa, Italy, Sep. 2017. [Online]. Available: http://hal.univ-grenoble-alpes.fr/hal-01609451
[4] D. Aguayo, J. Bicket, S. Biswas, G. Judd, and R. Morris, “Link-level Measurements from an 802.11B Mesh Network,” SIGCOMM Comput. Commun. Rev., vol. 34, no. 4, Aug. 2004.
[5] A. Woo and D. Culler, “Evaluation of Efficient Link Reliability Estima-tors for Low-Power Wireless Networks,” EECS Department, University of California, Berkeley, Tech. Rep. UCB/CSD-03-1270, 2003. [6] Woo, Alec and Tong, Terence and Culler, David, “Taming the
Underly-ing Challenges of Reliable Multihop RoutUnderly-ing in Sensor Networks,” in In SenSys. ACM Press, 2003, pp. 14–27.
[7] Hara, Shinsuke and Zhao, Dapeng and Yanagihara, Kentaro and Taket-sugu, Jumpei and Fukui, Kiyoshi and Fukunaga, Shigeru and Kitayama, Ken-ichi, “Propagation characteristics of IEEE 802.15.4 radio signal and their application for location estimation,” in Vehicular Technology Conference, 2005. VTC 2005-Spring. 2005 IEEE 61st, vol. 1. IEEE, 2005, pp. 97–101.
[8] Zennaro, Marco and Ntareme, Hervé and Bagula, Antoine, “Experimen-tal Evaluation of Temporal and Energy Characteristics of an Outdoor Sensor Network,” Proceedings of the Mobility ’08 Conference, 2008. [9] Georgios Z. Papadopoulos and Antoine Gallais and Guillaume Schreiner
and Emery Jou and Thomas Noel, “Thorough IoT testbed Characteriza-tion: from Proof-of-concept to Repeatable Experimentations,” Elsevier Computer Networks, vol. 119, pp. 86–101, 2017. [Online]. Available: http://www.sciencedirect.com/science/article/pii/S1389128617300804 [10] “Low Power 2.4 GHz Transceiver for ZigBee, IEEE 802.15.4,
6LoWPAN, RF4CE, SP100, WirelessHART, and ISM Applications,” Atmel ,R Tech. Rep., October 2009. [Online]. Available: http://www.atmel.com/images/doc8111.pdf
[11] N. Baccour, A. Koubâa, M. B. Jamâa, D. do Rosário, H. Youssef, M. Alves, and L. B. Becker, “RadiaLE: A Framework for Designing and Assessing Link Quality Estimators in Wireless Sensor Networks,” Ad Hoc Netw., vol. 9, no. 7, pp. 1165–1185, Sep. 2011.
[12] Zamalloa, Marco Zúñiga and Krishnamachari, Bhaskar, “An Analysis of Unreliability and Asymmetry in Low-Power Wireless Links,” ACM Transactions on Sensor Networks, Jun 2007.
[13] M. Zuniga and B. Krishnamachari, “Analyzing the Transitional Region in Low Power Wireless Links,” in Proc. SECON Conference. IEEE, 2004, pp. 517–526.
[14] K. Pengwon and T. Komolmis and P. Champrasert, “Solving asymmetric link problems in WSNs using site Link Quality Estimators and dual-tree topology,” in 2016 13th International Conference on Electrical En-gineering/Electronics, Computer, Telecommunications and Information Technology (ECTI-CON), June 2016, pp. 1–4.