Characterization, Prediction, and Mitigation of Code
Help Events at Massachusetts General Hospital
by
Christian Adib
B.E., Mechanical Engineering, Lebanese American University (2013)
M.S., Mechanical Engineering, Columbia University in the City of New York (2014) Submitted to the MIT Sloan School of Management and the Civil and
Environmental Engineering Department
in partial fulfillment of the requirements for the degrees of Master of Business Administration
and
Master of Science in Civil and Environmental Engineering in Conjunction with the Leaders for Global Operations Program
at the
MASSACHUSETTS INSTITUTE OF TECHNOLOGY
June 2019
Massachusetts Institute of Technology 2019. All rights reserved.
Signature redacted
Author ...
MIT Sloan School of Management and the Civil and Environmental Engineering
Signature redacted
DepartmentMay 18, 2019
Certified by... ...
Retsef Levi J. Spencer Standish (1945) Professor o? Operations Management
Signature redacted
Thesis SupervisorC ertified by ... ... Saurabh Amin Associate Professor Accepted
by ...
aTh
sis Supervisor r. Heidi NepfGraduate Program Committee Professor, Civil and Environme al Engineering Accepted by ...
Signature
redacted
...
Maura Herson
MASSACHUSETTS INSTITUTE Assistant Dean, MBA Program, MIT Sloan School of Management
OF TECHNOLOGY
JUN
0 4 2019
Characterization, Prediction, and Mitigation of Code Help
Events at Massachusetts General Hospital
by
Christian Adib
Submitted to the MIT Sloan School of Management and the Civil and Environmental Engineering Department
on May 18, 2019, in partial fulfillment of the requirements for the degrees of
Master of Business Administration and
Master of Science in Civil and Environmental Engineering in Conjunction with the Leaders for Global Operations Program
Abstract
This thesis suggests a method to characterize congestion alarms triggered by the Emergency Department (ED) at Massachusetts General Hospital, attempts to predict the incidence of these alarms using logistic regression, and proposes operational recommendations for the mitigation of congestion events termed Code Help. In order to characterize Code Help alarms, we begin by identifying a set of relevant operational features that allow us to describe them objectively and proceed to clustering Code Help observations using k-means. We regress these features on binary variables indicating Code Help incidence to predict, at 7AM in the morning, whether or not Code Help will occur on a given day. Based on this analysis, we suggest a set of recommendations to operationalize a more effective response to Code Help. Our characterization uncovers three main classes of Code Help: those exhibiting a high level of ED arrivals in the hour preceding the alarm with a relatively low operational utilization of inpatient beds, those exhibiting a low level of ED arrivals in the hour preceding the alarm with a relatively high operational utilization of inpatient beds, and those exhibiting high arrivals and utilization. The logistic regression identifies two statistically significant predictive features: ED Census at 7 AM and the Number of Boarders in the ED at 7 AM, scaled against same time of day and day-of-week observations. Moreover, we identify discharge orders and outpatient pharmacy orders as early discharge indicators that can be used to prioritize Medicine patients in terms of their readiness to be discharged when Code
Help is called.
Thesis Supervisor: Dr. Retsef Levi
Title: J. Spencer Standish (1945) Professor of Operations Management Thesis Supervisor: Dr. Saurabh Amin
Acknowledgments
I would first like to thank Dr. Peter Dunn, Mrs. Bethany Daily, and Dr. Cecilia Zenteno Langle for their helpful guidance throughout my time at MGH. You have generously volunteered your time to get me up to speed on Healthcare Operations in the MGH setting.
Dr. Kyan Safavi, thank you for the time you spent explaining clinical terminology to me and for your advice concerning the identification of early indicators of discharge. Your commitment to improving the patient experience was truly inspiring.
To Bob Seger, Beth Grabowski, Cassie Kraus, and Karen Lynch: I thank you for explaining to me how the MGH Emergency Department works, for always being available to answer my questions, and for providing me with the data required to complete the analyses in this study.
To my advisors, Dr. Retsef Levi and Dr. Saurabh Amin, I am indebted to you for your guidance throughout the research process and your thoughtful feedback throughout the writing of this thesis. Retsef, thanks for holding me to a very high standard and always trusting that I will deliver.
To my friends Marc Barbar and Rami Khoury, thanks for keeping me sane through-out this last year. Our late night discussions have helped me put things in perspective and continuously reminded me that life exists outside of MIT. To my family, Hana, Toni, and Elio Adib: you are my inspiration. I will forever be grateful to you for your words of encouragement and for always believing in me. Cynthia, my life partner, I am really thankful to have had you by my side during my time at LGO. Thank you for your patience and for your unwavering support to me over the past two years. I could not have done it without you.
Contents
1 Introduction 15
1.1 Massachusetts General Hospital . . . . 15
1.2 The MIT-MGH Collaboration . . . . 16
1.3 The Capacity Task Force . . . . 16
1.4 Project M otivation . . . . 17
1.4.1 Emergency Department Visit Volume . . . . 17
1.4.2 The Emergency Medical Treatment and Active Labor Act (EM-T A LA ) . . . . 18
1.4.3 Banning Ambulance Diversion . . . . 18
1.4.4 The Code Help Capacity Protocol . . . . 19
1.4.5 Code Help Implementation Challenges . . . . 20
1.5 Project M ethodology . . . . 20
1.6 M ain Hypotheses . . . . 21
1.7 K ey R esults . . . . 22
1.8 Thesis Organization . . . . 23
2 Literature Review 25 2.1 Emergency Department (ED) Overcrowding . . . . 25
2.1.1 Causes of Emergency Department (ED) Overcrowding . . . . 25
2.1.2 Solutions to Emergency Department (ED) Overcrowding . . . 26
2.1.3 Consequences of Emergency Department (ED) Overcrowding . 27 2.2 Previous Work at the MGH ED . . . . 28
3 Data Sources, Patient Flow in the ED Environment, and Code Help
Protocol 29
3.1 Data Sources: Epic and D4Q ... 29
3.1.1 Data Sources ... ... 29
3.1.2 Datasets ... ... 31
3.2 Patient Flow . . . . 31
3.2.1 Patient Flow Through the MGH ED . . . . 31
3.2.2 Patient Flow Within the MGH ED . . . . 32
3.3 Code Help at the MGH Emergency Department . . . . 35
3.3.1 Standard Operating Procedures . . . . 36
3.3.2 Approaching Code Help . . . . 36
3.3.3 Code H elp . . . . 37
3.3.4 Capacity Disaster . . . . 38
3.4 Current State of Code Help . . . . 39
3.4.1 Frequency of Code Help Alarms . . . . 39
3.4.2 Time Distribution of Capacity Alarms . . . . 39
3.4.3 Alarm Conversion . . . . 41
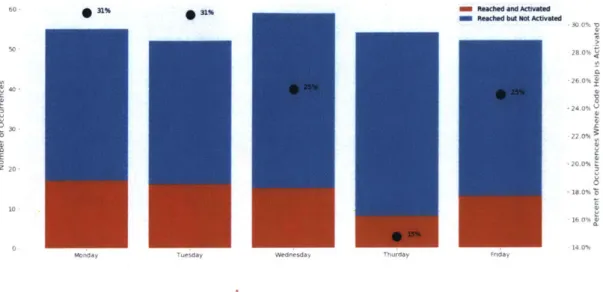
3.4.4 Day-of-week Distribution of Code Help Alarms . . . . 44
4 Classification of Code Help Events 49 4.1 Exploratory Analysis of Relevant Features . . . . 49
4.1.1 ED Patient Census . . . . 50
4.1.2 ED Patient Discharges . . . . 57
4.1.3 Inpatient Discharges . . . . 59
4.1.4 ED Boarder Patients Census . . . . 61
4.1.5 Average Boarding Time of Boarder Patients . . . . 65
4.2 Code Help Clustering . . . . 69
4.2.1 Feature Selection and Scaling . . . . 69
4.2.2 K-Means Algorithm . . . . 70
4.2.4 Discussion of Results . . . . 4.3 Congestion Dashboard . . . . 5 Early Indicators of Discharge
5.1 Early Indicators of Discharge . . . .
5.1.1 Discharge Summaries . . . .
5.1.2 Discharge Orders . . . .
5.1.3 Outpatient Pharmacy Orders . . . .
5.1.4 Epic Definite Discharge Flag . . . .
5.2 Potential Impact and Limitations . . . .
5.2.1 Potential Impact . . . .
5.2.2 Limitations: Barriers to Timely Discharge
6 Code Help Prediction
6.1 M odel Choice . . . .
6.1.1 Logistic Regression . . . .
6.1.2 LASSO and Ridge Logistic Regressions . .
6.1.3 Analysis Method . . . .
6.1.4 Modeling Performance . . . .
6.1.5 Discussion of Results . . . .
7 Code Help Mitigation Measures
7.0.1 Short Term . . . .
7.0.2 Medium Term . . . .
7.0.3 Long Term . . . .
8 Conclusions and Future Work
8.1 Conclusions . . . .
8.2 Future W ork . . . .
8.2.1 Discharge Prediction . . . .
8.2.2 Revisiting Code Help Criteria . . . .
8.2.3 ED Census Prediction . . . . 74 75 83 . . . . 83 . . . . 84 . . . . 85 . . . . 86 . . . . 87 . . . . 89 . . . . 89 . . . . 90 91 . . . . 91 . . . . 91 . . . . 92 . . . . 93 . . . . 94 . . . . 95 97 97 98 98 99 99 101 101 101 101
List of Figures
1-1 MGH ED Visit Volume. ... 18
3-1 Patient Flow through the MGH ED (FY16). . . . . 32
3-2 ED Process Flow Map (as of April 2018). . . . . 34
3-3 Number of Approaching Code Help and Code Help Alarms (FY14-FY17) 39
3-4 Time of day KDE of Congestion Events at the MGH ED . . . . 40
3-5 Cumulative Density Function of Discharges by Time of Day . . . . . 41
3-6 Reaching Code Help Objective Criteria (Code Help Activated vs. Not
Activated) by Time of Day . . . . 42
3-7 Time Until Conversion or Deactivation of Approaching Code Help
Sta-tus in the M GH ED . . . . 43
3-8 Distribution of Time (in hours) Until Activation of Code Help After
Reaching Objective Criteria in the MGH ED . . . . 44
3-9 Conversion to Code Help After Objective Criteria Are Reached in the
MGH ED - Day-of-week view . . . . 45
3-10 FY14-FY16 Average ED Arrival Volume by Day-of-Week . . . . 45
4-1 MGH ED Patient Census Around Congestion Events. . . . . 52
4-2 MGH ED Patient Census Around Congestion Events (Excluding
Fast-Track and Evaluation). . . . . 54
4-3 MGH ED Patient Census in Acute and Urgent Pods Around
Conges-tion Events . . . . 56
4-4 MGH ED Patient Discharges Around Congestion Events . . . . 58
4-6 MGH Boarder Patients Around Congestion Events . . . . 62
4-7 MGH Medicine Boarders Around Congestion Events . . . . 64
4-8 MGH Average Wait Time of Boarders Around Congestion Events . . 66
4-9 MGH Average Wait Time of Medicine Boarders Around Congestion Events .. . .. .. .. . . . .... . ... .. . . . . 68
4-10 Elbow Method to Determine Optimal Number of Clusters . . . . 73
4-11 Clustering of ED Arrivals vs. Bed Operational Capacity Utilization of Medicine Beds in the Hour Leading Up to Code Help Events at the MGHED ... ... 73
4-12 Code Help Dashboard - Example 1 . . . . 79
4-13 Code Help Dashboard - Example 2 . . . . 80
4-14 Code Help Dashboard - Example 3 . . . . 81
5-1 Distribution of Time Between Discharge Summary and Patient Dis-charge by Floor. . . . . 85
5-2 Distribution of Time Between Discharge Orders and Patient Discharge by F loor. . . . . 86
5-3 Scatter Plot of Discharge Order Lead Time vs. Pharmacy Order Lead T im e . . . . 87
5-4 MSE of Definite Discharge Flag vs. MSE of Discharge Orders for a Lead Time of 1 Hour, 2 Hours, and 3 Hours . . . . 88
List of Tables
3.1 Timeline of Data Analysis . . . .
3.2 Emergency Department Status Description . . . . . 4.1 List of Descriptive Features Relevant to Code Help 4.2 Cluster Centers . . . . 4.3 Congestion Dashboard Feature Description . . . . . 4.3 Congestion Dashboard Feature Description . . . . .
4.3 Congestion Dashboard Feature Description . . . . .
4.3 Congestion Dashboard Feature Description . . . . .
5.1 Comparison Between Lead Time of Discharge
O rders . . . .
Orders and Pharmacy 87 Modeling Performance Measures for LASSO Model .
Regularization Parameter for LASSO Model . . . . . Regressor Means and Significance for LASSO Model Modeling Performance Measures for Ridge Model . Regularization Parameter for Ridge Model . . . . Regressor Means and Significance for Ridge Model . .
. . . . 94 . . . . 94 . . . . 94 . . . . 95 . . . . 95 . . . . 95 31 47 50 74 75 76 77 78 6.1 6.2 6.3 6.4 6.5 6.6
Chapter 1
Introduction
This project aims to objectively characterize congestion events known as Code Help at the Massachusetts General Hospital Emergency Department using operational data features, predict them in advance, and recommend effective mitigation measures to them. The project has been conducted by the MGH-MIT collaboration under the guidance of the MGH Capacity Task Force. Background information on these orga-nizations is provided in the following sub-sections.
1.1
Massachusetts General Hospital
Massachusetts General Hospital (MGH), founded in 1811, is a teaching hospital for Harvard Medical School, and almost all its physicians are on the medical school faculty [1]. It is a 1,305-bed medical center that offers cutting edge diagnostic and therapeutic care across a plethora of specialties and subspecialties of medicine and surgery. The hospital also holds concurrent Level 1 verification for adult and pediatric trauma and burn care [2]. Massachusetts General Hospital has been ranked among the top five hospital in the United States by U.S. News & World Report since the rankings began [3] and was recognized by The Leapfrog Group for quality and safety with an "A" grade in 2018 [2]. As the top ranked hospital in Massachusetts [3], MGH sees approximately 50,000 inpatient visits, 110,000 emergency room visits, and 1.5 million outpatient visits every year [4]. Massachusetts General Hospital and Brigham and Women's
Hospital founded Partners Healthcare in 1994. Today, Partners consists of primary care and specialty physicians, community hospitals, a managed care organization, specialty facilities, community health centers, and other health-related entities, in addition to the two founding academic medical centers. Together these providers
offer a continuum of coordinated, high-quality care
[5].
1.2
The MIT-MGH Collaboration
The MIT-MGH Collaboration is a longstanding research partnership between Mas-sachusetts General Hospital and the Sloan School of Management at the MasMas-sachusetts Institute of Technology, focusing on advancing the operational effectiveness of the hospital using Operations Research tools. The MIT-MGH team comprises MIT fac-ulty, MGH leadership, students from the Operations Research Center and Leader for Global Operations (LGO) Program, and graduate and undergraduate MIT students from other programs.The research presented in this thesis has been conducted under this Collaboration.
1.3
The Capacity Task Force
In order to combat heightening capacity problems, MGH launched the Capacity Task Force in January of 2016: a team of hospital administrators, providers, data analysts, and members of the MGH-MIT Collaboration joining forces to identify solutions to immediate and longer term capacity challenges. The task force was divided into
three subgroups - the first focusing on avoidable ED and inpatient care, the second
on preventable readmissions, and the third on delays related to patient placement and bed allocation [6]. The project described in this document resides within the first work
group - Capacity Task Force 1 - facilitated by the Executive Director of Emergency
Services and Emergency Preparedness, Mr. Robert Seger. Capacity Task Force 1 held weekly meetings, hosting providers and administrators from other departments such as Perioperative Services and Healthcare Systems Engineering, Admitting, General
Medicine, Surgery, and Billing to get their view on the capacity problem tackled in this document.
1.4
Project Motivation
1.4.1
Emergency Department Visit Volume
Massachusetts General Hospital is a Level I Trauma Center, a Level I Pediatric Trauma Center, and a Level I Burn Center. Since the day it was founded, MGH has been serving patients requiring emergency care. The Emergency Department at Massachusetts General Hospital comprises seven care areas: Acute, Urgent, Fast-Track, Evaluation, Clinical Decision Unit (CDU), Pediatrics, and Acute Psychiatric Service (APS). Patients are triaged by the greeter nurse into one of the areas accord-ing to the type and level of care that they require based the symptoms they present to the ED with. As of the time of writing of this thesis, the MGH ED had a total
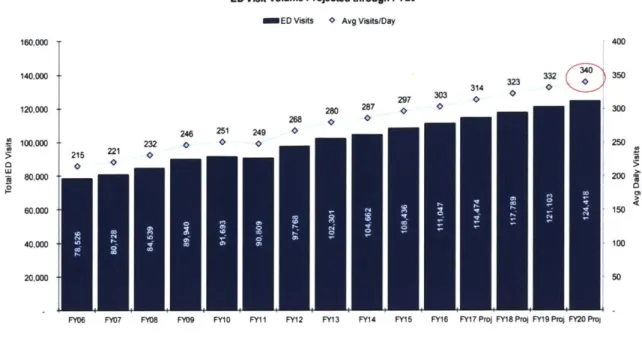
of 66 beds, out of which 46 are monitored beds' [7]. As is shown in Figure 1-1, the
number of visits to the MGH ED has been climbing over the past decade, from an
average of 215 visits per day in FY062 to a staggering 303 visits per day in FY16.
The MGH ED is expected to start seeing an average of 340 visits per day in FY20.
'Bedside monitors keep track of different vital signs, helping ED providers quickly identify changes and complication in a patient's condition
2
ED Visit Volume Projected through FY20
SED Visits * Avg Visits/Day
314 280 287
28 246 251 249
232 O
FY06 FY07 FY08 FY09 FY10
r 400 323 32 332 4 350 i300 250 160,000 140,000 120,000 100,000 80.000 60.000 50
FY11 FY12 FY13 FY14 FY15 FY16 FYI7 Proj FY18 Proj FY19 Pro FY20 Pro,
Figure 1-1: MGH ED Visit Volume.
1.4.2
The Emergency
Act (EMTALA)
Medical Treatment and Active Labor
EMTALA is a federal statute that was enacted by Congress in 1986, requiring hospi-tals to screen, stabilize, and treat all patients seeking care regardless of their ability to pay or their insurance status. EMTALA applies to facilities that accept Medicare or Medicare reimbursements from the US government, which means that all hospitals
in the United States - excluding hospitals operated by the military or Shriners
In-ternational - have an obligation to comply with it [6]. Since Massachusetts General
Hospital is a participating hospital, the MGH ED is not allowed to turn away any patient without treatment, regardless of the condition they present with.
1.4.3
Banning Ambulance Diversion
Ambulance diversion is the practice of temporarily closing a facility, typically an emergency department, to incoming ambulances. This practice has been used since the 1990s to relieve emergency department overcrowding. On January 1, 2009,
Mas-200= 150 100 5 D w I 0 I-40,000 20,000
sachusetts successfully banned this practice except in cases in cases of internal hospital disasters that render the emergency department unusable. One predicted consequence of prohibiting ambulance diversion was severe crowding of overwhelmed emergency departments forced to accept all those who sought care, as mandated by EMTALA [8].
1.4.4
The Code Help Capacity Protocol
As a result of the banning of ambulance diversion, and in an effort to mitigate ED crowding in hospitals across the state, the Massachusetts Department of Public Health (DPH) requested that all hospitals submit a Code Help plan: a policy that would be enacted to move all admitted patients out of the ED within 30 minutes when its licensed capacity is reached or exceeded. This policy is to be activated when the ED is no longer able to care for its existing patient population or accept new patients into a licensed treatment space. The Code Help policy is required to state the chain of command for activation when certain trigger thresholds are reached. If Code Help implementation does not relieve the ED from the burden of admitted patients in a defined time (e.g., 1-2 hours), or if the severity of the situation warrants, then the hospital is asked to activate the appropriate disaster plan to create additional inpa-tient capacity[9]. At the MGH ED, the Code Help capacity protocol was designed to relieve congestion as it occurs in the Acute and Urgent care areas that host the most acutely sick patients of the ED population. Approaching Code Help gets ac-tivated automatically when all eighteen Acute beds are full with two hallway slots occupied and all twenty-two Urgent beds are full with one hallway slot occupied; the
response team is paged3. If two more beds become occupied in Urgent and another
two beds receive patients in Acute, the Acute Attending, Resource Nurse, and Charge Coordinator huddle and decide whether or not to call Code Help.
1.4.5
Code Help Implementation Challenges
The implementation of the Code Help protocol at the MGH ED brings with it a number of operational challenges.
First, despite there being specific objective thresholds on patient census in Acute and Urgent, it does not seem that they are followed consistently. For example, on certain occasions, ED decision-makers will decide to activate Code Help even if the objective thresholds are not reached for reasons related to patient safety. On other occasions, they might refrain from activating Code Help because they expect that they will be able to move a certain number of patients out of the ED in a relatively short timeframe, thereby relieving congestion. Based on this, the Code Help definition itself starts to seem narrow, as it relies on census metrics internal to a section of the ED and does not consider the overall state of the hospital in terms of capacity and patient flow. Contextual operational data is not currently available in real-time to
Code Help decision-makers.
Second, Code Help response measures are currently ineffective in relieving con-gestion and almost never achieve their goal of moving admitted patients out of the ED within the required time frame of 30 minutes. Alarms are becoming more fre-quent over the years, generating alarm fatigue and confusion among responders. ED administrators and providers will admit that reasons behind the prevalence and in-tensification of these alarms are unclear.
Finally, it is very difficult to create additional inpatient capacity during Code
Help events when no centralized real-time information exists about inpatients who
are approaching discharge.
More details about the Code Help response protocol can be found in Chapter 3.
1.5
Project Methodology
The principal aim of our work is to address the Code Help implementation challenges directly by providing insight into the drivers behind of Code Help activation and attempting to form an understanding of the mental model of Code Help
decision-makers. To that end, we cluster Code Help events using k-means and generate an objective characterization of their underlying causes.
Moreover, we tackle the challenge of the currently ineffective response to Code Help
by providing a reliable prediction - using ED operational features - of whether or not
Code Help is likely to occur on a specific day at 7 AM in the morning using logistic
regression with L-1 and L-2 regularization. Additionally, we identify early indicators of discharge for inpatients so that those nearing discharge may be accelerated through the process when bed capacity is scarce.
In an effort to reduce unnecessary alarms, we also propose a design for a dashboard to be used during Code Help huddles. This dashboard contains real-time operational features that provide ED staff with information about the broader state of hospital capacity so that they are able to make a more informed decision during the Code Help huddle.
1.6
Main Hypotheses
The main hypotheses that drive this work are:
1. Not all Code Help events are equal - Code Help events might occur for different
reasons and these reasons are identifiable through unsupervised clustering tech-niques used on clinical and operational data. The main drivers of Code Help are a high number of ED arrivals and a busy hospital;
2. There exists enough evidence in the clinical and operational data gathered by
MGH at 7 AM in the morning that would allow the prediction, using supervised
learning techniques, of Code Help incidence at any point on a specific day; and
3. There exists clinical and operational data currently gathered in real-time at MGH that would allow the identification of inpatients that are in the process of being discharged.
1.7
Key Results
The project establishes three main insights. First, that there are three main classes of Code Help:
1. Those that are driven by a surge in upstream patient arrivals into the ED;
2. Those that are driven by a high operational capacity utilization4 of inpatient
beds on Medicine floors5; and
3. Those that are driven by both a surge in upstream patient arrivals and high operational capacity utilization of inpatient beds on Medicine floors
Downstream congestion seems to be a key factor that influences the incidence of Code Help. In fact, 46% of occurrences exhibited a high operational capacity utilization of Medicine beds and a low rate of ED arrivals in the last hour prior to the alarm. Moreover, 42% of all observations recorded both a high operational capacity utilization of Medicine beds and a high rate of ED arrivals in the last hour prior to the alarm. Only 12% of all observations recorded a high rate of ED arrivals and a low bed operational capacity utilization of Medicine beds.
The second insight established is that Code Help events can be predicted with
reasonable accuracy at 7 AM on a given day by examining clinical and operational
data from the hospital. In fact, a logistic regression model with L-2 regularization (Ridge) achieved a median AUROC' of 0.72, and in some permutations of the dataset, reached values of 0.85.
Finally, it was found that patient Discharge Orders allow a median lead time of 1 hour until discharge on Bigelow 11 and a median lead time of 3.5 hours until dis-charge on Ellison 13. For the population of patients that are prescribed Outpatient
4
The ratio of the number of beds that are utilized by a patient to the total number beds that are available for use (i.e. excluding beds that are blocked for maintenance or infection control)
5
MGH Blake 11 Psych; MGH Blake 13 Ob; MGH Ellison 10 Stp Dwn; MGH Ellison 11 Card Int; MGH Ellison 16 Med; MGH Ellison 17 Pedi; MGH Ellison 18 Pedi; MGH Ellison 19 Thor Med; MGH Bigelow 9 RACU Med; MGH Bigelow 9 Med; MGH Bigelow 11 Med; MGH Lunder 7 Neuro; MGH Lunder 8 Neuro; MGH Lunder 9 Oncology; MGH Lunder 10 Oncolo Medicine; MGH White 11 Medicine; MGH Phillips 21 Gyn; MGH White 8 Medicine; MGH White 9 Medicine; MGH Ellison 12 Med.
6
Pharmacy Orders during their stay (17.58% of total patient population), using Out-patient Pharmacy Orders will allow a better lead time than Discharge Orders 29.65% of the time. Further, if MGH were able to bring down the time between the filing of a discharge order and patient discharge on all floors that are currently in the upper 50th percentile to the value of the median, it would be able to free up 0.2% of its total Medicine bed capacity.
1.8
Thesis Organization
Following this introduction, Chapter 2 continues with a literature review summariz-ing research on Emergency Department overcrowdsummariz-ing causes and solutions. Chapter 3 then provides a detailed description of the ED's physical organization and patient flow, as well as supplemental background information. Chapters 4, 5, 6, and 7 sum-marize the methodologies and key findings stemming from the project's analyses of the characterization of Code Help events, the identification of early indicators of discharge, Code Help prediction, and the recommendation of mitigation measures, respectively. Finally, Chapter 8 concludes the thesis with a summary of conclusions and suggestions for future research.
Chapter 2
Literature Review
2.1
Emergency Department (ED) Overcrowding
ED overcrowding arises when there is no capacity left to meet the needs of the next patient requiring emergency care in a timely manner. The problem of ED over-crowding first came to public attention in 1987 and the first statewide conference on overcrowding was held in New York City, involving the New York (NY) chapter of the American College of Emergency Physicians (ACEP), New York Emergency Med-ical Services (EMS), the NY State Department of Health, and state legislators. Since that day, the subject of ED overcrowding has been studied in depth by many research groups around the world. ED congestion causes problems for patients, hospital staff, and providers equally, including longer than usual wait times, increased level of am-bulance diversion, increased length-of-stay, and increased medical errors which could lead to an increased mortality rate among ED patients [10].
2.1.1 Causes of Emergency Department (ED) Overcrowding
Several reasons have been hypothesized to explain ED overcrowding: (i) sub-optimal utilization of ED beds and resources, (ii) competition for inpatient beds between ED population and patients admitted for elective surgery procedures, and (iii) staffing issues and inefficiencies in ED processes[10, 11]. Some have blamed the poor and
under-insured for utilizing excessive ED capacity, however, studies have established that the status of a patient's health insurance does not correlate with the frequency of their ED visits [12]. In fact, a study of all ED visits to Ontario hospitals from April 2003 to March 2003 concluded that there was little evidence of low-acuity
patients affecting wait times or overcrowding in any event
113].
More recently, severalstudies have found that inpatient boarding1 shows a strong relationship with ED
overcrowding [10, 14], indicating that hospital congestion could be the root cause of the problem. Another issue that has been proven to lead to ED congestion, especially
in urban hospitals, is the front-loading of the surgical schedule towards the beginning of the week [15]. Surgery patients that come in early in the week will compete for hospital capacity with ED patients, potentially leading to ED congestion [10]. Lastly, it has been shown that decreased nursing hours have correlated with and increased ED length-of-stay for discharged patients; it follows that insufficient nursing staffing levels in the ED can also lead to overcrowding [11].
2.1.2
Solutions to Emergency Department (ED)
Overcrowd-ing
Numerous studies have considered potential solutions to mitigate the overcrowding problem that are internal to the ED and consist mostly of operational improvements. For example, one study suggested performing patient registration at the bedside rather than in the front of the ED in order to decrease triage-to-room times for patients[16j. A few studies have explored increasing the number of beds in the ED and concluded that this measure is largely ineffective and leads to an increase in the number of boarders [17, 18]. A study from Johns Hopkins suggested that adding a hospitalist that would focus on bed management decreased throughput time for
admissions by 100 minutes, and decreased ambulance diversion2 [191. This hospitalist
would coordinate with ED caretakers, Admitting administrators, and inpatient care
'Boarders are patients who remain in the emergency department after they have been admitted or placed into observation status at the facility, but have not been transferred to an inpatient or observation unit.2
teams in order to streamline patient admission from the ED into an inpatient floor. Placing a provider in triage and flexing ED staffing levels to match patient throughput has also been studiedf20, 211.
Other solutions that have been examined focused on factors external to the ED. First, it has been shown that the smoothing of elective surgeries and early discharge improve boarding in the ED 122]. In the same vein, increasing weekend discharges has been shown to increase capacity as the week begins, thereby decreasing ED congestion [10]. Full capacity protocols have been examined as a solution to the ED overcrowding problem. A first study by Viccellio, et al. concluded that placing patients on inpatient
units in hallways is a safe practice
[23].
In another survey study, Garson, et al.,demonstrated a strong patient preference for being on the inpatient service rather than boarding in the ED [24].
2.1.3
Consequences of Emergency Department (ED)
Overcrowd-ing
Over the past few years, a large volume of research has been conducted on the con-sequences of overcrowding in the ED. These include delayed care for sick patients, increased total length of stay in hospital leading to decreased access, increased walk-out rates, decreased quality of care and increase in medical errors, increased mortality rates, and increase in ambulance diversions. The Commonwealth of Massachusetts' Department of Public Health (DPH) is the first state regulatory body to mandate specific, hospital action plans to reduce ED boarding via its Code Help policy. A number of regulatory and state agencies support efforts to reduce ED boarding by permitting inpatient floor boarding or mandating reporting of ED flow data, but none except for the Massachusetts DPH appear to have mandated specific, hospital action plans with pre-defined triggers [25].
2.2
Previous Work at the MGH ED
Previous work by Hoffmann [6] established that secondary admissions were being re-ferred to MGH while it was not clear that they could not receive a similar level of care at other institutions. A scorecard was developed to assist MGH in understanding the facilities whose patients consume the most hospital capacity on a relative basis. Ma-chine learning models and a scoring method have been developed to identify avoidable admissions. These efforts are central to reducing ED congestion because transfers are growing at a swift pace, increasing arrivals disproportionately relative to other pa-tient populations[6]. Our work determines whether ED congestion is mostly due to a spike in patient arrivals into the ED or if it is a byproduct of high capacity utilization of inpatient beds. Further, we predict ED congestion ahead of time and recommend fit-for-purpose mitigation measures.
Chapter 3
Data Sources, Patient Flow in the ED
Environment, and Code Help
Protocol
This chapter provides a necessary background for the work detailed in this thesis. First, it describes the data sources for the analyses that we conducted and whose details results we will present in later chapters. In addition, it describes the ED environment, focusing on patient flow, in order to give the reader the context and background required to fully understand our analyses. Finally, we thoroughly detail the Code Help policy of the MGH ED and present an analysis on the frequency of occurrence and time distribution of Code Help events.
3.1
Data Sources: Epic and
D4Q
3.1.1
Data Sources
In April of 2016, MGH adopted Epic Systems, an integrated electronic medical record system. Epic is a healthcare software system that tracks patient healthcare episodes, such as outpatient visits, medical history, hospital encounters, and general patient information. It is used across Partners HealthCare, so any visit to a Partners
hospi-tal or outpatient facility is documented electronically. Many of the data elements are updated in real time, and nearly all relevant patient data is electronically stored [261.
ADT tables live in the Epic environment and document patient flow information such
as arrival timestamps, transfer timestamps, and discharge timestamps. Particularly, the Encounter table is used in our work to determine timestamps for patient dis-charges and transfers into another medical facility. This information is central to the analyses that we carried because it allows us to examine patient flow characteristics such as arrival rates or census numbers around Code Help events and contrast it with normal values.
The information in the ADT tables also allow us to calculate the number of utilized beds on Medicine floors and, from that information, infer their operational capacity utilization. Epic's Enterprise Data Warehouse (ED W) allows us access to clinical information such as the discharge timestamp from the PatientEncounterMGH table and the timing of filing of a discharge order or a discharge summary from the
ProcedureMGH table. MedicationMGH and Pharmacy tables allow us to determine
the time of filing of a pharmacy order to an outpatient pharmacy.
D4Q is a database that contains information about the patient experience and
flow for ED patients. In this work, we utilize the PatientEncounter tables from the D4Q database in order to determine arrival and departure timestamps, for each patient encounter, which in turn allows us to determine ED census. From D4Q, we also utilize the EDCareArea table which allows us to determine features like boarding
status1 , arrival time, and departure time, current ED pod that we use to determine
operational features that we can slice and examine by pod. The EDStatus table allows us to determine whether the ED is in ED Open, Approaching Code Help, Code
Help, or Capacity Disaster.
3.1.2
Datasets
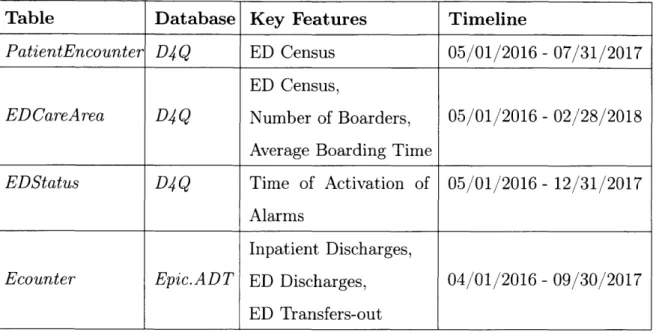
Table 3.1: Timeline of Data Analysis
3.2
Patient Flow
3.2.1
Patient Flow Through the MGH ED
As can be seen from 3-1, the MGH ED treated around 110,000 patient visits in FY16, 24.5% of whom (about 27,000 patients) were later admitted to hospital floors. These 27,000 patient admissions through the MGH ED make up about a substantial 54% of all inpatient admissions that occurred that fiscal year.
Table Database Key Features Timeline
PatientEncounter D4Q ED Census 05/01/2016 - 07/31/2017
ED Census,
EDCareArea D4Q Number of Boarders, 05/01/2016 -02/28/2018
Average Boarding Time
EDStatus D4Q Time of Activation of 05/01/2016 - 12/31/2017
Alarms
Inpatient Discharges,
Ecounter Epic.ADT ED Discharges, 04/01/2016 - 09/30/2017
(23) MGH Inpatient (25K) Floors (2K) Walk-ins (73K) MGH Discharged
_ Emergency (66K) After Receiving
Department Care
(ED) (75K)
Ambulance Obser
(36K) (11K) vation
Without
I~llllllte Being Seen
ig~cotor r eated/
(1K)
Expired
Figure 3-1: Patient Flow through the MGH ED (FY16).
Patients arrive to the ED through multiple modes including walk-ins, ambulance transport, and helicopter transport. About 7% of ED patients leave without being seen or treated, or expire in the ED. Close to 60% of ED patients are discharged directly after receiving care, and 10% are sent to an ED Observation Room where they are monitored overnight and later admitted as inpatients or discharged after receiving care depending on the progression of their symptoms and care path.
3.2.2
Patient Flow Within the MGH ED
In general, patients arriving to the ED are routed through two initial steps: (i) Reception, and (ii) Triage. During Triage, it is determined to which of the seven department's treatment areas they should proceed: (i) Acute; (ii) Urgent; (iii) Fast Track; (iv) the Clinical Decision Unit (CDU); (v) the Acute Psychiatric Service (APS);
(vi) the Pediatric Emergency Department (PED); and (vii) Evaluation. In some
cases, patients requiring immediate medical attention bypass these steps altogether, but everyone who ultimately proceeds to a treatment area is assigned based on the
type or severity of their condition. Figure 3-2 describes the flow of patients within the department [6].
The reception area is reserved for walk-ins since patients entering via ambulance and helicopters have their own reserved entryways. When a patient walks in, they are met by a clinical greeter, or Greeter Nurse, who upon examining them, will guide them to a treatment, screening, or waiting room. Five screening bays located next to the ED's reception area serve as the ED's triage zone. Triage is a brief examination during which a patient's vitals are measured and a chief complaint is determined. Ambulance and helicopter crews can conduct triage via radio. Other than patients who require medical attention, all patients will proceed from Triage to waiting in the Pre-Eval area outside Evaluation that includes nine evaluation rooms. The Eval team will conduct a thorough examination of the patient, who can be either directed to one of the six other treatment areas in the ED, treated and released to return home, or sent to an external medical facility in some situations. The Acute area is reserved for the care of the ED's most seriously ill or injured patients, where providers work on stabilizing patients and admitting them to the most appropriate inpatient service within MGH. Patients who are severely ill but are not in immediate danger of loss of life or limb are usually sent to the Urgent section. Example of Urgent cases include abdominal pain, neurological complaints, and difficulty breathing. Advanced diagnostic testing may be conducted in the Urgent area and, depending on the causes of the chief complaint, patients may be discharged home or to a facility or admitted into one of MGH's inpatient services. Patients who may benefit from additional diagnostic evaluation or monitoring are sent to the Clinical Decision Unit (CDU). Examples of typical symptoms and conditions that are likely to send the patient to the CDU are: atrial fibrillation, congestive heart failure, back pain, dehydration, gastroenteritis, and trauma. Half of the CDU patients are released from the hospital after treatment and further diagnosis, and the other half are either sent to an ED Observation unit or to the relevant MGH inpatient service. Patients with minor, non life-threatening injuries are routed to Fast-Track and usually discharged within 60 to 90 minutes of seeing a provider. Patients under the age of 19 are usually sent
to the Pediatric Emergency Department (PED), and those with acute psychiatric, neuropsychiatric, and conditions related to substance-use are treated in the Acute Psychiatry Service (APS) [6].
Boarder Patients
For patients requiring admission to the hospital, if no inpatient bed opens within two hours of an ED provider's decision to admit, the patient will continue to 'board' in the ED until one becomes available (these individuals are aptly labeled boarder patients, or simply boarders for short)[6]. Under some circumstances, doctors from the Medicine Department's boarder service will take responsibility for the patient's care while they are still waiting in the ED. In such cases, the patient is labeled a covered boarder[6].
r Arrival Modes -Walk-In
I Greeter Nurse Patients get * ED wafting * Patents get
deterrmines registered In area triaged to the ED
whether the EPIC pod appropriate
patients need system for their condition
to immediately go to Acute or I go through the normal process Amuane .Registon and
Triage ore lumped
into a single step for
patients arriving by
IHIC pte Ambiance /
Helicopter
L---A*
Pra- * Patients requiring * Patients requiring
Evalhatlon thorough Ibs, tests,
X-screening my$, Od frher
dagnostic
workup; also, section 12 * Patients requiring
ICU level of cre
* Patents requiring * Patients requiring
inaient level of psychiatric care
* Patients who are under 20 years of age
* Patients with less Pa"Nr may
acute diagnoses be*bd
sugclisues) F
Figure 3-2: ED Process Flow Map (as of April 2018).
-NONE
3.3
Code
Help at the MGH Emergency Department
The Commonwealth of Massachusetts has established a Code Help policy that is man-dated by the Massachusetts Department of Public Health (DPH). This policy requires hospitals to address ED overcrowding and move all admitted patients boarding in the ED to the appropriate inpatient floor within 30 minutes of activation of the Code
Help status. Code Help status is reached when licensed capacity is reached and/or
exceeded. Currently at MGH, the ED is responsible for triggering a Code Help alert hospital-wide based on predefined criteria [27]. The congestion status of the ED is tracked in the Epic Electronic Medical Record (EMR) system and can be:
1. ED Open (Green): indicates normal operating procedures in the ED.
2. Approaching Code Help (Yellow): indicates that the ED is becoming congested and that Code Help is likely to be activated in the coming few hours.
3. Code Help (Red): indicates that the ED's licensed capacity is reached and/or
exceeded as per the DPH's directive.
4. Capacity Disaster: indicates a state of emergency in the ED that renders it un-usable. Capacity Disaster is usually activated when Code Help fails in relieving congestion and the situation becomes unsafe for patients.
Further information on the formal definitions of congestion statuses can be found in Table 3.2.
When Approaching Code Help, Code Help, or Capacity Disaster levels are reached, the staff notifies ED leaders and other affiliated departments and personnel across the
hospital2. MGH has determined several operational responses to congestion
depend-ing on its level [27]. 2
3.3.1
Standard Operating Procedures
Currently, the ED holds five daily inpatient capacity meetings focusing on ED and ED Observation Unit (EDOU) patient discharges:
1. A daily Inpatient Capacity Team meeting at 10:00 AM;
2. A daily Boarder meetings between Medicine and the ED at 7:30 AM; and 3. A daily Clinical Assessment meetings with Nursing Supervisors, Admitting, and
ED Resource Nurse at 8:00 AM, 12:00 PM, and 4:00 PM.
Throughout their shifts, ED clinicians round in each area of the ED to clinically assess patients waiting for dismissal to expedite discharge or admission and a Boarder Resource Nurse communicates with hospital floors regarding the transfer of boarder patients to the appropriate inpatient unit. Clinicians will only send patients with ready beds to inpatient units after receiving handoff. As soon as handoff occurs, the ED coordinator places patients on the transport board and notifies the ED Through-put Nurse. Charge Coordinators check transport status and as appropriate, patients are switched from stretchers to wheelchairs to facilitate transport. It is the Charge Coordinator's responsibility to ensure that discharges are entered in Epic and alert
Environmental Services should there be a delay in bed
/
bay cleaning.3.3.2
Approaching Code Help
When all 18 Acute beds become full with 2 hallway slots occupied and all 22 Urgent become full with 1 hallway slot occupied, Approaching Code Help status is automati-cally activated and the hospital-wide response team receives a page. According to the
Code Help protocol, a communication huddle should occur between, as a minimum,
the ED Acute Attending Physician, the ED Resource Nurse, and the ED Charge Co-ordinator; they consult with the nursing supervisor. This, however, rarely happens as these alarms have become very frequent. As a response to the alarm, ED doctors and nurses round to move patients out of Acute and all other clinical care areas of
the ED. The ED Access Nurse stops transfers from outside hospitals to the ED and requests direct admission to inpatient floor.
3.3.3
Code Help
When all 18 Acute beds become full with 4 hallway slots occupied and all 22 Urgent become full with 3 hallway slot occupied, a communication huddle occurs between, as a minimum, the ED Acute Attending Physician, the ED Resource Nurse, and the ED Charge Coordinator; they consult with nursing supervisor. During this huddle, it is decided whether or not Code Help status should be activated. According to ED providers and administrators, Code Help is activated if the situation in the ED is deemed unsafe, either because Urgent and Acute care areas are too congested or because the patient population is exceedingly sick. According to the Code Help protocol, ED clinicians need to assess the Acute area patients to find any patients who are medically safe to move. If they find no movers, Code Help is activated and a page is sent out to the response team. If there are movers, ED clinicians ask themselves the following questions:
" Does the ED have the manpower/ staffing to safely treat the patients? " Can the ED safely take another critical patient?
" Is the environment
/facility/equipment
(availability of monitors) safe to treat and continue to accept patients? (e.g., flood or other compromise)If any ED Attending, nurse, or admin team responds no to these safety questions,
Code Help status should be activated and a page should be sent out to the response
team.
When Code Help is activated, the ED Access Nurse stops transfers from outside hospitals to the ED and requests direct admission to inpatient floor. Direct admits to inpatient units and hospital-to-hospital transfers are evaluated by the Inpatient Access Center. Within 15 minutes of Code Help activation, Admitting and the ED staff review cases to be admitted and meet to address capacity issues; the Administrator
on Call (AOC) is included. The ED staff prepares to move boarders to inpatient units: they add Transport Assistants and request help from MGH Central Transport and Volunteer Service if necessary. The ED staff also consults Case Management to place patients directly from ED to other hospital EDs or other alternative pathways such as home hospital.
3.3.4
Capacity Disaster
According to the Code Help protocol, Capacity Disaster should be activated if board-ers remain in the ED 2 hours after Code Help is paged out or if the ED is overwhelmed beyond resources available for safe patient care. However, ED decision-makers will mostly hold off on activating Capacity Disaster even if boarders remain in the ED 2 hours after Code Help as long as they deem the situation to be under control. Sim-ilar to the Code Help decision, a communication huddle takes place between, as a minimum, the ED Acute Attending Physician, the ED Resource Nurse, and the ED Charge Coordinator; they consult with the nursing supervisor.
When Capacity Disaster is activated, it gets paged out to the response team. All interventions previously identified for Code Help are continued and a 7 AM meeting occurs the next day if Capacity Disaster alert is sent after 5 PM.
All records of Emergency Department Status are tracked within Epic. The
Emer-gency and Admitting departments deactivate Code Help
/
Capacity Disaster statuswhen all inpatient boarders are placed and send a page indicating that Code Help
/
Capacity Disaster has expired. As soon as possible after the capacity status hasbeen deactivated, a debriefing session is conducted to evaluate the response. This discussion can happen during the daily Capacity Committee meeting.
3.4
Current State of Code Help
3.4.1
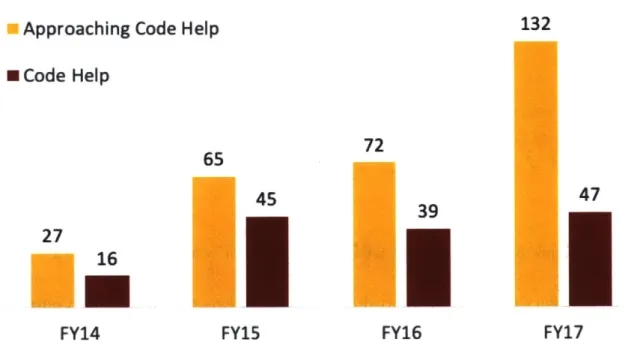
Frequency of Code Help Alarms
As is shown in 3-3, the number of Approaching Code Help alarms has been rising steadily over the last four years, while the frequency of Code Help alarms increasing at a slower pace. Since Approaching Code Help alarms are activated automatically when objective census criteria are reached, their increase at this pace indicates a stark increase in ED congestion over the last few years. The fact that the rate of conversion of Approaching Code Help alarms to Code Help is decreasing, however, suggests that the ED is becoming more strict in deciding when to activate Code Help.
a Approaching Code Help 132
0 Code Help
U
65 45 72 47 39 27 16FY14 FY15 FY16 FY17
Figure 3-3: Number of Approaching Code Help and Code Help Alarms (FY14-FY17)
3.4.2
Time Distribution of Capacity Alarms
Experience suggests that capacity alarms cluster close to the middle of the day. In order to verify this, we extract the hour of occurrence of all Approaching Code
Help, Code Help, and Capacity Disaster events from the EDStatus table in the D4Q
to Code Help and those that do not. We also split the Code Help events into those that get converted from Approaching Code Help and those that get called from ED
Open status. We employ the Pandas Kernel Density Estimation function to estimate
the Probability Density Function of the distribution of times of incidence of these alarms assuming Gaussian kernels. We examine all alarms that occurred between 05/01/2016 and 02/28/2018.
Kernel Density Estimation of Incidence of Capacity Events at the MGH ED
- ApproahftCef Hdp- au 0.175- - - ACoft~C~ W~fCf Hd- M-N d iwPB 0.150 -0.125 - 0.100-0.075 -0.050 -0.025 -0.000 4 o 0 00 1 OW OW Oft 0 % %!l ^IVV % % % % ~
'' Time of Activation of ED Status
Figure 3-4: Time of day KDE of Congestion Events at the MGH ED
Approaching Code Help - Converted (N=79); Approaching Code Help - Not Converted
(N=161); Code Help (N=94); Capacity Disaster (N=7).
Figure 3-4 suggests that Approaching Code Help events that end up converting to
Code Help generally occur earlier in the day than those that get extinguished without
converting, with a PDE estimate that peaks at 12:00 PM for the former type of alarm and 2:00 PM for the latter. The later an Approaching Code Help alarm is triggered, the more likely it is that afternoon inpatient discharges might have started to pick up their pace (see Figure 3-5), and the less likely it is to eventually convert to Code
Cumulative Density of Discharges by Time of Day 100% Mdicine 95% Surgery 90% 85%-80% 75% 70% 65% 60% 55%- 50%-0. 45% 0 40%-: 35%- 30%-25% 20%- 15%- 10%- 5%-0%- . 0 2 3 4 5 6 7 8 9 10 11 12 13 14 15 16 17 18 19 20 21 22 23 Hour of Day
Figure 3-5: Cumulative Density Function of Discharges by Time of Day
3.4.3
Alarm Conversion
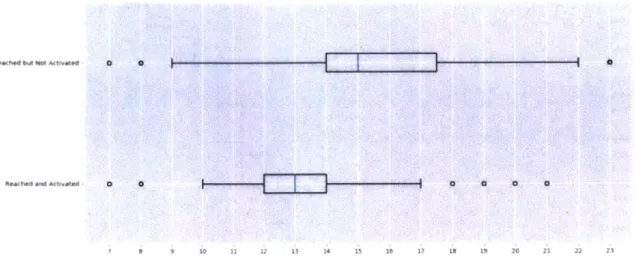
Further, we examine the number of times Code Help Objective Criteria3 were reached,
leveraging data from the EDStatus that sits in the D4Q database between 05/01/2016 and 12/31/2017. We split the distributions according to whether Approaching Code
Help was later called or ED Open status was restored.
3Acute beds are full (18) with 4 hallway slots occupied and Urgent is full (22) with 3 hallway slots occupied.
Time of Day Distribution of Observations where Objective Code Help Parameters Are Reached
w ;
x, *,
Reache and Mbvea..d - 0 0 |--- 0 0 0 0
7 U 9 3 11 12 13 IA 11 18 17 is 19 20 ;1 2,2 23
Figure 3-6: Reaching Code Help Objective Criteria (Code Help Activated vs. Not Activated) by Time of Day
Code Help Objective Criteria Reached and Converted (N=67); Code Help Objective
Criteria Reached and not Converted (N=200)
Figure 3-6 paints a similar picture to Figure 3-4, suggesting that of the times Code
Help Objective Criteria were reached, conversions occurred more frequently earlier in
the day rather than later.
Time Unti Conversion or Deactlvation of Approaching Code Help Status in the MGH ED 25-24 - 23- 22- 21-c 20- 219- _18-t 17-A' 16- k15-C 14-0 13- 9- E7- S6- 4- 3- 2- 1-0~ OX X X XX - x x xK x Kx x x x x xX K x x x x x SN X 1K x X** Ws x 0 0 x )W de e ^0 a ft, ~ Time of Activation of ED Status
x x N xK* x x K K x XX K XX K * K x *xx 0 x x K x 5X Pg 4,. 0 %' .V Figure 3-7: Time in the MGH ED
Until Conversion or Deactivation of Approaching Code Help Status
Approaching Code Help - Converted (N=79); Approaching Code Help - Not Converted
(N=161)
In Figure 3-7, we plot the time of activation of Approaching Code Help versus the time in hours until the alarm got converted or deactivated without conversion. The figure suggests that 89% of Approaching Code Help alarms that end up converting to
Code Help do so within three hours of their activation, with the rate of conversion
becoming minimal after 3:00 PM.
In Figure 3-8, we plot a frequency histogram of the distribution of time (in hours) between reaching Code Help Objective Criteria and the activation of Code Help status in the ED, considering all occurrences between 05/01/2016 and 12/31/2017. We pull this data from the EDStatus table in the D4Q database. We observe that 10% of the time, Code Help is called before Objective Criteria are reached. Also, 52% of the
time, Code Help is called within an hour of Objective Criteria being reached.
N N K x x 0 r,- Alarm x DmuwVfdAhfU