HAL Id: hal-02882938
https://hal.archives-ouvertes.fr/hal-02882938
Submitted on 28 Jun 2020
HAL is a multi-disciplinary open access
archive for the deposit and dissemination of
sci-entific research documents, whether they are
pub-lished or not. The documents may come from
teaching and research institutions in France or
abroad, or from public or private research centers.
L’archive ouverte pluridisciplinaire HAL, est
destinée au dépôt et à la diffusion de documents
scientifiques de niveau recherche, publiés ou non,
émanant des établissements d’enseignement et de
recherche français ou étrangers, des laboratoires
publics ou privés.
Automatic Photoreceptor Detection in In-Vivo Adaptive
Optics Retinal Images: Statistical Validation
Kevin Loquin, Isabelle Bloch, Kiyoko Nakashima, Florence Rossant,
Pierre-Yves Boëlle, Michel Paques
To cite this version:
Kevin Loquin, Isabelle Bloch, Kiyoko Nakashima, Florence Rossant, Pierre-Yves Boëlle, et al..
Au-tomatic Photoreceptor Detection in In-Vivo Adaptive Optics Retinal Images: Statistical Validation.
ICIAR, Jun 2012, Aveiro, Portugal. �10.1007/978-3-642-31298-4_48�. �hal-02882938�
Adaptive Optics Retinal Images: Statistical
Validation
Kevin Loquin1? Isabelle Bloch1 Kiyoko Nakashima2 Florence Rossant3 Pierre-Yves Boelle4 Michel Paques2
1
Institut Telecom - Telecom ParisTech - CNRS LTCI - Paris, France 2CIC 503 of the XV-XX Hospital DHOS/INSERM - Paris, France
3
ISEP - Paris, France
4Hˆopital Saint-Antoine - Paris, France
[email protected],[email protected] [email protected],[email protected]
[email protected],[email protected]
Abstract. This article presents a photoreceptor detection algorithm ap-plied to in-vivo Adaptive Optics (AO) images of the retina obtained from an advanced ophthalmic diagnosis device. Our algorithm is based on a recursive construction of thresholded connected components when the seeds of the recursions are the regional maxima of the deconvoluted im-age. This algorithm is validated on a gold standard dataset obtained thanks to manual cones detections made by ophtalmologist physicians.
Keywords: Adaptive Optics, Photoreceptor detection, in vivo diagnosis, retina imaging
1
Introduction
Adaptive Optics (AO) is a new ophtalmic imaging system inherited from spec-tacular technological advances in astronomy [7]. An AO system is made up of a deformable mirror which compensates (it can be viewed as some kind of physical deconvolution) for the image defects due to atmospheric distortions. The imag-ing of the retina with an AO system [8] is particularly interestimag-ing because the light distortions due to the iris, pupil and lens system of the eye are similar to the distortions due to atmosphere.
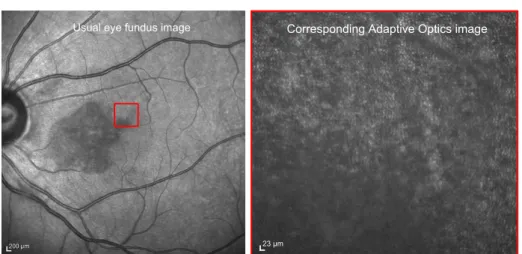
The AO imaging modality technically outperforms any other up-to-date reti-nal imaging modality. It allows the imaging of the living human retina at the microscopic scale. For instance, the rtx1 AO system has a resolution of 0.8µm per pixel, while usual fundus cameras reach resolutions from 6 to 10 µm per pixel. This feature is illustrated in Figure 1.
?
This work has been supported by French National Research Agency (ANR) through Tecsan Program (project iPhot no ANR-09-TECS-009). K. Loquin is currently re-searcher at LITIS, Rouen and LIRMM, Montpellier, France
2 K. Loquin, I. Bloch, K. Nakashima, F. Rossant, P.-Y. Boelle and M. Paques
Usual eye fundus image
23 μm
Corresponding Adaptive Optics image
Fig. 1. Usual eye fundus image vs. Adaptive Optics image of the retina on a patholog-ical eye
This new imaging modality is of prime importance for a clinical use in rou-tine. At a microscopic level, the retina is a stack of several neuronal layers whose aim is to transform the incident light in an electrical signal that will be trans-mitted to the brain [2]. Within this process, the photosensitive neurons are the photoreceptor cells (rods and cones). Many inherited and acquired diseases or disorders provoke degeneration of the retina [9, 3], a progressive loss of the cones cells. It leads to severe visual handicap. In some diseases such as retinitis pig-mentosa, visual loss can occur very early in life. In [11], the authors illustrate the diagnosis power of retinal AO images on degenerative cones distrophy by com-paring visual diagnosis procedures from these AO images (like cone counting, manual delineation of degenerated area,...) with well managed usual diagnosis procedures performed with other modalities.
The algorithm that we present in this article is an extension of an algorithm already proposed by the authors [5]. This algorithm is based on a recursive construction of thresholded connected components whose seeds are the regional maxima of the image. The stopping rules of this recursive construction are de-duced from geometrical arguments: preference is given to brighter spots for closed merged spots which are thus considered as noisy spots. In this present article we propose to use an additional preliminary deconvolution step. The deconvolution of AO images has been proved to be particularly useful [1]: it considerably fa-cilitates the distinction between background and information (cones) on retinal AO images.
Rare other automatic photoreceptors detection algorithms have already been proposed in the literature [4, 12]. Both are based on the detection of regional maxima; in [4], the image is pre-filtered and post morphologically processed and in [12], the regional maxima are processed in a decreasing intensity order to
discriminate the dimest ones. In this present article, we propose a validation of our algorithm by comparing it with the ones presented in [4, 12].
In Section 2, we present our photoreceptor detection algorithm. Then, Section 3 details the performed experiments to validate our tool, before concluding.
2
Photoreceptor detection algorithm
2.1 Previous version [5]
In the used AO images, the photoreceptors that we aim at detecting are bright spots, i.e. pixels with high grey levels. Hence a first natural step of our algorithm is a simple regional maxima detection. Afterwards, a maximum area of a regional maximum is defined up to a tolerance parameter, denoted by T . This tolerance parameter finds its roots in the component tree decomposition of an image [6]. In this scope, an image is seen as a decomposition of α-level connected components. The level range corresponding to the greyscale range of the image, an image is decomposed in a stack of connected components. The tolerance parameter T that we are using in our algorithm tunes the height of the top part of this stack that we consider as a maximum area.
Note that the proposed algorithm is a truncated adaptation of the watershed by immersion algorithm [10] when applied to the inverted image. In the inverted image, the origins of the basins used in the watershed by immersion are the regional maxima of the original image. In our case, we are not interested in reaching a complete separation of the basins (the maxima) but only in elicitating these basins until a given height, i.e. the maximum areas up to a tolerance parameter.
2.2 What’s new?
Even for adaptive optics which is physically corrected by means of deformable mirrors, an acquisition necessarily transforms the real information into an al-tered one: a measurement. The relationship between the physical reality and its measurement is supposed to be linear, which leads to model any acquisition by a convolution operator. Deconvolution of a signal is, in some sense, reversing the acquisition process to reach as closely as possible the physical reality. With AO retinal images, the results of the deconvolution are particularly interesting. In [1], the authors propose to learn the parameters of the deconvolution kernel, i.e. the point spread function (PSF) of the sensor model, from the entire image: this is called blind deconvolution. Their results are impressive but their algorithm is too much time consuming in a clinical context. In our case, we propose a simpler approach, less computationally demanding: we use a simple Gaussian convolu-tion model of the PSF with a unique parameter: σ, its standard deviaconvolu-tion.
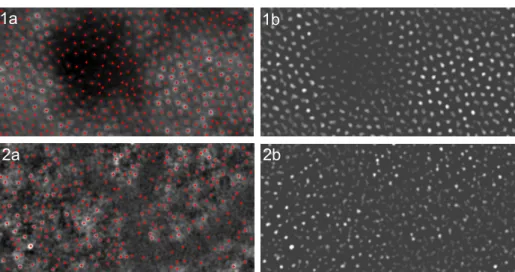
Figure 2 illustrates the interest of this technique. The right column shows (for illustration) the obtained deconvoluted images from the left column images. On the left column we can also observe the results of our method for the following
4 K. Loquin, I. Bloch, K. Nakashima, F. Rossant, P.-Y. Boelle and M. Paques
1a
1b
2a
2b
Fig. 2. Illustration of the deconvolution interest. 1a and 2a: results of our new algorithm on the original images 1 and 2. 1b and 2b: deconvolution results of images 1 and 2
parameters: σ = 5; T = 10 for the first row and σ = 6; T = 25 for the second row. The results seem to be as good as with the blind deconvolution method. However, we add a new parameter to our method, which makes the physician task more complex. In this illustration, the parameters are chosen to reach the best possible results in a subjective judgment.
2.3 Algorithm implementation: an interactive tool for the physicians
This algorithm is very rapid: after a complete cover of the image for finding the regional maxima, the recursive coverage is only applied to these extracted spots which highly diminishes the computational cost. When java-implemented as an imageJ plugin (which is not the most rapid computational framework) the algorithm result is quite instantly displayable. This remark is very important because it allows us to provide an interactive tool to the final user, the physician. This non algorithmic part of our work is greatly appreciated by the physicians who can thus easily interact with the algorithm and adapt its parameters to his visual expertise in an intuitive way. This feature highly contributes to the fact that, even if still in development, this tool is already in use in a clinical context. Another way to interact on the photoreceptors detection is to incorporate in our imageJ plugin the possibility to add non automatically detected cones and to remove wrongly detected cones manually.
3
Validation
3.1 Material and methods
The AO images used along this validation procedure are obtained with two prototypic systems: INOVEO and rtx1 manufactured by Imagine Eyes1, Orsay,
France. Those systems are currently operational in clinical and research settings at the Clinical Investigation Center 503 of the XV -XX hospital. According to the used system (INOVEO and rtx1), in each image, for an axial length of 24.7mm, one pixel corresponds respectively to a 1.2µm × 1.2µm and 0.8µm × 0.8µm spot on the retina.
The gold standard dataset is constructed from 52 patch images of 13 bigger AO images. Thus, for each of the 13 images, 4 patch images were extracted. The patch image sizes were chosen so that each patch contains between 50 and 200 cones. Those 52 images were presented in a random order to two ophtalmogist physicians of XV-XX hospital (Kiyoko Nakashima and Michel Paques). They marked the cones on these images thanks to a developped imageJ plugin which enabled us to recover the supposedly true cone positions. The comparisons of the method results with the gold standard were based on (i) the sensibility (Se) index which is the percentage of identifed cones by the algorithm which are well inside the gold standard dataset (Se ∈ [0, 1]) and (ii) the false positive rate (FPR) index which is the ratio of the number of identifed cones by the algorithm which are not inside the gold standard dataset (number of false positives) over the number of cones in the gold standard (F P R > 0 and unbounded). In our procedure, we compared two detection positions (manual and automatic detections) with a tolerance of 3 pixels (it corresponds to the minimal cone diameter 2µm).
For each of the 13 selected images, among their 4 patches, 2 were exactly the same ones. We consider that the less important is the difference (computed in terms of sensibility and false positive rate) between the manual detections ob-tained with these two same patches, the better is the quality of the image. Table 1 presents the images by increasing quality according to this simple criterion.
Worst image Best image
im01 im02 im03 im04 im05 im06 im07 im08 im09 im10 im11 im12 im13
10 25 2 17 42 20 32 28 21 23 24 27 51
3 5 16 1 18 13 52 34 26 37 4 31 8
48 44 14 9 33 46 29 11 15 30 47 43 6
49 7 40 35 22 45 36 41 39 12 19 38 50
Table 1. Increasing quality image ordering
Not only we proposed to compare our algorithm with this gold standard but we also proposed to compare it with two other existing algorithms. In [4], the
1
6 K. Loquin, I. Bloch, K. Nakashima, F. Rossant, P.-Y. Boelle and M. Paques
authors proposed a multi-step algorithm. First, they propose to work with an above-threshold version of the image in order to eliminate the dim spots. Af-terwards, the regional maxima are detected from a low-pass filtered version of the thresholded image in order to eliminate the noise. Finally, a morphological dilation is used to merge close enough detected spots. The structuring element is chosen according to the minimal cone spacing. In [12], the same kind of proce-dure is presented but the regional maxima detection is performed by decreasing greylevel regions in order to favor the brightest detected spots and avoid the threshold step of the method in [4].
3.2 Results 0 10 20 30 40 50 60 −0.2 0 0.2 0.4 0.6 0.8 1 1.2
Loquin et al. with déconvolution Loquin et al. 2011
Li et Roorda 2007
Xue et al. 2007
Maximum of ( Sensibility - FPR )
images
Fig. 3. Maximum of Se-FPR for each image and each compared method
First, we present a graph showing, for each studied method (Xue et al. [12] in blue, Li et al. [4], Loquinet al. [5] in black and our method in green) the maximum of the difference between Se and FPR for the set of possible parameterization for each method. The number of tested parameters were of 3052 for Xue, 1216 for Li, 7680 (30 standard deviations and 256 tolerances) for the method presented in this article and 256 for Loquin 2011. We took the maximum of Se-FPR since the detection is better for higher value of Se-FPR. This remark leads to a simple interpretation of this graph: globally (except for images 6 and 18) our method is better than the ones proposed in [4, 12]. We can observe a striking improvement of the detection with our algorithm on the bad quality images. Indeed, for patch images 3, 5, 7, 10, 48 and 49 which are all belonging to two worst images (cf. Table 1), Figure 3 shows that our method particularly outperforms the other ones.
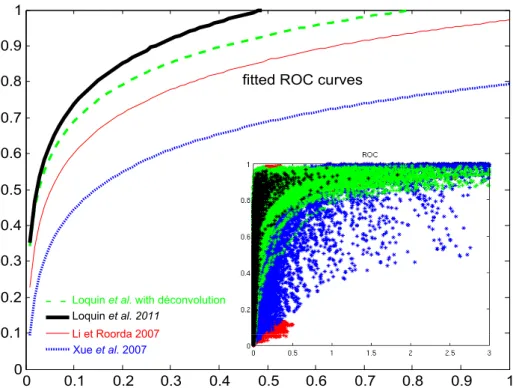
Second, we present the ROC (Receiver Operating Characteristic) cloud and its associated logarithmic fit curve. The ROC curve has FPR in abscissa and Se in ordinate. Such curve is supposed to measure the ability of a decision making support to diagnose. The bigger the area under the curve the more discriminative is the proposed tool. It can be noticed that, according to this ROC analysis, our algorithm is more able to detect cones than the compared ones [4, 12].
0 0.1 0.2 0.3 0.4 0.5 0.6 0.7 0.8 0.9 1 0 0.1 0.2 0.3 0.4 0.5 0.6 0.7 0.8 0.9 1
fitted ROC curves
Loquin et al. with déconvolution Loquin et al. 2011
Li et Roorda 2007 Xue et al. 2007
Fig. 4. ROC cloud and fitted (logrithmic) ROC curve for each compared methods
From Figure 4, but in contradiction with Figure 3, we could conclude that the approach without deconvolution (the black curve) is more accurate than the method presented in this article (the black curve). This is due to the fact that the number of tested parameterizations with deconvolution is 30 times bigger than without deconvolution. Therefore, the number of aberrant parameters, thus leading to worst results with deconvolution, is also more important. However this comparison bias due to the number of tested parameters can not be advocated for comparing the Li and Xue approach with the present one. Indeed, the number of tested parameters is higher in our approach than any of the other tested approaches.
8 K. Loquin, I. Bloch, K. Nakashima, F. Rossant, P.-Y. Boelle and M. Paques
4
Conclusion
In this paper, we proposed a new photoreceptor detection algorithm applied to in-vivo AO images of the retina. This algorithm is an extension of our work in [5] where we add a preliminary deconvolution step. Our method is implemented as an imageJ plugin already in use in a clinical setting at the XV -XX hospital. This use shows its early clinical value before any objective evaluation. However, in this paper, we also present a validation procedure of this algorithm which seems to show that our method is more efficient than the available rare littera-ture in that field especially for poor quality images. It should be noted that the parameterization of our method is not discussed in this article. A more complete article about our method evoking this sensible point is in preparation. For in-stance, learning methods of the PSF similar to blind deconvolution are currently tested.
References
1. Blanco, L., Mugnier, L.: Marginal blind deconvolution of adaptive optics retinal images. Opt Express 19(23), 23227–39 (November 2011)
2. Curcio, C.A., Sloan, K.R., Kalina, R.E., Hendrickson, A.E.: Human photoreceptor topography. The Journal of comparative neurology 292(4), 497–523 (1990) 3. de Jong, P.: Age-related macular degeneration. The New England Journal of
Medicine 355(14), 1474–1485 (2006)
4. Li, K., Roorda, A.: Automated identification of cone photoreceptors in adaptive optics retinal images. Journal of the Optical Society of America A 24(5), 1358–1363 (2007)
5. Loquin, K., Bloch, I., Nakashima, K., Rossant, F., Paques, M.: Photoreceptor de-tection in in-vivo adpative optics images of the retina: towards a simple interactive tool for the physician. In: IEEE International Symposium of Biomedical Imaging (ISBI’11). pp. 191–194. Chicago, USA (2011)
6. M.Couprie, Najman, L., Bertrand, G.: Quasi-linear algorithms for the topological watershed. Journal of Mathematical Imaging and Vision 22(2-3), 231–249 (2005) 7. Roddier, F.: Adaptive Optics in Astronomy. Cambridge University Press (1999) 8. Roorda, A., Romero-Borja, F., Donnelly, W., Queener, H., Hebert, T., Campbell,
M.: Adaptive optics scanning laser ophthalmoscopy. Optics Express 10(9), 405–412 (2002)
9. Ryan, S., Hinton, D., Schachat, A., Wilkinson, P.: Retina (3 Volume Set). Mosby (2005)
10. Vincent, L., Soille, P.: Watersheds in digital spaces: an efficient algorithm based on immersion simulations. IEEE Trans. Patt. Anal. Mach. Intell. 13(6), 583–598 (1991)
11. Wolfing, J.I., Chung, M., Carroll, J., Roorda, A., Williams, D.R.: High-resolution retinal imaging of cone-rod dystrophy. Ophthalmology 113, 1014–1019 (2006) 12. Xue, B., Choi, S., Doble, N., Werner, J.: Photoreceptor counting and montaging
of enface retinal images from an adaptive optics fundus camera. Journal of the Optical Society of America A 24(5), 1364–1372 (2007)