Configuration
of Wireless Connectivity and Spatial
Boundaries
for IoT Monitoring Devices
by
Zareen
Choudhury
S.B.
Electrical Engineering and Computer Science
Massachusetts
Institute of Technology, 2018
Submitted
to the Department of Electrical Engineering and Computer
Science
in
partial fulfillment of the requirements for the degree of
Master
of Engineering in Electrical Engineering and Computer Science
at
the
MASSACHUSETTS
INSTITUTE OF TECHNOLOGY
June
2019
○
c
Massachusetts Institute of Technology 2019. All rights reserved.
Author . . . .
Department of Electrical Engineering and Computer Science
May 24, 2019
Certified by . . . .
Dina Katabi
Professor of Electrical Engineering and Computer Science
Thesis Supervisor
Accepted by . . . .
Katrina LaCurts
Chair, Master of Engineering Thesis Committee
Configuration
o f W ireless C onnectivity a nd Spatial
Boundaries
for IoT Monitoring Devices
by
Zareen
Choudhury
Submitted to the Department of Electrical Engineering and Computer Science on May 24, 2019, in partial fulfillment of the
requirements for the degree of
Master of Engineering in Electrical Engineering and Computer Science
Abstract
A common challenge shared by IoT (Internet of Things) devices is to provide a reli-able, user-friendly, and scalable configuration s ystem. In this thesis we examine the configuration of WiTrack, a wall-mounted IoT device that provides real-time health monitoring using RF signals. WiTrack requires configuration o f t wo p rimary com-ponents: its wireless connectivity and the boundaries of spaces it collects data from. The present configuration procedure for WiTrack does not function in all deployment environments, requires expert knowledge, and does not scale well.
This thesis introduces the first configuration system for WiTrack, comprised of two subsystems: ConnectivityManager and SpaceManager. ConnectivityManager enables configuration of WiTrack’s wireless connection, and SpaceManager allows configura-tion of spatial boundaries by tracking an individual’s movement throughout a space. We evaluated both systems through a user study consisting of eight participants in six unique homes. We found that ConnectivityManager successfully allows configu-ration of all network security types, and SpaceManager produces boundaries that are accurate within 0.5 meters. The full deployment process can be completed within 15 minutes, and the systems reduce sources of human error as well as effort required for deployment. Compared to the previous configuration process, ConnectivityManager and SpaceManager represent a significant i mprovement i n f unctionality, t ime, and usability for WiTrack deployments.
Thesis Supervisor: Dina Katabi
Acknowledgments
I would like to thank my advisor, Dina, for giving me the opportunity to work on this research and for helping shape and guide my project. I am very grateful for my supervisor, Rahul, for his mentorship and support throughout the project. Through our discussions and iterations, I learned a great deal about designing complex systems, considering robustness and reliability, and wrangling with non-deterministic bugs. This project would not have been possible without the guidance I received from both of them.
I would also like to thank the rest of the lab for their support and company. Thank you to Abbas, Aditi, Aniket, Aniruddh, Ankur, Colin, and Joshua for their friendship, interesting discussions, and entertaining conversations. I am grateful to Zach, Mingmin, and Usman for helping with my experiments. And, of course, thank you to the lab dogs - Mica, Moko, and Moki - for all the cuddles, wags, and barks. I have cherished my time spent with everyone in the lab, and will carry these memories with me throughout my career.
Outside of lab, I have received support from countless mentors and friends. My academic advisor, Joel Voldman, has been crucial in shaping my academic journey over the past five years. Anne Hunter and Katrina LaCurts were my best advocates and cheerleaders when I felt stuck and needed guidance. My roommates, floormates, and friends have been there every step of the way, and I thank them for their unwa-vering friendship throughout my time at MIT.
Finally, I would like to dedicate my thesis to my parents, Mustafiz and Rasheda, and my brother, Abrar. Thank you to my brother for helping me whenever I have a difficult decision to make. Thank you to my parents for raising me and instilling the importance of education in me from an early age. They have served as my role models throughout my life, and I look up to them for their hard work, dedication, and perseverance. I would never have made it to where I am today without all of their support and encouragement.
Contents
1 Introduction 17
1.1 Contributions . . . 19
2 ConnectivityManager: Background 21 3 ConnectivityManager: System Overview 23 3.1 Hardware Description . . . 23
3.2 Software Description . . . 24
3.2.1 WifiApp Overview . . . 24
3.2.2 WifiManager Overview . . . 25
4 ConnectivityManager: System Implementation 27 4.1 Setup . . . 27
4.1.1 Infrastructure . . . 27
4.1.2 Wi-Fi Card Modes . . . 28
4.2 Communication Protocol . . . 28 4.2.1 Message Types . . . 28 4.2.2 Initiating Command . . . 29 4.2.3 Update Commands . . . 30 4.3 Command Implementation . . . 30 4.3.1 Scanning . . . 30 4.3.2 Connecting . . . 31 4.3.3 Disconnecting . . . 31
4.3.4 Checking Status . . . 31
5 ConnectivityManager: Robustness Implementation 33 5.1 Repair Implementation . . . 33
5.2 Reboot Implementation . . . 35
6 SpaceManager: Background 37 7 SpaceManager: System Overview 39 7.1 Mobile Application Overview . . . 39
7.2 Tracker Overview . . . 40
7.3 Web Server Overview . . . 40
8 SpaceManager: System Implementation 41 8.1 Infrastructure . . . 41 8.2 State Machine . . . 42 8.3 Communication Protocol . . . 43 8.3.1 Fetch Message . . . 43 8.3.2 Done Message . . . 43 8.3.3 Stop Message . . . 44 8.3.4 Boundary Message . . . 44
8.3.5 Connection Error Message . . . 44
9 Evaluation and Results 45 9.1 Evaluation Metrics . . . 45
9.2 User Study Design . . . 46
9.3 ConnectivityManager Results . . . 47
9.3.1 Time . . . 47
9.3.2 Usability . . . 47
9.4 SpaceManager Results . . . 49
9.4.1 Time . . . 49
9.4.3 Usability . . . 55 9.4.4 Areas of Improvement . . . 57
10 Conclusion 59
List of Figures
3-1 Nvidia Jetson TK1 development board with attached Intel and USB
Wi-Fi cards. . . 23
3-2 User-facing flow of wireless configuration application. . . 25
3-3 Flow diagram of how user inputs are converted into configurations for the device’s Wi-Fi card. . . 25
4-1 Infrastructure pipeline for wireless configuration system. . . 27
4-2 Steps involved in an initiating command, such as connect, disconnect, or rescan. . . 29
4-3 Steps involved in an update command, which is invoked by get_status. 30 5-1 Finite state machine representing the possible states and transitions of the repair thread. . . 34
5-2 Finite state machine representing the possible states and transitions of the reboot thread. . . 35
7-1 User-facing flow of SpaceManager. . . 40
8-1 Infrastructure pipeline for SpaceManager. . . 41
8-2 Finite state machine for SpaceManager. . . 42
9-1 Total time taken by each participant to configure and connect to a Wi-Fi network using ConnectivityManager. . . 48
9-2 Number of tries taken by each participant to configure and connect to a Wi-Fi network using ConnectivityManager. . . 48
9-3 Usability score given by each participant for ConnectivityManager. Scores were given on a scale of 1-5, where 1 was non-intuitive and difficult to use, and 5 was intuitive and easy to use. . . 49 9-4 Average number of tries taken by each participant to configure one
space using lasers and SpaceManager. The reported values were aver-aged across the three spaces. . . 50 9-5 Total time taken by each participant to configure three spaces using
lasers and SpaceManager. For lasers, the time includes both measuring and coordinate calculation time. For SpaceManager, the time includes tracking, editing, and submitting. . . 51 9-6 Histogram of the difference between ground truth edges and
SpaceManager-configured edges, across all spaces of all participants. The x-axis rep-resents the difference between the ground truth and configuration, in 0.5 meter intervals. The y-axis represents the frequency of each interval. 52 9-7 Comparison of SpaceManager-configured boundaries and ground truth
layout for Subject 1. This figure is representative of the majority of the participants. . . 54 9-8 Comparison of SpaceManager-configured boundaries and ground truth
layout for Subject 5. This configuration was an outlier because the device (gray) was mounted at an angle. . . 55 9-9 Comparison of SpaceManager-configured boundaries and ground truth
layout for Subject 6. This configuration was an outlier because the user mixed up the orientation of the tracking space. The device is drawn as a gray bar at the top of the graph. . . 56 9-10 Usability score given by each participant for lasers and SpaceManager.
Scores were given on a scale of 1-5, where 1 was non-intuitive and difficult to use, and 5 was intuitive and easy to use. . . 57 A-1 Comparison of SpaceManager-configured boundaries and ground truth
A-2 Comparison of SpaceManager-configured boundaries and ground truth layout for Subject 2. . . 62 A-3 Comparison of SpaceManager-configured boundaries and ground truth
layout for Subject 3. . . 62 A-4 Comparison of SpaceManager-configured boundaries and ground truth
layout for Subject 4. . . 63 A-5 Comparison of SpaceManager-configured boundaries and ground truth
layout for Subject 5. . . 63 A-6 Comparison of SpaceManager-configured boundaries and ground truth
layout for Subject 6. . . 64 A-7 Comparison of SpaceManager-configured boundaries and ground truth
layout for Subject 7. . . 64 A-8 Comparison of SpaceManager-configured boundaries and ground truth
List of Tables
4.1 List of possible message types in the communication protocol of the wireless configuration system. . . 28 8.1 List of possible message types in the communication protocol of
Chapter 1
Introduction
Real-time health monitoring has become increasingly important in recent years. The ability to remotely monitor patients’ health can alert healthcare providers of urgent problems in real-time and provide continuous data for detecting long-term trends. The past decade has seen a proliferation of health-related IoT (Internet of Things) devices for this purpose, ranging from Fitbits to CGMs (Continuous Glucose Monitoring). While these devices can offer a wealth of information when worn regularly, empirical data shows that users - especially elderly patients - often find wearables burdensome and stop using them after some time. This is especially true when different devices are required to monitor several different health metrics. As a result, wearables do not offer a sustainable solution for long-term health monitoring.
WiTrack is a wall-mounted IoT device that provides real-time health monitoring without the need to carry objects. It uses RF signals to track 3D movements in space, allowing it to detect users through walls and other occlusions [1]. Beyond tracking individuals’ movements, the device is capable of monitoring a number of metrics, such as heart rate, breathing pattern, sleep cycle, and gait speed [2][3][4]. Not only does WiTrack remove the burden of wearing devices on one’s body, but it also provides data on a number of different physiological metrics from the same device.
A common challenge shared by WiTrack and other IoT devices is providing a reli-able, user-friendly configuration system. Configuration broadly refers to the process of setting up and deploying a device in a new environment. Ideally, configuration
should not require expert knowledge, and should instead be easily executable by a layperson. Considering that WiTrack is often used by elderly patients, its setup pro-cedure should not be physically taxing and must have an intuitive interface. The system must also be robust and function reliably in different home and workplace environments.
Unfortunately, the current WiTrack configuration procedure requires third-party experts, involves manual inputs, and lacks important functionality. This prevents the device from being used in certain environments, and limits deployment scalability. We address these shortcomings in this thesis, by developing the first configuration system for WiTrack. We focus on providing two critical functions with this system: configuration of wireless connectivity and of spatial boundaries.
Wireless connectivity is vital to the functionality of all IoT devices, and WiTrack is no exception. The device relies on internet connection to send locally collected data to remote servers for further processing, as well as to provide information about the device’s health and status.
Since IoT devices rely on interactions with their environments, they also must have a configurable representation of that environment. In the case of WiTrack, the device needs to know the physical layout of the rooms it collects information from. This is what we refer to as spatial boundaries. Knowing the spatial boundaries is important for two main reasons. First, in many health monitoring applications, it is important to understand how much time a patient spends in specific spaces. For example, a doctor may want to monitor how long an elderly patient spends in the bathroom versus their bedroom and kitchen. Second, in some scenarios, users may not want to collect data from certain spaces. For instance, multiple people may live together in a nursing home, but only one of them may want to be monitored in their bedroom alone. Configuring spatial boundaries would allow users to dictate which areas WiTrack should collect data from.
In this thesis, we present two subsystems: ConnectivityManager and SpaceMan-ager. ConnectivityManager is a web application for connecting WiTrack to a wireless network. To use ConnectivityManager, users connect their phone, laptop, or tablet
to a network broadcast by WiTrack. They can then navigate to a web application that offers an interface for configuring, connecting to, and disconnecting from wire-less networks in the environment. Additionally, ConnectivityManager automatically detects and repairs connection losses throughout deployment.
SpaceManager is a mobile application for configuring spatial boundaries in a de-ployment environment. Similar to ConnectivityManager, users first connect their phone to the local network hosted by WiTrack. Then, they can simply walk around the spaces they wish to configure, and the application automatically generates and displays boundaries around those spaces. The user can modify the boundaries as needed before submitting them to the device.
To evaluate our configuration system, we conducted a user study that emulated a WiTrack deployment. The user study consisted of eight participants in six different homes. They were asked to connect WiTrack to a Wi-Fi network and configure the boundaries of three spaces in their homes. We received quantitative and qualitative feedback on the functionality, ease of use, and configuration time of both systems. For SpaceManager, we additionally evaluated the accuracy and expressiveness of the spatial boundaries it generated.
Our results showed that almost all users completed the full configuration process within 15 minutes. The vast majority of configured boundaries were accurate to 0.5 meters of the ground truth. Participants found that ConnectivityManager was very intuitive to use because of its similarity to other Wi-Fi connection systems. SpaceM-anager significantly reduced the inconvenience and human error of the previous space configuration procedure, and provided a scalable solution for expressing complex spa-tial layouts.
1.1
Contributions
In building the WiTrack configuration system, we make the following contributions: ∙ We present a wireless configuration system that automatically detects and
∙ We develop an accurate and easy-to-use configuration system for spatial bound-aries using RF signals. To our knowledge, it is the first of its kind.
∙ We implement and evaluate the configuration system through deployments in the wild.
Chapter 2
ConnectivityManager: Background
Configuring WiTrack’s wireless connectivity is analogous to connecting a phone or laptop to Wi-Fi: a user selects a network from a list of options, enters any necessary credentials, and receives real-time feedback on the connection status. Connectivity-Manager seeks to provide such an interface for WiTrack.
The previous wireless configuration system was an iPhone application that con-nected to WiTrack via Bluetooth. This system had several limitations. First, the small packet sizes in Bluetooth communication prevented the configuration of certain network encryption modes like WPA2-EAP, which is often found in hospitals and university campuses. Second, the mobile application was inconvenient from a devel-opment standpoint, as a separate app had to be maintained for Android and iOS, and for different versions within each OS. Third, the system was not robust to connection losses during deployment. ConnectivityManager addresses all three of these concerns, while supporting additional features for increased usability.
Chapter 3
ConnectivityManager: System
Overview
3.1
Hardware Description
Figure 3-1: Nvidia Jetson TK1 development board with attached Intel and USB Wi-Fi cards.
ConnectivityManager is built on top of pre-existing WiTrack hardware, which consists of a custom-built board connected to a processing unit. The custom board transmits RF signals into the surrounding environment and receives their reflections. These reflected signals are processed and interpreted by the processing unit, which is an Nvidia Jetson TK1. For ConnectivityManager, we additionally attach two Wi-Fi cards to the TK1 - an Intel Wi-Fi card and a USB Wi-Fi card (Figure 3-1) - to enable wireless connectivity. The TK1 runs Ubuntu 16.04 with a customized kernel.
3.2
Software Description
The ConnectivityManager software consists of two components: WifiApp and Wifi-Manager. WifiApp is a web server that receives inputs from the user regarding their wireless connectivity preferences. WifiManager receives these user inputs from Wifi-App and translates them into actual network configuration options for the WiTrack device.
3.2.1
WifiApp Overview
We designed WifiApp as a web application to avert two of the problems associated with the previous wireless configuration system. Web applications avoid the OS de-pendencies present in mobile applications, and using a TCP-based connection avoids the packet size limitations of Bluetooth connections.
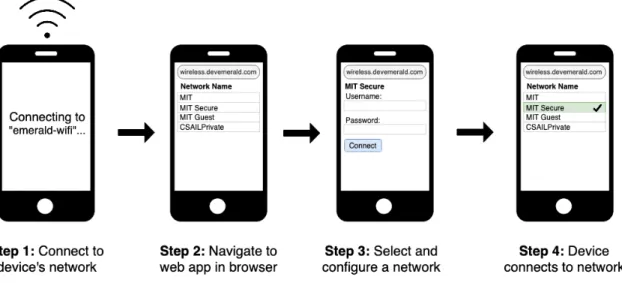
The user-facing flow of WifiApp is depicted in Figure 3-2. First, the user connects their phone or laptop to a local network broadcast by WiTrack. They enter the local network’s credentials in order to join. Second, they open a browser and connect to the web application hosted by WiTrack on its local network. The web application shows a list of detected networks in the area. Third, the user selects the network they want WiTrack to connect to, and enter that network’s credentials. Fourth, the device attempts to connect to the selected network and indicates whether it succeeded or not.
Figure 3-2: User-facing flow of wireless configuration application.
3.2.2
WifiManager Overview
Figure 3-3: Flow diagram of how user inputs are converted into configurations for the device’s Wi-Fi card.
mod-ules on the TK1. The green portions of the diagram indicate modmod-ules we built for this project, while the blue portions are pre-existing modules. Starting at the top of the figure, WifiApp receives user inputs through the web application interface, and passes them on to WifiManager over a Unix socket. WifiManager translates the user inputs into configuration options and commands for various low-level network management daemons. These network management daemons come packaged with Ubuntu 16.04. The daemons, in turn, configure the device’s physical Wi-Fi cards.
Chapter 4
ConnectivityManager: System
Implementation
4.1
Setup
4.1.1
Infrastructure
Figure 4-1 depicts the infrastructure for ConnectivityManager. HTTP requests sent from a user’s device are initially received by NGINX, a proxy server that determines which applications to send different requests to. NGINX passes WifiApp-specific requests to uWSGI, a lightweight web server that serves the WifiApp application. WifiApp is implemented in Python as a Django web application, while WifiManager is written in Python as a Django management command. WifiApp and WifiManager communicate with one another over a Unix socket.
4.1.2
Wi-Fi Card Modes
The two Wi-Fi cards are configured in distinct ways to support two network-related functions for the system. The USB Wi-Fi card is configured in AP (access point) mode, which allows WiTrack to broadcast its own local network on which the web application is hosted. Meanwhile, the Intel card is configured in client mode, which enables WiTrack to connect to an external wireless network and attain Internet con-nectivity.
4.2
Communication Protocol
4.2.1
Message Types
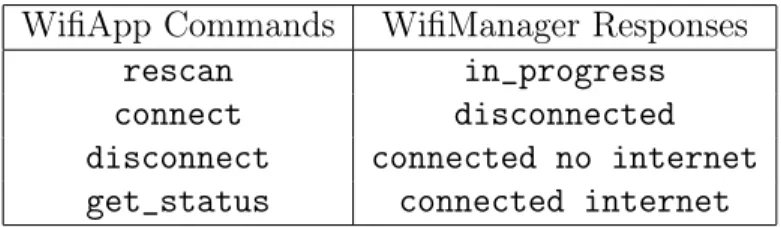
When WifiApp receives an HTTP request, it parses the user input information con-tained and converts it into a command that is sent to WifiManager. WifiManager responds with status updates, which WifiApp uses to update its display. The possible commands from WifiApp and responses from WifiManager are listed in Table 4.1.
WifiApp Commands WifiManager Responses rescan in_progress connect disconnected disconnect connected no internet get_status connected internet
Table 4.1: List of possible message types in the communication protocol of the wireless configuration system.
The communication between WifiApp and WifiManager can be categorized into two types: initiating commands and update commands. Initiating commands are invoked via the rescan, connect, or disconnect commands. Meanwhile, update commands are invoked by the get_status command.
4.2.2
Initiating Command
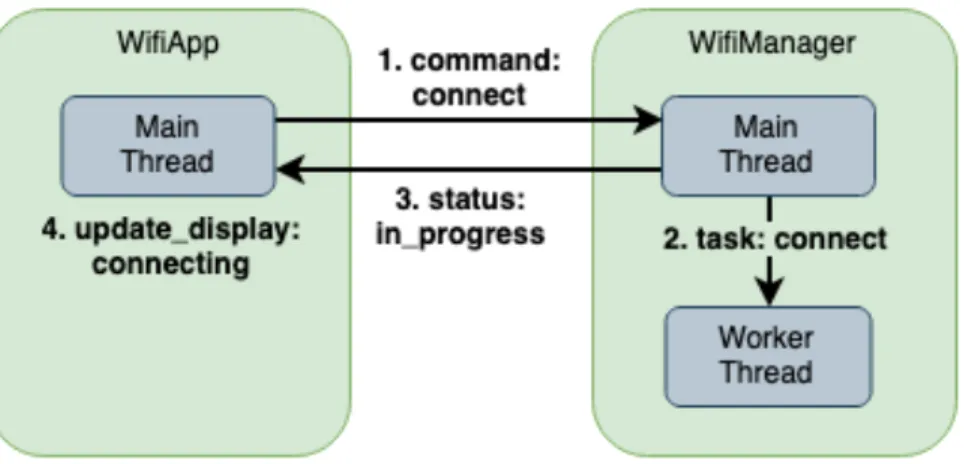
Figure 4-2 illustrates the steps involved in an initiating command between WifiApp and WifiManager. WifiManager consists of two threads: a main thread and a worker thread. The main thread receives commands from WifiApp and sends back responses. The worker thread is the one that actually interacts with the Linux networking dae-mons and monitors the status of the Wi-Fi cards. Details about the worker thread are discussed in Section 4.3.
Figure 4-2: Steps involved in an initiating command, such as connect, disconnect, or rescan.
For an initiating command, WifiApp first sends a command to WifiManager cor-responding to the HTTP request it received (Figure 4-2). In the example shown, WifiApp issues a connect command for connecting to a particular network. Second, the main thread in WifiManager receives the command over the Unix socket. It noti-fies the worker thread to start working on a new connect task. Third, WifiManager replies to WifiApp with its current status, in_progress. Meanwhile, the worker thread is actively working on its connect task in parallel. Fourth, WifiApp receives the response from WifiManager and updates its display to let the user know that the system is currently connecting to the network.
4.2.3
Update Commands
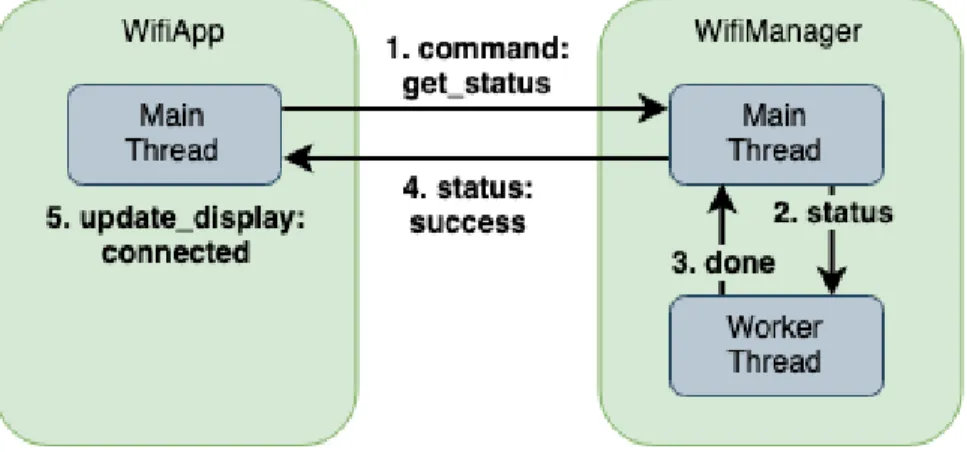
Figure 4-3: Steps involved in an update command, which is invoked by get_status.
Figure 4-3 displays the steps involved in an update command. First, WifiApp periodically polls WifiManager with get_status commands. Second, the main thread in WifiManager checks the current status of any active tasks and of the Wi-Fi cards’ network connection. These are updated by the worker thread, as indicated in the third step. Fourth, the main thread responds to WifiApp with information about the current status, which in this example is success (Figure 4-3). Fifth, WifiApp updates its display according to the status received. In this case, it shows that the network has been successfully connected to.
4.3
Command Implementation
4.3.1
Scanning
To obtain a list of Wi-Fi networks in the area, the worker thread issues the shell command iw dev wlan0 scan, which returns detailed information about detected wireless networks. The output is parsed to extract information about each network’s SSID, authentication, signal strength, and frequency.
4.3.2
Connecting
To attempt to connect to a particular Wi-Fi network, the worker thread uses wpa_supplicant, a wireless connectivity utility for Linux. It writes a configuration file with information
about the network it wants to connect to, such as network SSID, username, password, and certificate path. The type of information written to the file depends on the net-work’s authentication type. A sample configuration for an EAP-encrypted network is shown below. The worker thread must then refresh wpa_supplicant to indicate that the configuration file has been modified.
4.3.3
Disconnecting
In order to disconnect from a Wi-Fi network, the worker thread removes the network’s information from the wpa_supplicant configuration file and refreshes the utility to enact the change.
4.3.4
Checking Status
To check the Wi-Fi card’s current status, the worker thread makes use of the iw and ping utilities. The shell command iw dev wlan0 link outputs information about which network, if any, the Wi-Fi card is connected to.
However, even if the card is connected to a network, it may not be connected to the internet. Therefore, the worker thread also performs a ping on www.google.com to check for internet connectivity. Based on both of these outputs, it returns one of three statuses: disconnected, connected without internet, or connected with internet.
Chapter 5
ConnectivityManager: Robustness
Implementation
Because wireless connectivity is a critical prerequisite for all of WiTrack’s operations, one of our goals for ConnectivityManager was to ensure a robust, persistent connec-tion. To achieve this, we built a repair mechanism to attempt to fix lost connections, as well as a reboot mechanism to reboot the device if repair attempts fail. Both the repair and reboot mechanisms are implemented as separate threads under WifiMan-ager.
5.1
Repair Implementation
The repair thread periodically checks the connection status of the client Wi-Fi card. If the card is connected with internet, it takes no action. Otherwise, it incrementally escalates to various repair actions in an attempt to fix the connection. The finite state machine in Figure 5-1 depicts the possible states and state transitions of the repair thread.
The thread begins in the Repair Start state (Figure 5-1). It performs state transi-tions at each periodic check of its connection status. If it is connected with internet, it remains in the Repair Start state. If it is either connected without internet or disconnected, it considers other factors in the Wi-Fi card’s status. If the Wi-Fi card
Figure 5-1: Finite state machine representing the possible states and transitions of the repair thread.
is associated with a network SSID but has not been assigned an IP address, then the thread transitions to the Repair IP Address state. Otherwise, if the card has no associated SSID, the system considers whether there are any previously configured networks. If there are, the thread transitions to the Repair SSID state, in an attempt to connect to one of the configured neteworks. If not, it transitions to the Repair Fail state.
In the Repair IP Address state, the system uses the dhclient command to explic-itly request an IP address from the access point (AP) that the Wi-Fi card is connected to. In the next connection status check, if the card has successfully connected to the internet, the thread transitions back to Repair Start (Figure 5-1). Otherwise, it escalates to Repair SSID.
In the Repair SSID state, the thread attempts to connect to each configured net-work up to three times each. If any of the attempts successfully leads to internet connection, it returns to Repair Start. If an attempt results in the Wi-Fi card asso-ciating with an SSID but not an IP address, it transitions to the Repair IP Address state. Otherwise, if all attempts are unsuccessful, the thread moves on to the Repair Fail state.
Once the thread is in the Repair Fail state, it has exhausted all its resources for attempting to fix the network connection. As a result, it does not try to take any further action, and only periodically checks its connection status. If the card is able
to gain internet connection somehow, the thread returns to the Repair Start state. Otherwise, it remains in Repair Fail until the reboot thread triggers a device reboot (Section 5.2).
5.2
Reboot Implementation
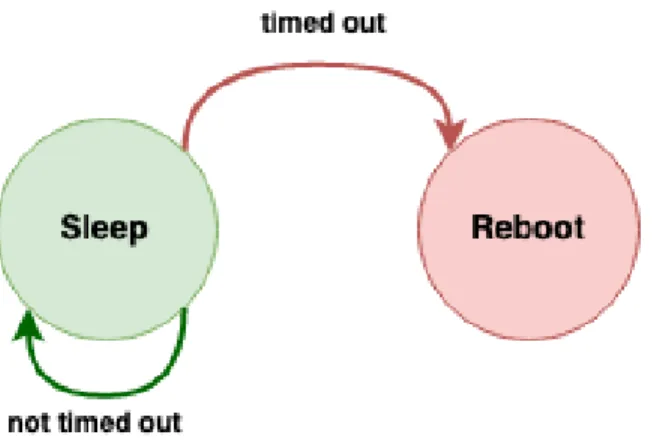
The reboot thread’s task is to reboot the device if the Wi-Fi card has not been connected to the internet for a long period of time (about half an hour). Its finite state machine is depicted in Figure 5-2.
Figure 5-2: Finite state machine representing the possible states and transitions of the reboot thread.
Whenever the repair thread (Section 5.1) checks the Wi-Fi card’s connection sta-tus, it updates a shared data structure indicating the latest time when the device lost internet connection. The reboot thread starts in a Sleep state, in which it periodi-cally checks this shared timestamp. If the amount of time since the timestamp does not exceed a specified timeout, the thread remains in the Sleep state. Otherwise, it transitions to the Reboot state, in which it triggers a reboot of the device.
Chapter 6
SpaceManager: Background
The high-level goal of SpaceManager is to provide a system for configuring spatial boundaries in the environment that WiTrack is deployed in. More concretely, this means representing the layouts of rooms in the building, consisting of their shapes and dimensions. This information helps contextualize data collected from WiTrack, allowing researchers to connect actions and patterns with specific rooms and spaces. Previously, to configure spatial boundaries, a user would have to physically draw the rooms’ floor plans and measure each of the rooms’ dimensions using a laser mea-suring tool. Next, the dimensions would have to be converted into coordinates with respect to the device’s location. Finally, these coordinates would be manually entered into a database, along with annotations for the type of room. This method had many obvious limitations. The manual measurements were difficult to conduct, particularly for users such as elderly patients with low mobility. It was prone to human error and took a long amount of time. Additionally, boundaries were not easily modifiable.
There are currently numerous mobile applications that attempt to automate floor plan measurements, such as the native iOS Measure app. With these applications, users point the phone camera at an object and move the phone along the object’s edge to obtain a measurement. However, through user testing, we discovered that these solutions display a high degree of inaccuracy and variance. Depending on the lighting, angle, and calibration of the scene, the apps frequently produce measurements that are orders of magnitude away from the ground truth.
It is evident that neither of the existing solutions are ideal. To address this gap, we focused on making SpaceManager easy to use like the mobile applications, while maintaining the accuracy and expressiveness of manual measurements.
Chapter 7
SpaceManager: System Overview
SpaceManager uses the same underlying hardware as ConnectivityManager (Sec-tion 3.1). Its software consists of three components: a mobile applica(Sec-tion, a tracker, and a web server. The mobile application presents the user interface for configuring spatial boundaries. The tracker provides live tracklet data to the system, and the server acts as the middleman between the mobile application and the tracker.
7.1
Mobile Application Overview
The mobile application consists of three steps for configuring spatial boundaries: 1. Track the spaces.
2. Edit the generated boundaries. 3. Submit the boundaries.
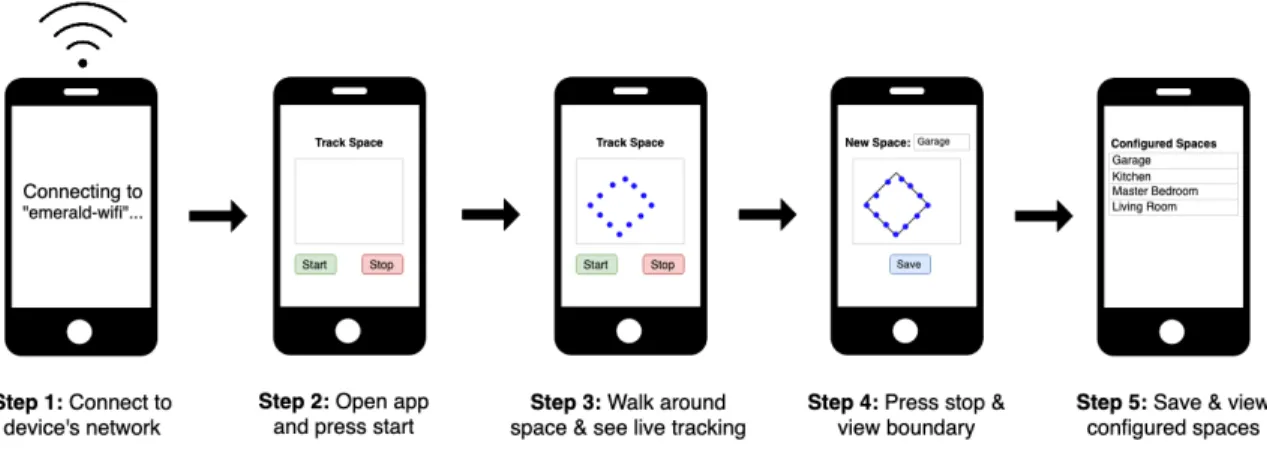
The user-facing flow for the tracking step is depicted in Figure 7-1. First, the user connects their phone to the local network broadcast by the TK1. Second, they open the mobile app and press start to configure a new space. Third, they physically walk around the space they wish to configure. The app displays a real-time visualization of the individual’s movement. Fourth, the user presses stop, and the app generates a rectangular boundary around the user’s trajectory. Fifth, the user saves the new space and can view a list of previously configured spaces as well.
Figure 7-1: User-facing flow of SpaceManager.
After tracking a space, the user can use an editing interface in the app to modify the generated boundary. The editing tools include adding points, deleting points, moving points, and moving the shape. Once the boundary has been edited to the user’s satisfaction, it can be submitted to the web server.
7.2
Tracker Overview
The tracker is a pre-existing program that tracks people’s movement in the environ-ment. It processes raw data from the WiTrack hardware and converts it into tracklets, or a time series of coordinate points corresponding to individuals’ movement through a space. This part of the tracker existed beforehand. In this thesis, we add an inter-face to the tracker that interacts with the rest of the space configuration system by streaming tracklets when asked to do so.
7.3
Web Server Overview
The web server acts as a middleman between the mobile application and the tracker. It converts web requests from the phone into commands for the tracker, and vice versa. In addition, it performs computation for the phone that cannot be easily completed in the mobile application.
Chapter 8
SpaceManager: System
Implementation
8.1
Infrastructure
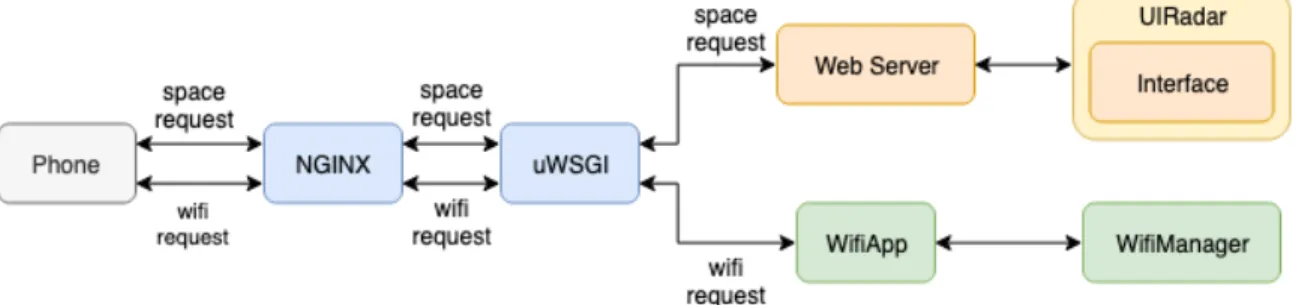
Figure 8-1 depicts the infrastructure for SpaceManager. The first part is very similar in design to ConnectivityManager: HTTP requests from the phone are received by NGINX and uWSGI, which forward the requests to the web server. The web server passes information to the tracker over a Unix socket. Like WifiApp, the web server is implemented in Python using Django. Meanwhile, the tracker is written as a C++ program, and the mobile application on the phone is an iOS app.
8.2
State Machine
All state in the space configuration system resides in the mobile application, making the server and the tracker stateless. If multiple components of the system were state-ful, we would need to implement complex consistency protocols across them. Our design ensures that there is only one source of truth for the state of the system.
Figure 8-2: Finite state machine for SpaceManager.
The possible states and transitions for the system are described in the FSM in Figure 8.2. Initially, the system begins in an idle state. When a user presses start, it transitions to the connecting state, in which the phone attempts to establish a connection with the server. If the attempt is successful, it moves onto the tracking state. Here, the tracker streams tracklets to the server, which forwards them to the phone. When the user presses stop, the state machine transitions to a stopping state, in which the phone attempts to inform the server that the tracking session is over. If this communication is successful, the next state is the boundary calculation. In this phase, the phone requests the server to calculate a bounding box around the user’s tracklets. Finally, when the phone receives the calculated boundaries, the state machine transitions to being done. If an error occurs along any of these stages, the FSM moves into the error state; and if the mobile app becomes idle, it transitions to the interrupted state.
8.3
Communication Protocol
We implement an end-to-end communication protocol to realize the system’s state machine (Section 8.2). Every message in the protocol follows a common format, consisting of the message type, message size, and the message body. The message types are listed in Table 8.1. We use JSON encoding between the mobile application and the server, and byte encoding between the server and the tracker. The details of each message type are discussed in the following subsections.
Message Types fetch done boundary stop connection_error
Table 8.1: List of possible message types in the communication protocol of SpaceM-anager.
8.3.1
Fetch Message
The phone issues a fetch message when the user starts a new tracking session and the state machine has entered the connecting state. When the server receives this message, it forwards it to the tracker, which then streams tracklets back to the server for the next 30 seconds. The server passes the tracklets back to the phone via a streaming HTTP response. When the phone receives the first tracklet in reponse to its fetch message, it considers the connection attempt successful, and transitions the state machine to the tracking state.
8.3.2
Done Message
After the 30 second interval is over, the tracker issues a done message, which the server propagates to the phone. When the phone receives done, it issues another fetch message. This process continues throughout the tracking state, with the phone issuing
new fetch messages when each 30-second tracking interval ends. In this design, each fetch message acts as a keep-alive for the phone, ensuring that the tracker only sends tracklet streams when the mobile application is active and in the tracking state. Moreover, the request-based streaming allows for a stateless implementation of the tracker and the server.
8.3.3
Stop Message
When a user presses the stop button and the state machine enters the stopping state, the phone issues a stop message to the server, which is relayed to the tracker. The tracker prematurely ends any tracklet streaming sessions and then responds with a stop ACK. When the phone receives a stop ACK and sees that existing stream-ing sessions have been ended, it successfully moves from the stoppstream-ing state to the boundary calculation state.
8.3.4
Boundary Message
In the boundary calculation state, the phone sends a boundary message to the server, which is a POST with all the tracklets from its current tracking session. Unlike other requests, the server does not forward this message to the tracker. Rather, it locally computes a convex hull of the received data points and responds with the coordinates of the hull. Once the phone receives this boundary response, it transitions to the done state and updates the application’s UI with a visualization of the boundary.
8.3.5
Connection Error Message
If the server detects a loss of connection with the tracker, it issues a connection_error message to the phone, and vice versa. In response to receiving this message, the phone displays an error message to the user, and the tracker stops streaming tracklets.
Chapter 9
Evaluation and Results
9.1
Evaluation Metrics
To evaluate ConnectivityManager and SpaceManager, we examined specific metrics for each system. For ConnectivityManager, the metrics were:
∙ Functionality. The system should allow connecting, disconnecting, and con-figuring networks of all types.
∙ Time. Users should be able to configure the device’s network connectivity within a reasonable amount of time, approximately 1 to 3 minutes depending on the network type.
∙ Ease of use. The system should be intuitive and easy to use. The metrics for SpaceManager were:
∙ Functionality. The system should allow configuring, editing, and submitting spatial boundaries.
∙ Time. Users should be able to configure spatial boundaries within a reasonable amount of time, approximately 5 minutes per space.
∙ Ease of use. The system should be intuitive and easy to use.
∙ Accuracy. The system should accurately report the dimensions of spatial boundaries, to within 0.5 meters.
∙ Expressiveness. The system should be able to express spaces of all shapes and sizes.
We evaluated these metrics by conducting a user study, which is described in the following section.
9.2
User Study Design
The user study consisted of participants completing a list of tasks to emulate a WiTrack deployment in their homes. At a high level, the tasks were as follows:
1. Mount the WiTrack device.
2. Connect WiTrack to a Wi-Fi network using ConnectivityManager. 3. Configure three spaces using SpaceManager.
To evaluate functionality, time, and ease of use, we asked participants to complete a survey after finishing the tasks. The survey included qualitative and quantitative questions on how long each step took, how many attempts were taken for each step, how easy it was to use the interfaces, and whether the user faced any problems while using the systems. To evaluate accuracy and expressiveness for SpaceManager, we asked participants to provide ground truth measurements by drawing floor plans of the spaces they configured and measuring the spaces’ dimensions with laser measurement tools.
The user study was conducted with eight participants - four females and four males - ranging from age 20-30. Four of the participants were already familiar with WiTrack but not the configuration systems. The other four participants had no prior experience with WiTrack or the configuration systems. Across the eight participants, there were six unique homes, five of which were apartments in Cambridge, MA, and one of which was a 3-person suite in a student dormitory.
9.3
ConnectivityManager Results
The following subsections discuss the quantitative and qualitative results for Connec-tivityManager with respect to time and usability.
9.3.1
Time
Figure 9-1 depicts the total time taken by each participant to configure and connect to their Wi-Fi network using ConnectivityManager, and Figure 9-2 shows the num-ber of attempts taken to do so. The majority of participants took only one attempt to configure their Wi-Fi, and connected within 1-3 minutes. The exceptions to this were Subject 2 and Subject 5. Subject 2 had to reboot the device three times before WiTrack’s local network appeared and the Wi-Fi could be configured. Upon fur-ther investigation, we discovered that this was caused by hardware errors during the booting sequence, which were unrelated to ConnectivityManager. Subject 5 unsuc-cessfully attempted to connect to several different networks, for a total of 7 minutes, before one of them finally connected. This occurred because there were pre-existing problems with those Wi-Fi networks at the time, as reported by other individuals using those networks. Thus, the longer time taken for this subject was consistent with the existing behavior of the networks.
9.3.2
Usability
Participants were asked to rate the usability of ConnectivityManager on a scale of 1-5, where 1 is difficult to use, and 5 is easy to use. The results of the usability scores are shown in Figure 9-3. Almost all participants rated the system with a score of 4 or 5. Subject 5 provided a lower score of 3 due to their frustration over not successfully connecting until their fourth attempt. However, this was caused by external network problems beyond the scope of ConnectivityManager, as discussed in Section 9.3.1.
Qualitative feedback indicated that the system’s layout was intuitive to follow, particularly because it had a similar flow to Wi-Fi connection on a laptop or phone. Participants reported that it was very easy to select and connect to networks. One
Figure 9-1: Total time taken by each participant to configure and connect to a Wi-Fi network using ConnectivityManager.
Figure 9-2: Number of tries taken by each participant to configure and connect to a Wi-Fi network using ConnectivityManager.
suggestion for improvement was to reduce the number of steps required by Connec-tivityManager, since users must connect to the device’s local network and log on to the web app before entering the configuration page. In future iterations, we hope
Figure 9-3: Usability score given by each participant for ConnectivityManager. Scores were given on a scale of 1-5, where 1 was non-intuitive and difficult to use, and 5 was intuitive and easy to use.
to address this concern by integrating ConnectivityManager and SpaceManager into one seamless mobile application.
9.4
SpaceManager Results
The following subsections discuss the quantitative and qualitative results for Space-Manager with respect to time, accuracy and expressiveness, and usability.
9.4.1
Time
Figure 9-4 shows the average number of tries each participant took to track a single space with SpaceManager, as well as to measure a single space using lasers. All par-ticipants used one attempt with the laser, and most parpar-ticipants used one attempt with SpaceManager, with a few exceptions. Subject 4 had to restart one of their tracking sessions because their phone disconnected from WiTrack’s local network and reconnected to their home Wi-Fi. This may have occurred if their phone had built-in settbuilt-ings for automatically detectbuilt-ing and connectbuilt-ing to built-internet-enabled networks,
since the WiTrack network does not provide a bridged internet connection. This was done by design: we do not want users’ phones to automatically connect to WiTrack’s network for normal operation, as the network should only be used during configura-tion. This is achieved by not providing internet connection, which deprioritizes the WiTrack network.
Figure 9-4: Average number of tries taken by each participant to configure one space using lasers and SpaceManager. The reported values were averaged across the three spaces.
Subject 2 and Subject 3 had to re-track their spaces because they discovered that the device did not provide full coverage for the areas they wanted to configure. In one case, a TV was blocking the signal from reaching part of a bedroom; in another case, the device was too far to reach the last room. As a result, they had to adjust their device setup accordingly. Despite using multiple attempts, their total time to configure the spaces was not increased by much, as discussed below. These two scenarios also revealed an additional benefit of SpaceManager that we had not anticipated - the ability to gauge the device’s coverage during configuration time. Previously, there was no way to gauge coverage using the lasers.
Figure 9-5 shows the total time each participant took to configure the three spaces, using both SpaceManager and the laser measuring tools. For SpaceManager, this time
included tracking, editing, and submitting the spatial boundaries. With the lasers, the process was divided into two steps. First, participants measured the spaces’ dimensions using the laser tool and sketched layouts of the spaces with annotated dimensions. Next, a member of our research group manually converted the annotated layouts into (x, y) coordinates and entered them into a database. The reported time in Figure 9-5 incorporates both of these steps for the lasers, and all three steps for SpaceManager.
Figure 9-5: Total time taken by each participant to configure three spaces using lasers and SpaceManager. For lasers, the time includes both measuring and coordi-nate calculation time. For SpaceManager, the time includes tracking, editing, and submitting.
Our goal was for participants to configure the three spaces within 15 minutes. SpaceManager met this benchmark in all cases, but the lasers missed the benchmark for half the participants (Figure 9-5). We discovered that the laser measuring process was fairly quick, averaging about 2 minutes per space, but the coordinate calcula-tion step took significantly longer for complex room shapes. While most participants configured simple rectangular spaces, Subjects 5, 7, and 8 configured irregular shapes with non-right angles. For the simple rectangular case, coordinate calculation sim-ply involved adding and subtracting dimensions with respect to the device’s location. However, determining the coordinates of irregular shapes took significantly longer,
as it additionally required estimating angles and solving geometry equations for tri-angles. As a result, the total time for lasers was close to 30 minutes for Subjects 5, 7, and 8. These results reveal that the laser measuring tools can be comparable in time to SpaceManager for simple rectangular spaces, but become impractical and unscalable time-wise for expressing more complex shapes.
9.4.2
Accuracy and Expressiveness
To evaluate the accuracy of the spatial configurations, we compared the SpaceMan-ager boundaries to the ground truth layouts that were measured with lasers. For each participant, we calculated the distance between the SpaceManager boundaries and the ground truth boundaries, on an edge-by-edge basis. A histogram of the edge differences across all participants is plotted in Figure 9-6. As shown in the figure, a vast majority of the edges generated by SpaceManager were within 0.5 meters of the ground truth, which meets our goal for accuracy.
Figure 9-6: Histogram of the difference between ground truth edges and SpaceManager-configured edges, across all spaces of all participants. The x-axis repre-sents the difference between the ground truth and configuration, in 0.5 meter intervals. The y-axis represents the frequency of each interval.
shapes produced by SpaceManager versus the lasers. Plots of these shapes for all eight participants can be found in Appendix A. In this section, we examine three particular examples: one representative case study, followed by two outliers. Figure 9-7 depicts the SpaceManager spaces (red) and ground truth spaces (blue) for Subject 1. The device is drawn as a gray bar near the top of the plot. This figure is representative of the majority of the participants’ results: the configured space has a very similar shape to the ground truth, and their edges are within 0.25-0.5 meters of each other. In this example, the user overestimated the edges of the couch, and underestimated the top edge of the living room and den. These errors were consistent with a common pattern observed across participants. When users tracked a room with SpaceManager, they could not walk precisely along the edges because of furniture lined against the walls, causing an underestimation of the space. When users tracked a bed or couch, they would walk around the object, resulting in an overestimation of the space. In Figure 9-7, it can also be seen that the right-hand edge of the den is not straight, and overestimates the actual boundary. This resulted from the subject’s attempt to edit the boundary. We found that user editing was another common source of overestimation, as it was difficult to accurately translate real-world distances onto the app’s coordinate system.
The results for the first outlier, Subject 5, are shown in Figure 9-8. As depicted by the ground truth (blue), this environment contained angled walls, and the device itself was mounted at an angle. The SpaceManager boundaries (red) grossly overestimate both the bedroom and kitchen. We discovered that the angled position of the device was the source of the overestimation. When the subject was tracking their bedroom, they walked in a straight vertical line. However, their tracklet appeared as a slanted line in the app’s interface, due to the angling. The caused SpaceManager to generate a much larger bounding box than the ground truth dimensions of the room. When the subject subsequently edited the layout, they extended the boundaries of the kitchen to match the relative position of the enlarged bedroom. This example revealed a limitation in SpaceManager’s expressiveness: it currently mishandles environments in which the device is mounted at an angle. In future iterations of the mobile app,
Figure 9-7: Comparison of SpaceManager-configured boundaries and ground truth layout for Subject 1. This figure is representative of the majority of the participants.
we plan to add a feature for inputting a device angle, then transform the tracklets’ coordinates accordingly.
Figure 9-9 plots the results of the second outlier, Subject 6. Once again, the SpaceManager boundaries vastly overestimate the ground truth, and the shapes do not match expectations, either. In particular, the configured bedroom (red) appears to be rotated counterclockwise by 90 degrees, compared to its ground truth counter-part (blue). The subject later reported that they had confused the orientation of the app coordinate system. They initially thought that the device was located on the left-hand side of the plot, and modified the bedroom and bed’s boundaries accordingly. Subsequently, they realized that the device was located at the top of the plot, and oriented the hallway correctly. Thus, although the initial bounding box generated by SpaceManager was well within the ground truth boundaries, the subject modified the shapes to be significantly larger and different in form from the original. This case study highlighted several areas for improvement in SpaceManager’s usability, which
Figure 9-8: Comparison of SpaceManager-configured boundaries and ground truth layout for Subject 5. This configuration was an outlier because the device (gray) was mounted at an angle.
are discussed further in Section 9.4.3.
9.4.3
Usability
Participants provided qualitative feedback on the usability of the lasers and SpaceM-anager, and additionally rated SpaceManager on a scale of 1 (hard to use) to 5 (easy to use). For the laser measuring step, users found the laser tool quick and ease to use because of its simple interface and user-friendly buttons. However, there were several limitations of the tool. Many reported that it was hard to hold parallel to the ground and to know whether their measuring angle was accurate. It was also difficult to make measurements when there were objects obstructing the laser beam’s path. Furthermore, there were numerous sources of human error with the laser-based configuration. All the participants from outside the lab made mistakes during the measuring step: several of them forgot to measure one or two edges, and one of them
Figure 9-9: Comparison of SpaceManager-configured boundaries and ground truth layout for Subject 6. This configuration was an outlier because the user mixed up the orientation of the tracking space. The device is drawn as a gray bar at the top of the graph.
did not account for a piece of furniture while measuring a room length. The largest source of inconvenience, though, came from the coordinate calculation step. As de-scribed in Section 9.4.1, this process involved tedious calculations by hand, solving geometry equations, and manually checking computations for errors. The amount of mental energy required by this step is simply impractical to ask of a layperson.
The user-reported usability scores for SpaceManager are shown in Figure 9-10, where the average score was 3.9. Most users said that the real-time tracking had a very intuitive interface, and that the automatically generated bounding box was a nice feature. They also appreciated the rich functionality of the space editing screen. As for areas of improvement, the largest concern stemmed from the difficulty in translating real-world positions onto the app during the editing step. In the following subsection, we consider reasons for these inaccuracies and ways to improve them.
Figure 9-10: Usability score given by each participant for lasers and SpaceManager. Scores were given on a scale of 1-5, where 1 was non-intuitive and difficult to use, and 5 was intuitive and easy to use.
9.4.4
Areas of Improvement
Compared to the lab environment that we had previously tested in, the home environ-ments contained smaller rooms with far more furniture and other obstacles. These additional objects prevented users from walking to the corners of the spaces, and only allowed tracking in a subset of the space. As a result, users had to estimate how much to modify the initial bounding boxes. They found it difficult to mentally convert these real-world distances into distances on the app’s editing screen, since the app did not offer any feedback on the accuracy of their modifications. This was the largest source of inaccuracy in spatial configuration, as people do not have precise intuition for distances without any anchoring or feedback.
After the user study, we modified the mobile app to provide additional guidance for editing. Boundary edges are now annotated with their dimension in meters. When boundaries or points are moved, they automatically snap to the nearest 0.25 meter to offer guidance in the editing process. We believe that further improvements to the app’s UI/UX would also make it easier to align edited boundaries to the ground
truth. A few subjects indicated that it was difficult to drag and select shapes on the small phone screen, so we developed a version of the app for the iPad. In addition to this, it would be beneficial to perform A/B testing on the editing interface, to make the experience as intuitive as possible and understand what set of editing tools would be most helpful to users.
Another trend we noticed was that users tend to overestimate the size of furniture and underestimate the size of rooms, since they walk around the furniture but inside the rooms. In the future, we hope to automatically calibrate for this common error case. The app could ask what type of space the user is configuring (i.e. room or object), and then expand or contract the generated bounding box accordingly, by some fixed margin.
Finally, we implemented some other changes at the suggestion of the user study participants. Because one subject was confused by the orientation of the tracking screen, we modified the UI by prominently labeling the device location, and drawing the device to scale. At the request of one participant, we implemented a feature for adding shapes to a room as a representation of furniture. This allows users to quickly express small objects in the environment, without tracking and editing each one individually.
Chapter 10
Conclusion
In this thesis, we present a configuration system for WiTrack, consisting of Con-nectivityManager for wireless connectivity and SpaceManager for spatial boundaries. User testing across six home environments confirmed that ConnectivityManager suc-cessfully allows configuration of all network security types, and SpaceManager offers a scalable and accurate solution for configuring both simple and complex bound-aries. Configuration of both systems can be consistently completed within 15 minutes. Furthermore, SpaceManager provides insight into WiTrack’s coverage, and Connec-tivityManager offers a connection repair mechanism throughout deployment. This configuration system presents a significant improvement over the previous methods, by offering functionality in all environments, reducing sources of human error, and decreasing overall effort required for deployment.
In the future, we hope to further reduce deployment time and improve the system’s usability based on feedback from user testing. We envision combining SpaceManager and ConnectivityManager into a single application to decrease the total steps in the process. We would like to implement additional features in SpaceManager to handle environments with angled walls, and to reduce sources of error in the boundary editing step. Finally, we plan to evaluate the effectiveness of ConnectivityManager’s repair mechanism. The system is currently deployed in 10-15 homes and has been anecdotally functional, but we hope to quantify its reliability by collecting metrics like connection uptime.
Appendix A
Figures
Figure A-1: Comparison of SpaceManager-configured boundaries and ground truth layout for Subject 1.
Figure A-2: Comparison of SpaceManager-configured boundaries and ground truth layout for Subject 2.
Figure A-3: Comparison of SpaceManager-configured boundaries and ground truth layout for Subject 3.
Figure A-4: Comparison of SpaceManager-configured boundaries and ground truth layout for Subject 4.
Figure A-5: Comparison of SpaceManager-configured boundaries and ground truth layout for Subject 5.
Figure A-6: Comparison of SpaceManager-configured boundaries and ground truth layout for Subject 6.
Figure A-7: Comparison of SpaceManager-configured boundaries and ground truth layout for Subject 7.
Figure A-8: Comparison of SpaceManager-configured boundaries and ground truth layout for Subject 8.
Bibliography
[1] F. Adib, Z. Kabelac, D. Katabi, and R. Miller. "3D Tracking via Body Radio Reflections" in Usenix NSDI. Usenix, April 2014.
[2] F. Adib, H. Mao, Z. Kabelac, D. Katabi, and R. Miller. "Smart Homes that Monitor Breathing and Heart Rate" in ACM CHI. ACM, April 2015.
[3] C. Hsu, A. Ahuja, S. Yue, R. Hristov, Z. Kabelac, and D. Katabi. "Zero-Effort In-Home Sleep and Insomnia Monitoring using Radio Signals" in ACM UbiComp. ACM, 2017.
[4] C. Hsu, Y. Liu, Z. Kabelac, R. Hristov, D. Katabi, and C. Liu. "Extracting Gait Velocity and Stride Length from Surrounding Radio Signals" in ACM CHI. ACM, 2017.