HAL Id: hal-01977597
https://hal.archives-ouvertes.fr/hal-01977597
Submitted on 22 Jul 2019
HAL is a multi-disciplinary open access
archive for the deposit and dissemination of
sci-entific research documents, whether they are
pub-lished or not. The documents may come from
teaching and research institutions in France or
abroad, or from public or private research centers.
L’archive ouverte pluridisciplinaire HAL, est
destinée au dépôt et à la diffusion de documents
scientifiques de niveau recherche, publiés ou non,
émanant des établissements d’enseignement et de
recherche français ou étrangers, des laboratoires
publics ou privés.
Understanding and Tuning the Catalytic Bias of
Hydrogenase
Abbas Abou Hamdan, Sébastien Dementin, Pierre-Pol Liebgott, Oscar
Gutiérrez-Sanz, Pierre Richaud, Antonio de Lacey, Marc Rousset, Patrick
Bertrand, Laurent Cournac, Christophe Léger
To cite this version:
Abbas Abou Hamdan, Sébastien Dementin, Pierre-Pol Liebgott, Oscar Gutiérrez-Sanz, Pierre
Richaud, et al.. Understanding and Tuning the Catalytic Bias of Hydrogenase. Journal of the
Ameri-can Chemical Society, AmeriAmeri-can Chemical Society, 2012, 134 (20), pp.8368-8371. �10.1021/ja301802r�.
�hal-01977597�
Understanding and tuning the catalytic bias of hydrogenase
Abbas Abou Hamdan,
aSébastien Dementin,
aPierre-Pol Liebgott,
aOscar Gutierrez-Sanz,
bPierre
Ri-chaud,
cAntonio L. De Lacey,
bMarc Rousset,
aPatrick Bertrand,
aLaurent Cournac,
c* and Christophe
Léger.
a*
(a) Laboratoire de Bioénergétique et Ingénierie des Protéines, Institut de Microbiologie de la Méditerranée, CNRS and Aix-Marseille Université. 31 chemin Joseph Aiguier, 13402 Aix-Marseille Cedex 20, France. (b) Instituto de Catalisis y
Petroleoquimica (CSIC), 28049 Madrid, Spain (c) CEA, DSV, IBEB, Laboratoire de Bioénergétique et Biotechnologie des Bactéries & Microalgues, Saint Paul Lez Durance / CNRS, UMR Biologie Végétale & Microbiologie Environnementales, Saint Paul lez Durance, France / Aix-Marseille Université, Saint Paul lez Durance, France.
ABSTRACT: When enzymes are optimized for
biotech-nological purposes, the goal often is to increase stability or catalytic efficiency. However, many enzymes reversi-bly convert their substrate and product, and if one is in-terested in catalysis in only one direction, it may be ne-cessary to prevent the reverse reaction. In other cases, reversibility may be advantageous because only an en-zyme that can operate in both directions can turn-over at a high rate even under conditions of low thermodynamic driving force. Therefore, understanding the basic me-chanisms of reversibility in complex enzymes should help the rational engineering of these proteins. Here, we focus on NiFe hydrogenase, an enzyme that catalyses H2
oxidation and production, and we elucidate the mechan-ism that governs the catalytic bias (the ratio of maximal rates in the two directions). Unexpectedly, we found that this bias is not mainly determined by redox properties of the active site, but rather by steps which occur on sites of the proteins that are remote from the active site. We evi-dence a novel strategy for tuning the catalytic bias of an oxidoreductase, which consists in modulating the rate of a step that is limiting only in one direction of the reac-tion, without modifying the properties of the active site.
The four Michaelis parameters (two maximal rates and two values of Km) which characterize the forward and
reverse reactions of a one-substrate one-product enzyme are related to each other and to the equilibrium constant of the reaction by the Haldane equation.1 The forward
and reverse maximal rates sometimes differ so much that certain enzymes were designated as "one-way enzymes".2
The origin of such kinetic asymmetry, referred to as "cat-alytic bias", has rarely been investigated. Jencks pro-posed that directionality may result from the destabiliza-tion of the enzyme-substrate complex, which would de-crease the energy required to reach the transition state in the forward direction.2 This „„Circe effect‟‟ is
controver-sial3 and has found no echo in the case of
oxidoreductas-es, whose directionality is always discussed by comparing the potential of the substrate/product redox couple with the potential of either the active site or the redox centers of the electron transfer (ET) chain, when there is one (see examples in supplementary information).
In trying to explain the catalytic bias from a single property of the enzyme (the potential of either the active site or the ET chain), one implicitly assumes that a single redox step, ET either between the substrate and the ac-tive site or to/from an electron relay, determines both maximal rates. However, the catalytic cycle of oxidore-ductases involves various steps (substrate binding, prod-uct release, proton and electron transfers, active-site chemistry) and it may occur that the rate limiting step (rls) is not the same when the enzyme works forward or backward. Two different steps may define the two max-imal rates, and their ratio. Demonstrating that this can occur requires that the rls be defined in both directions in a series of variants that exhibit different catalytic pre-ferences. Hereafter, we do so by characterizing a series of
Desulfovibrio fructosovorans (Df) NiFe hydrogenase
mutants. Previously, we have shown that the WT enzyme catalyzes H2 production and oxidation at similar
maxim-al rates, and that narrowing the substrate channel using site directed mutagenesis has no effect on the maximal rate of H2 oxidation.4,5 Here we show that these
muta-tions slow H2 production up to 100-fold. In redox
titra-tions, the active site of the mutants that have little reduc-tive activity behaves like in the WT enzyme. We use a novel method based on the isotope-exchange assay to determine the rates of H2 release from the active site to
the solvent, and we conclude that this step limits H2
pro-duction whereas H2 entry does not determine the
max-imal rate of H2 oxidation. Conversely, the previous
ob-servation5 that modifying the electron transfer chain
se-lectively slows H2 oxidation shows that electron transfer
limits the rate of H2 oxidation but not H2 production.6
This is the first demonstration, on a specific example, that slowing a step that is rate limiting only when the enzyme works in one direction is a general mechanism for biasing the enzyme in the other direction, indepen-dently of the redox properties of the cofactors.
We prepared the enzyme samples as described pre-viously.5 H2 oxidation rates were measured using a
spec-trophotometric assay at pH 8, 30°C, with 50mM oxidized methyl viologen (MV), under one atm. of H2.5 The Km for
H2 were measured electrochemically.5 The
voltammo-grams in fig 2 were obtained with the enzyme bound to a rotating graphite electrode.7 H2 production was followed
using mass spectrometry (MS), in a solution initially sa-turated with Ar, with a saturating concentration of
duced MV (2mM) at pH 7.2, 30°C; since H2 inhibits H2
-production by NiFe hydrogenases,8 we extrapolated the
initial rates using a plot of 1/rate against 1/[H2]. We
per-formed the H+/D+ exchange experiments at pH 7.2,
30°C,4 and FTIR titrations at pH 8.9
Previous investigations using crystallography and mo-lecular dynamics have predicted that a network of hy-drophobic channels guides H2 to/from the buried active
site of Df NiFe hydrogenase.10 Substituting Leu122 and
Val74, which shape a bottleneck in the channel (fig. 1a), strongly decreases the rates of intramolecular transport of H2, CO and O2 in both directions.4,5 The decrease of
the H2-binding bimolecular rate constant has no effect
on the maximal rate of H2 oxidation obtained by
extra-polation to infinite concentration of H2.5 Furthermore,
the mutations considered below moderately increase the Michaelis constant for H2 (5 to 30-fold for L122F-V74I
and V74M, respectively), but the Michaelis constant is small in the WT (about 10 matm of H2) and these
muta-tions decrease less than 2-fold the H2 oxidation rate
un-der one atm. of H2.5 Hence, substrate binding does not
limit H2 oxidation under 1 atm. of H2 in the WT and in
these mutants.
Figure 1. The structure of Df NiFe hydrogenase (pdb
acces-sion code: 1YQW). Close-ups show the structural elements that are involved in the catalytic cycle: the gas channel (a), the active site (b), a chain of aminoacids that are putatively involved in proton transfer (c), and the FeS clusters that wire the active site to the redox partner (d).
Figure 2 compares electrochemical signals obtained with the WT enzyme and two mutants (L122F-V74I and V74M, pdb 3CUS and 3H3X) attached to rotating-disc graphite electrodes.7,8,11 Hydrogen oxidation and
produc-tion are detected as positive and negative currents in a single experiment where the electrode potential is swept across a wide range. The absolute magnitude of the cur-rent is meaningless because it is proportional to turnover rate times the unknown electroactive coverage, but figure 2 clearly shows that the mutations decrease the ratio of oxidation over reduction currents: unlike the WT, the mutants are biased towards H2 oxidation. This illustrates
that the term "bias" does not refer to "the direction of the reaction", which is imposed by thermodynamics, but to the ratio of rates (here, currents) measured for the same
reaction proceeding in opposite directions. Since the
conditions chosen for the two measurements are differ-ent, the ratio of rates is not an equilibrium constant.12 In
electrochemical experiments, thermodynamics only forces the "open circuit potential" (OCP) to equate the reduction potential of the H+/H2 couple given by the
Nernst equation; it is indeed independent of the enzyme (fig 2).8,11
Figure 2. Bidirectional electrocatalysis by the WT (red),
L122F-V74I (blue) and V74M (green) forms of Df NiFe hy-drogenase. The conditions (10% H2, pH 5.5, 40°C, scan rate
10mV/s, electrode rotation rate 3krpm) ensure that H2
oxi-dation (at high electrode potential) and production (at low potential) are detected in the same experiment. At the open circuit potential (OCP), the rates of oxidation and reduction exactly cancel each other. The blank was recorded with no adsorbed enzyme.
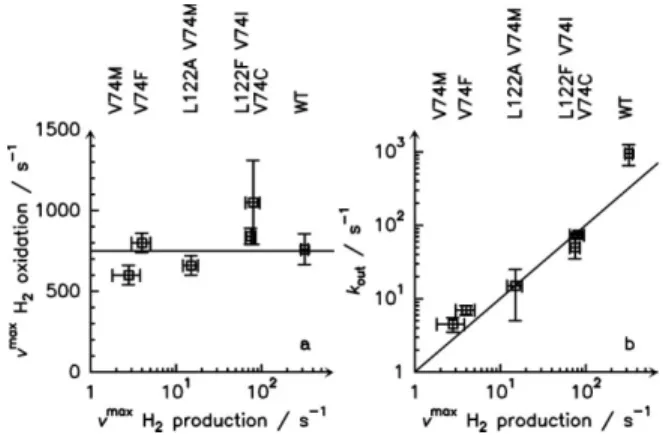
Figure 3. Kinetic properties of the hydrogenase channel
mutants. Panel a shows the maximal rate of H2 oxidation
plotted against the maximal rate of H2 production for 6
forms of the enzyme, and demonstrates that the mutants are biased towards H2 oxidation. Panel b shows the rates of H2
release (measured using eq 1 from experiments such as those in fig 4) against the maximal rates of H2 production,
and demonstrates that the former limits the latter.
The results of solution assays with oxidized or reduced methyl viologen (MV) quantify the bias of the mutants. Figure 3a shows the maximal rates of H2 against the
maximal rates of H2 production. The mutants have the
same oxidation activity as the WT (only V74C is slightly more active9) whereas their maximal H2 production rates
vary by two orders of magnitude. The ratio of maximal rates (oxidation over production) ranges from 2.5 for the WT to 200 for the V74M mutant. Note that the exact
val-ue of this bias is not an intrinsic property of the enzyme: it depends on which reaction is catalyzed (it is not the same for hydrogenase exchanging electrons with MV, an electrode, or its physiological partner), and on the condi-tions that are chosen to measure the two rates.
Table 1. Redox properties of the WT enzyme and two mutants. Ni-A, Ni-B and Ni-SU are inactive forms
of the enzyme, whereas Ni-SI, Ni-C and Ni-R are catalyt-ic intermediates.13 All reduction potentials are in mV vs
SHE. Typical errors are ± 15mV. En-zyme Ni-A/ Ni-SU Ni-B/ Ni-SI Ni-SI/ Ni-C Ni-C/ Ni-R WT -195 -175 -330 -430 V74M -210 -200 -320 -440 V74C -175 -135 -370 -450
To examine whether the decrease in H2 production
ac-tivity was due to a mutation-induced increase in the duction potential of the active site, we compared the re-dox properties of the active site in the WT enzyme and the V74C and V74M mutants. Redox titrations of the active site states of wild type hydrogenase and the mu-tants V74M and V74C were monitored by FTIR in a spec-troelectrochemical cell as described before.9 The FTIR
signatures of these mutants are similar to those of the WT enzyme. Supplementary fig. S1 shows the redox titra-tion of the CO band of the Ni-C state for the three hydro-genases, from which the reduction potentials of the ac-tive site catalytic intermediates could be determined. Table 1 shows the formal reduction potentials of all the active site states. All results are similar, which suggests that the low reductive activities of the mutants are not the consequence of the potential of the active site being shifted upward compared to the WT value.
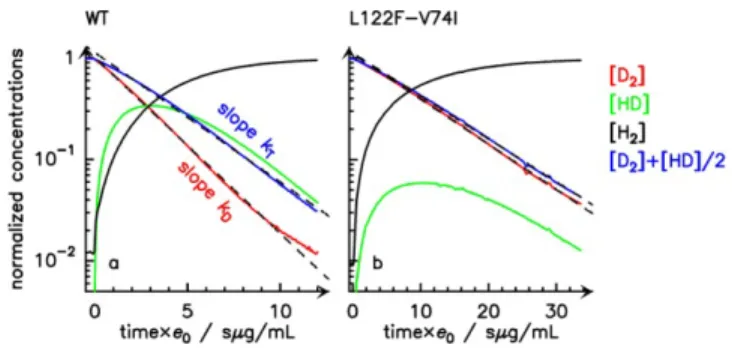
In search of the rate limiting step of H2 production, we
determined the rate constants of H2 release, under the
same conditions as H2 production, using the isotope
ex-change assay, where the enzyme transforms D2 into HD
and eventually H2 using protons from the solvent.4 The
reaction is followed using mass spectrometry (fig 4). As-suming that all diatomic molecules diffuse to the active site with a bimolecular rate constant kin and from the
active site with a 1st-order rate constant kout, and that
H+/D+ exchange at the active site proceeds with a
1st-order rate constant k, we predicted3 that both the
con-centration of D2 and the isotope content T=[D2]+[HD]/2
should decrease exponentially with time, as observed in figure 4, with rates kD and kT, respectively, which depend
on kin, kout, k, e0 (the enzyme concentration) and c0 (the
initial concentration of D2). The analysis that we
pre-viously reported allowed the determination of only the ratio kout/k (ref 4). We now show in supplementary
in-formation that under certain conditions, which apply to the case of Df NiFe hydrogenase, the rate of H2 release
kout can be deduced from the data using eq. 1:
When kout/k is small, little HD is released, kD≈kT (fig
4b), and kout ≈kDc0/e0.
Figure 4. Isotope-exchange assay of the WT (Panel a) and
L122F-V74I mutant (Panel b). The changes in concentra-tions were used to determine kout using eq. 1
We used this method with all above mentioned mu-tants to determine the rates of release of H2 (kout), which
we plotted against the maximal rate of H2 production in
fig 3b (note the log-log scale). All data points are close to the y=x line, demonstrating that H2 production is limited
by H2 release from the active site: the mutants have little
production activity because the channel is obstructed, and H2-diffusion also determines the rate of H2
-production in the WT enzyme.
Conversely, we previously made the same enzyme a better catalyst of H2 production than H2 oxidation by
modifying its ET chain.6 The enzyme has a series of three
FeS clusters, which "wires" the active site to the enzyme's redox partner (fig 1). The surface-exposed (distal from the active site) [4Fe4S] cluster is coordinated by His184; replacement with Gly184 or Cys184 slows H2 oxidation
33 and 60-fold, respectively, whereas the rates of H2
production decrease only 1.3 and 2.1-fold (Table 1 in ref 6). These mutants are biased towards H2 production:
both mutations decrease the ratios of maximal rates (oxidation over production) by a factor of about 27. The H184G mutant has an open coordination site on one Fe ion of the distal cluster; when exogenous imidazole binds to this cluster, the H2-oxidation rate increases from 3%
to 33% of that of the WT, whereas the H2-production rate
is not affected6: binding of imidazole to the distal cluster
of H184G partially repairs the ET chain and restores the native catalytic bias. It has long been suggested that ET limits the rate of H2-oxidation in WT NiFe-hydrogenase14
and this was recently supported by measurements of ET rates in the enzyme from D. fructosovorans.15 That a
modification of the distal cluster biases the enzyme in the direction of H2 production shows that ET is rate limiting
only for H2-oxidation.
Regarding the WT and mutant hydrogenases discussed here, our data show that H2
-
diffusion in the gas channelis the rate limiting step of H2-production but not H2
-oxidation, whereas the latter is limited by electron trans-fer. Altering one of these steps selectively affects one of the two reactions. We therefore evidence a novel me-chanism for tuning the catalytic bias of an oxidoreduc-tase which is independent of the properties of the active
site, but requires that the rls be different under the two
different sets of conditions that are used to drive cataly-sis in one direction and the reverse. This contrasts with
all previous explanations of the catalytic bias of oxidore-ductases (see examples in supplementary information) which proposed that it may be determined by the redox properties of the cofactor(s).
The above results, and previous evidences that en-zymes‟ turnover rates may be limited by steps other than active site chemistry (e.g. proton transfer, electron trans-fer, substrate release or lid-opening16), emphasize the
need to study all steps of the reaction rather than only active site chemistry. Identifying the rls in a catalytic reaction, keeping in mind that active site chemistry may be fast, is a difficult task. Yet this is a prerequisite if one aims at understanding global kinetic properties, such as rate enhancement, proficiency, or bias.
Hydrogenases could be used as H2 oxidation or
pro-duction catalysts in biotechnological devices17 if the
en-zymes that can be produced in large amounts were not inhibited by O2. This has motivated research on the
inhi-bition mechanism, and Df NiFe hydrogenase mutants that proved more resistant to O2 than the WT enzyme
have been characterized; this includes the V74C and V74M mutants studied here.9,18 That mutations which
increase O2 tolerance may also change the catalytic bias
of the enzyme will have to be considered in studies which aim at optimizing this biological catalyst.
ASSOCIATED CONTENT
Complete references 4-6,9,15,18 ; examples of discussions in the literature of what may determine the bias of oxidoreduc-tases ; demonstration of eq 1 ; redox titration curves of the WT and the V74C and V74M mutants. This material is avail-able free of charge via the Internet at http://pubs.acs.org.
AUTHOR INFORMATION
Corresponding Author
christophe.leger@imm.cnrs-mrs.fr, laurent.cournac@ird.fr
Present Addresses
Laurent Cournac: IRD, UMR Eco&Sols, 2 Place Viala, 34060 Montpellier Cedex 02, France.
Author Contributions
AAH, SD and PPL purified the proteins. AAH carried out the electrochemical experiments. AAH, SD, PR and LC carried out all solution assays and analyzed the data. OG and AdL carried out the spectro-electrochemical titrations. PB, LC, MR and CL initiated research. PB, SD and CL wrote the pa-per. All authors have given approval to the final version of the manuscript.
Funding Sources
Our work is funded by the CNRS, CEA, Aix-Marseille Université, ANR, City of Marseilles and Région Provence Alpes Cote d'Azur (PACA) and the Spanish Ministerio de Ciencia (Project CTQ2009-12649). We acknowledge support from the “Pole de compétitivité Capénergie”. AAH thanks the CNRS and Region PACA for funding his PhD.
REFERENCES
[1] (a) Terrell, L. Hill. “Free Energy Transduction in Biology, The Steady State Kinetic and Thermodynamic Formalism,” Academic Press, 1977. ISBN 0-12-348250-X.
(b) Alberty, R. A., J. Am. Chem. Soc. 1953, 75, 1928-1932. [2] Jencks, W. P., Adv Enzymol. Relat. Areas Mol. Biol. 1975,
43, 219-410.
[3] Warshel, A.; Florián, J.; Strajbl, M.; Villà, J., Chembiochem.
2001, 2, 109-111.
[4] Leroux, F. et al., Proc Natl Acad Sci USA. 2008, 105, 11188-11193.
[5] Liebgott, P.P. et al., Nat Chem Biol. 2010, 6, 63-70. [6] Dementin, S. et al., J Am Chem Soc. 2006 128, 5209-5218. [7] Rüdiger, O.; Abad, J. M. ; Hatchikian, E. C. ; Fernandez, V. M.; De Lacey, A. L., J Am Chem Soc. 2005; 127, 16008-16009. [8] Léger, C.; Dementin, S.; Bertrand, P.; Rousset, M.; Guiglia-relli, B.; J Am Chem Soc. 2004, 126, 12162-12172.
[9] Liebgott, P.P. et al., J Am Chem Soc. 2011, 133, 986-997. [10] (a) Montet, Y.; Amara, P.; Volbeda, A.; Vernede, X.; Atchi-kian, E.C.; Field, M. J.; Frey, M.; Fontecilla-Camps, J.-C. Nat.
Struct. Biol. 1997, 4, 523-526.
(b) Wang, P. H.; Best, R.B.; Blumberger, J., J. Am. Chem. Soc,
2011, 133, 3548-3556.
[11] Léger, C.; Bertrand, P. Chem Rev. 2008, 108, 2379-2438. [12] Blackmond, D. G., Angew. Chem. Int. Ed. Engl. 2009, 48, 2648-2654
[13] De Lacey, A.L.; Fernandez, V.M.; Rousset, M.; Cammack, R.; Chem. Rev 2007, 107, 4304-4330.
[14] Pershad, H.R.; Duff, J. L.; Heering, H. A.; Duin, E.C.; Al-bracht, S. P.; Armstrong, F. A., Biochemistry, 1999, 38, 8992-8999.
[15] Dementin, S. et al., J Am Chem Soc. 2011, 133, 10211-10221.
[16] (a) Mikulski, R.L.; Silverman, D. N. Biochim Biophys Acta.
2010, 1804, 422-426.
(b) Hay, S.; Brenner, S.; Khara, B.; Quinn, A. M.; Rigby, S. E. ; Scrutton, N. S.; J Am Chem Soc. 2010, 132, 9738-9745. (c) Tegoni, M.; Silvestrini, M. C.; Guigliarelli, B.; Asso, M.; Bru-nori, M.; Bertrand, P., Biochemistry. 1998; 37, 12761-12771. (d) Fierke, C. A.; Johnson, K. A.; Benkovic, S. J.; Biochemistry
1987, 26, 4085-4092.
(e) Wolf-Watz, M.; Thai, V.; Henzler-Wildman, K.; Hadjipav-lou, G.; Eisenmesser, E. Z.; Kern, D., Nat. Struct. Mol. Biol.
2004, 11, 945-949.
[17] (a) Cracknell, J. A.; Vincent, K. A., Ludwig, M.; Lenz, O.; Friedrich, B.; Armstrong, F. A., J Am Chem Soc 2007 130, 424-425.
(b) Hambourger, M.; Gervaldo, M.; Svedruzic, D.; King, P.W.; Gust, D.; Ghirardi, M.; Moore, A. L.; Moore, T. A., J Am Chem
Soc, 2008, 130, 2015-2022.
[18] Dementin, S. et al., J. Am. Chem. Soc. 2009, 131, 10156-10164.