HAL Id: hal-03200939
https://hal.archives-ouvertes.fr/hal-03200939
Submitted on 18 Apr 2021
HAL is a multi-disciplinary open access
archive for the deposit and dissemination of
sci-entific research documents, whether they are
pub-lished or not. The documents may come from
teaching and research institutions in France or
abroad, or from public or private research centers.
L’archive ouverte pluridisciplinaire HAL, est
destinée au dépôt et à la diffusion de documents
scientifiques de niveau recherche, publiés ou non,
émanant des établissements d’enseignement et de
recherche français ou étrangers, des laboratoires
publics ou privés.
atmosphere: ozone production, precursor sensitivity and
aerosol load
U. Kuhn, L. Ganzeveld, A. Thielmann, T. Dindorf, G. Schebeske, M. Welling,
J. Sciare, G. Roberts, F. Meixner, J. Kesselmeier, et al.
To cite this version:
U. Kuhn, L. Ganzeveld, A. Thielmann, T. Dindorf, G. Schebeske, et al.. Impact of Manaus City
on the Amazon Green Ocean atmosphere: ozone production, precursor sensitivity and aerosol load.
Atmospheric Chemistry and Physics, European Geosciences Union, 2010, 10 (19), pp.9251-9282.
�10.5194/acp-10-9251-2010�. �hal-03200939�
www.atmos-chem-phys.net/10/9251/2010/ doi:10.5194/acp-10-9251-2010
© Author(s) 2010. CC Attribution 3.0 License.
Chemistry
and Physics
Impact of Manaus City on the Amazon Green Ocean atmosphere:
ozone production, precursor sensitivity and aerosol load
U. Kuhn1,*, L. Ganzeveld2,**, A. Thielmann1,***, T. Dindorf1, G. Schebeske1, M. Welling1, J. Sciare1,****,
G. Roberts1,*****, F. X. Meixner1,8, J. Kesselmeier1, J. Lelieveld2, O. Kolle3, P. Ciccioli4, J. Lloyd5,
J. Trentmann6,******, P. Artaxo7, and M. O. Andreae1
1Max Planck Institute for Chemistry, Biogeochemistry Dept., Mainz, Germany 2Max Planck Institute for Chemistry, Atmospheric Chemistry Dept., Mainz, Germany 3Max Planck Institute for Biogeochemistry, Jena, Germany
4Istituto di Metodologie Chimiche, Area delle Ricerca di Roma, Monterot, Scalo, Italy 5Earth and Biosphere Institute, School of Geography, University of Leeds, UK 6Institute for Atmospheric Physics, Johannes Gutenberg University Mainz, Germany 7Instituto de F´ısica da Universidade de S˜ao Paulo, S˜ao Paulo, Brazil
8Physics Dept., University of Zimbabwe, Harare, Zimbabwe
*now at: Agroscope Reckenholz-T¨anikon Research Station ART, Zurich, Switzerland
**now at: Department of Environmental Sciences, Wageningen University and Research Centre, Wageningen,
The Netherlands
***now at: Siemens AG, Environmental Systems and Services, Erlangen, Germany
****now at: Laboratoire des Sciences du Climat et de l’Environnement, Gif-sur-Yvette, France
*****now at: Scripps Institution of Oceanography, Center for Atmospheric Sciences and Physical Oceanography,
La Jolla, CA, USA
******now at: German Weather Service (DWD), Offenbach, Germany
Received: 21 January 2010 – Published in Atmos. Chem. Phys. Discuss.: 25 May 2010 Revised: 30 August 2010 – Accepted: 6 September 2010 – Published: 1 October 2010
Abstract. As a contribution to the Large-Scale
Biosphere-Atmosphere Experiment in Amazonia – Cooperative LBA Airborne Regional Experiment (LBA-CLAIRE-2001) field campaign in the heart of the Amazon Basin, we analyzed the temporal and spatial dynamics of the urban plume of Man-aus City during the wet-to-dry season transition period in July 2001. During the flights, we performed vertical stacks of crosswind transects in the urban outflow downwind of Manaus City, measuring a comprehensive set of trace con-stituents including O3, NO, NO2, CO, VOC, CO2, and H2O.
Aerosol loads were characterized by concentrations of total aerosol number (CN) and cloud condensation nuclei (CCN), and by light scattering properties. Measurements over pris-tine rainforest areas during the campaign showed low
lev-Correspondence to: U. Kuhn
(uwe.kuhn@art.admin.ch)
els of pollution from biomass burning or industrial emis-sions, representative of wet season background conditions. The urban plume of Manaus City was found to be joined by plumes from power plants south of the city, all showing ev-idence of very strong photochemical ozone formation. One episode is discussed in detail, where a threefold increase in ozone mixing ratios within the atmospheric boundary layer occurred within a 100 km travel distance downwind of Man-aus. Observation-based estimates of the ozone production rates in the plume reached 15 ppb h−1.
Within the plume core, aerosol concentrations were strongly enhanced, with 1CN/1CO ratios about one or-der of magnitude higher than observed in Amazon biomass burning plumes. 1CN/1CO ratios tended to decrease with increasing transport time, indicative of a significant reduc-tion in particle number by coagulareduc-tion, and without substan-tial new particle nucleation occurring within the time/space observed. While in the background atmosphere a large
fraction of the total particle number served as CCN (about 60–80% at 0.6% supersaturation), the CCN/CN ratios within the plume indicated that only a small fraction (16 ± 12 %) of the plume particles were CCN. The fresh plume aerosols showed relatively weak light scattering efficiency. The CO-normalized CCN concentrations and light scattering coeffi-cients increased with plume age in most cases, suggesting particle growth by condensation of soluble organic or inor-ganic species.
We used a Single Column Chemistry and Transport Model (SCM) to infer the urban pollution emission fluxes of Man-aus City, implying observed mixing ratios of CO, NOx and
VOC. The model can reproduce the temporal/spatial distri-bution of ozone enhancements in the Manaus plume, both with and without accounting for the distinct (high NOx)
con-tribution by the power plants; this way examining the sensi-tivity of ozone production to changes in the emission rates of NOx. The VOC reactivity in the Manaus region was
dominated by a high burden of biogenic isoprene from the background rainforest atmosphere, and therefore NOx
con-trol is assumed to be the most effective ozone abatement strategy. Both observations and models show that the ag-glomeration of NOxemission sources, like power plants, in
a well-arranged area can decrease the ozone production ef-ficiency in the near field of the urban populated cores. But on the other hand remote areas downwind of the city then bear the brunt, being exposed to increased ozone production and N-deposition. The simulated maximum stomatal ozone uptake fluxes were 4 nmol m−2s−1close to Manaus, and
de-creased only to about 2 nmol m−2s−1within a travel distance >1500 km downwind from Manaus, clearly exceeding the critical threshold level for broadleaf trees. Likewise, the sim-ulated N deposition close to Manaus was ∼70 kg N ha−1a−1 decreasing only to about 30 kg N ha−1a−1after three days of simulation.
1 Introduction
Tropical regions play a central role in the budgets of trace gases and aerosols of the Earth’s atmosphere, as well as in the absorption of solar energy and its transfer into the cli-mate system. In particular, the vast regions of highly active terrestrial ecosystems in the wet tropics have a pronounced influence on the global carbon cycle and the atmospheric bur-dens of other greenhouse gases. They are also large sources of reactive trace gases, which figure prominently in the at-mospheric oxidation cycle (Crutzen, 1987). The tropical re-gion of South America, with the Amazon Basin at its heart, contains the world’s largest area of humid tropical forest and savanna, much of which is undergoing profound changes due to human activities (Betts et al., 2008). This is underscored by estimates that tropical human populations are among the fastest growing on earth (Oke, 1986). Many of the urban
ar-eas in the tropics are expanding rapidly, and well-governed densely populated settlements can reduce the need for land conversion and provide proximity to infrastructure and ser-vices (Molina and Molina, 2004). However, increasing in-dustrialisation and motorisation have also resulted in higher demand for energy, greater use of fossil fuels, and severe in-creases in the emissions of pollutants into the atmosphere, with resulting adverse impacts on air quality. Amongst the most important anthropogenic pollutants are nitrogen ox-ides (NOx= sum of nitric oxide [NO] and nitrogen dioxide
[NO2]), volatile organic compounds (VOCs), carbon
monox-ide (CO) and aerosols, all of which drive the formation of photochemical smog and control the photochemical produc-tion of tropospheric ozone (O3) and the hydroxyl radical
(OH). These oxidants play a key role in determining the oxi-dizing power of the global atmosphere, and thus the capacity of the atmosphere to cleanse itself; while on the other hand their build-up by photochemical air pollution may threaten both human and ecosystem health on regional and continen-tal scales. The major part of the oxidation of long-lived gases by OH takes place in the tropics, where high UV and hu-midity promote the formation of OH from photolysis of O3
(Logan et al., 1981; Thompson, 1992; Lelieveld et al., 2008). By combining high background VOC mixing ratios in a sunny, hot, and humid environment the tropical rainforest en-vironment is predestined to lead to strong ozone formation when exposed to anthropogenic NOx. A key issue in
devel-oping an effective emission-based O3 control strategy is to
understand the non-linear relationship between O3formation
and its precursors in the urban outflow, and to evaluate the sensitivity of O3formation to any emission reduction of its
anthropogenic precursors. Recently, numerical models have been applied to study photochemical oxidants in Brazilian ar-eas (Freitas et al., 2005; Dallarosa et al., 2007), but data are available only very sparsely for urban conditions within the “Great Chemical Reactor” of the Amazon basin (Andreae, 2001).
The importance of biogenic background VOC for ur-ban photochemical smog has already been highlighted by Chameides et al. (1988) for the Atlanta case. Since cities like Manaus lie within the largest terrestrial sources of bio-genic VOC (Guenther et al., 1995), there are global scale motivations for characterizing their local atmospheric chem-istry. While in the absence of anthropogenic NOxemissions,
biogenic VOC are considered to contribute little to ozone for-mation (or may even lead to a reduction in ambient ozone mixing ratios), it is common knowledge that the photooxi-dation of isoprene in the presence of sufficient NOxresults
in formation of ozone and can give rise to strongly elevated ozone levels in both urban and rural environments in sum-mer (Trainer et al., 1987; Chameides et al., 1992; Biesenthal et al., 1997; Starn et al., 1998; Roberts et al., 1998; Wied-inmyer et al., 2001). The polluted outflow plume of Manaus City enters the otherwise unpolluted atmosphere of the trop-ical rainforest (dubbed “green ocean air” by Williams et al.,
2002), where NOxlevels are near the crossover point from
net loss of O3 to net production. Anthropogenic injection
of NOxinto the remote background air is assumed to have
a strong impact on the O3 abundance in the near field
(ur-ban area) as well as in the far field (downwind remote ar-eas). Moreover, recent results show that high uncertainties in the mechanisms and products of important reactions of oxi-dants in the tropical atmosphere still exist (Kuhn et al., 2007; Lelieveld et al., 2008).
Urban photochemical smog episodes are also accompa-nied by high aerosol loads, with potential negative impacts on human health (Pope and Dockery, 2006). Traffic and power plants are main sources of urban particulate matter by directly emitting particles and gaseous precursors that further react and form condensable material (EPA AP-42; http://www.epa.gov/ttnchie1/ap42/). Presumably high rad-ical levels associated with photochemrad-ical smog in urban plumes favour the formation of secondary aerosols, both in-organic and in-organic, which on the other hand modify the oxidation efficiency of the atmosphere by way of heteroge-neous reactions. Because of the large biogenic background sources of VOC, which act as key precursors for SOA forma-tion, a potentially important production of secondary organic aerosol (SOA) is anticipated for tropical urban plumes. In addition to the recognized role of biogenic monoterpenes in SOA formation (e.g., Kavouras et al., 1999), recent studies also suggest the importance of isoprene (e.g., Claeys et al., 2004; Kroll et al., 2006). Photochemistry and aerosol forma-tion are coupled in terms of (i) the influence of aerosols on the radiation properties (scattering/absorption of sunlight), and (ii) the reaction of radicals with the aerosol surface or within water droplets. Specifically the temporal and spa-tial distribution of these pollutants with respective changes in their chemical, physical and optical properties are very com-plex and currently not well characterized.
The indirect radiative effects of aerosols through their role in cloud formation are complex and contribute the largest uncertainty in radiative forcing calculations (IPCC, 2007; Rosenfeld et al., 2008). The chemical and physical charac-teristics of smoke and biogenic aerosols over Amazonia and their effects on cloud microphysics have been investigated in previous campaigns (Roberts et al., 2001, 2003; Andreae, 2009; Andreae et al., 2004; Freud et al., 2008; Martin et al., 2010a; Gunthe et al., 2009; Rissler et al., 2004; Fuzzi et al., 2007; Vestin et al., 2007; Artaxo et al., 2002). These studies have shown that under unpolluted conditions aerosol and cloud condensation nuclei (CCN) concentrations over the Amazon are very low (of the order of 100–400 cm−3), but
can be increased by as much as two orders of magnitude dur-ing the biomass burndur-ing season. Under the low-aerosol con-ditions that prevail over pristine Amazon forest, even modest additions of CCN can lead to pronounced changes in cloud properties (Andreae et al., 2004; Freud et al., 2008). Urban emissions therefore have the potential to cause significant modifications in cloud properties in the downwind region. So
far, the CCN properties of urban aerosols in South America have not yet been investigated. The existence of an isolated plume in an otherwise very pristine environment downwind of Manaus offers the possibility to investigate the evolution of the aerosols over several hours following emission.
While anthropogenic emissions are concentrated in urban areas, the ozone deposition rates as well as the emission of biogenic VOC can be reasonably assumed to be lower due to the reduced amount of vegetation. City islands also affect vertical transport and mixing depending e.g., on soil mois-ture, roughness, anthropogenic heat production, and hence the surface energy balance, which by itself may cause sub-stantial changes in the concentrations of atmospheric trace constituents. The effect of a strong convective system pass-ing through the urban plume of Manaus was studied based on airborne measurements by Pickering et al. (1992), focussing on an isolated event at a distance of 50 km downwind of Manaus City. It has been shown that convective transport away from the surface enables precursor VOCs and NOxto
achieve their full ozone generating potential, and that dilu-tion from the boundary layer into a free tropospheric col-umn may significantly increase the net ozone yields (Liu et al., 1987; Lin et al., 1988; Pickering et al., 1990; Lelieveld and Crutzen, 1994). Local ground-based observations may thus be inadequate to understand the net effects of the urban perturbation, e.g., since ozone production at the surface ac-counts only for a small fraction of the total ozone column. Conditions at a surface site will only be representative for a large part of the ozone production if the site is not affected by local emissions and at times when strong vertical mixing is established (Spirig et al., 2002).
During the LBA-CLAIRE-2001 campaign, we used air-borne measurements downwind of Manaus City to in-vestigate the temporal and spatial dynamics of the ur-ban plume. The LBA-CLAIRE-2001 campaign forms part of a series of integrated airborne and ground-based cam-paigns, the Cooperative LBA Airborne Regional Experiment (LBA-CLAIRE), which in turn is part of the Large-Scale Biosphere-Atmosphere Experiment in Amazonia (LBA). Specific goals of the campaign included quantifying the spa-tial distribution and transport processes of the urban plume, and analyzing pollutant mixing ratios and chemical transfor-mation within the plume. The results are used to examine the impacts of urbanization on the net exchange and atmospheric chemistry of important gases and aerosols, and to provide scientific insights in the potential consequences and efficien-cies of emission abatement strategies.
2 Experimental
2.1 Instrumentation
For LBA-CLAIRE-2001, the twin-engine turboprop Em-braer Bandeirante EMB-110B1, operated by the Brazilian
National Institute for Space Research (INPE, Instituto Na-cional de Pesquisas Espaciais) was equipped with a suite of instruments for the measurement of gaseous compounds and aerosols. A variety of inlet tubes were assembled with their inlet ends forward of the engines.
Nitric oxide (NO) was measured by chemiluminescence using a CLD 780 TR (ECO PHYSICS AG, Switzerland). A precision of 5% was computed for a 1 s integration time from the standard deviation during the NO calibration. The perfor-mance of the instrument is governed by its background sig-nal, which was monitored frequently during each flight. The detection limit of the instrument was 30 ppt, determined from the standard deviation during the zero calibrations. Nitrogen dioxide (NO2)is detected as NO by the same detector,
af-ter conversion by photolysis (ECO PHYSICS PLC 760) up-stream of the NO detector. Photolysis is by far more selective than conventional catalytic conversion of NO2(McClenny et
al., 2002). A drawback of using photolysis is the need for calibration, as the conversion efficiency is not unity. This ef-ficiency was determined as 0.41. The precision, determined in the same way as for NO, was 150 ppt.
Ozone (O3)was measured with a resolution of 10 s with
a UV-absorption instrument (Model 49C, Thermo Environ-ment InstruEnviron-ments Inc., USA). The precision was 1 ppb, in-ternal pressure and temperature corrections were verified by tests in the laboratory. Carbon monoxide (CO) was mea-sured with a 1 s resolution by UV resonance fluorescence, us-ing a Fast-CO-Monitor (Model AL 5002, Aerolaser GmbH, Germany). Prior to measurement, the air was dried using a Nafion drier. In flight, zero and span calibrations were made to account for instrumental drift associated with vary-ing pressure and temperature. The precision of the 1 Hz data was 1.5%, and the accuracy was estimated to be better than 5% (Guyon et al., 2005). Carbon dioxide (CO2)was
mea-sured with a resolution of 1 Hz using a LICOR (model LI 6251) infrared gas analyzer. The sampled air was dried with magnesium perchlorate prior to analysis. The precision after applying temperature and pressure corrections was estimated to be ± 0.4 ppm (for details see Lloyd et al., 2001, 2007).
The aircraft was equipped with a GPS (Garmin), and the outside air pressure, temperature and relative humidity were measured using a Vaisala PTB101B pressure transducer, and a Vaisala HMP35D temperature-humidity-probe, mounted on the bottom of the airplane behind the gas inlet tubes (di-rectly in the airstream).
VOC grab samples within the plume (5–7 min sampling interval) were collected on solid adsorbent cartridges us-ing an automated sampler and subsequent off-line analy-sis in the lab (Kuhn et al., 2005). Sample collection start time and period for plume transects were selected accord-ing to the online readaccord-ings of the CO instrument. Two dif-ferent sampling/analysis systems were used simultaneously. GC/FID samples were collected on fused silica-lined stain-less steel cartridges with 2-bed graphitic carbon adsorbents (130 mg Carbograph 1, followed by 130 mg Carbograph 5;
Lara s.r.l., Rome, Italy) and analyzed using a thermal desorp-tion gas chromatograph with a flame ionizadesorp-tion detector as described in Kuhn et al. (2002, 2004a). Calibration was ac-complished by use of different gaseous standards containing isoprene, several n-alkanes, methyl vinyl ketone (MVK), and methacrolein (MACR). The detection limit was estimated as the greater of the variability in the blank levels (at the 95% confidence level, i.e., 1.96 times the standard deviation of all blank values), or a chromatographic peak three times the standard deviation of the background noise in the base line of the chromatograph. Variability in the blank usually de-termined the detection limit, which was typically 30 ppt for isoprene and 10 ppt for monoterpenes. Overall uncertainties were ± 10% for isoprene at 1 ppb and ranged from ± 5 to
±30% at 100 ppt for monoterpenes, depending on the in-dividual monoterpene peak resolution and blank variability. GC/MS samples were collected on glass cartridges with 3-bed graphitic carbon adsorbents samples (118 mg Carbopack C, Supelco, Bellefonte, USA, followed by 60 mg Carbograph 1 and 115 mg Carbograph 5, Lara s.r.l., Rome, Italy). These were analyzed by thermal desorption gas chromatography with mass spectrometric analysis (GC-MS). The detection limits and precision were in the same range as for GC-FID analysis.
Total aerosol number concentrations (CN) were measured at 1 Hz time resolution by a TSI 3010 condensation parti-cle counter (CPC; TSI Incorporated, Minnesota, USA). The sampling flow of the CPC was controlled by a capillary tube, adjusted for pressure and temperature of the sampled air, and the number concentrations corrected using the calcu-lated flow. The data were corrected for coincidence using the manufacturer’s suggested equation. Guyon et al. (2005) showed in a subsequent campaign that, compared to the num-ber size distribution of smoke particles measured simultane-ously with a scanning mobility particle sizer (SMPS 3080, TSI Incorporated, Shoreview, Minnesota, USA), the num-ber concentration of particles ranging 8–300 nm in diameter measured by the CPC comprised at least 95% of the total population. Overall uncertainties are estimated to be ca. 5%, including the potential effect of inlet losses of particles in the size range 300–500 nm at higher altitudes. On some of the flights, particle concentrations >10.000 cm−3 could not be stored due to signal saturation in the datalogger. Such con-centrations typically occurred in the middle of the Manaus plume, so that for these flights only the data measured at the boundaries of the plume core could be used to retrieve CN numbers.
CCN concentrations at 0.6% supersaturation (SS), indi-cated as CCN0.6, were measured using a static
thermal-gradient chamber as described by Roberts et al. (2001, 2003) with a time resolution of 35 s. The calibration procedure in-volved generating a quasi-monodispersed aerosol of a known concentration and composition, and counting the number of activated droplets. An error analysis from calibration measurements indicates that for typical aerosol spectra, the
overall measurement error in number concentrations is ap-proximately ± 20%. Aerosol scattering coefficients at 450, 440, and 700 nm were obtained using a TSI 3563 nephelome-ter. Aerosols were sampled in the same fashion as for the CPC measurements, and the data were stored on the datalog-ger at a 1 Hz resolution (Chand et al., 2005). Particle number concentration and all other aerosol particle parameters have been normalized to a standard air pressure (1000 hPa) and temperature (273.15 K).
2.2 Measuring site and meteorological conditions
At the time of the campaign in 2001, Manaus City was esti-mated to have about 1.2 million human inhabitants. The to-tal energy consumption of 570 GW, mainly supplied by three thermoelectric power plants placed in a common facility in the Mauzinho district (3.12◦S, 59.93◦W) and another plant
in the Aparecida district (3.13◦S, 60.03◦W), were all located
at the southern edge of Manaus City (Manaus Energy Inc.; see Fig. 1). A total of 255 000 vehicles were estimated to be being operated in Manaus at the time (F. Luiz˜ao, DETRAN, personal communication, 2006). Other major sources of emissions in Manaus are saw mills burning timber residues and small-scale residential burnings. On the peninsula be-tween the Solimoes and Rio Negro rivers south of Manaus, there are a number of charcoal kilns and brick factories fu-elled with charcoal and wood.
The LBA-CLAIRE-2001 campaign was carried out in the wet-to-dry season transition in July 2001, when the Inter-Tropical Convergence Zone was located at ca. 6◦N.
Aver-age yearly rainfall in Manaus is 2200 mm with two marked seasons (November–May wet; June–October dry). Although highly variable, rainfall is present throughout the year. Rain-forest ecosystem characteristics of the Manaus area are de-scribed in detail in Andreae et al. (2002) and Kuhn et al. (2007).
The air flow during the airborne measurements was dom-inated by easterly trade winds in the lowest 5 km of the at-mosphere, which transported humid oceanic air masses from the Atlantic more than 1000 km over vast expanses of largely undisturbed rain forest of the Amazon Basin, before reaching the urban area of Manaus (Dias et al., 2002). During part of the campaign, the airmasses had travelled over biomass burn-ing regions in the states of Maranh˜ao, Goi´as, Piau´ı, Cear´a, and eastern parts of Par´a (9 July, ∼16:00 UTC to 16 July,
∼14:00 UTC; determined using trajectories with 500 m level arrival height at Manaus). Fires were frequently detected within these states by satellite remote sensing (NOAA12 and NOAA14; see Fig. 1 in Rissler et al., 2004). The transport time from the biomass burning source region to our mea-surement region was 2.5–5 days. The cleanest conditions were found during the period 16 July (after ∼16:00 UTC) to 19 July. The concentrations of CO and aerosols in the re-gional background atmosphere (i.e., outside the Manaus
ur-Manaus City
Manaus
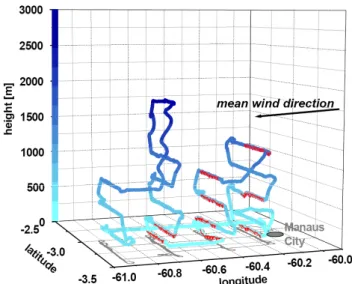
Fig. 1. Land cover image (GOOGLE EARTH) with an overlay of
the flight pattern of Flight #18 on 19 July 2001 at 10.00–14:00 LT (GPS data, green line), the path of the SCM model (white line, the blue colour indicates where surface characteristics in the SCM are changed to city conditions), and the output of a HYSPLIT disper-sion model run indicated by the red/orange contour lines (based on meteorological REANALYSIS dataset for the time of the flight period, i.e., start time in Manaus City (−3.08◦, −60.01◦) was 10:00 LT, with 4 h total run time in the 0–1500 m level). The 2 yel-low pins within Manaus City indicate the areas where power plants are located (3 PP with >560 MW in the southeast, and 1 PP with
>125 MW in the southwest of the city). The overview map shows the location of Manaus within the Amazon rain forest (South Amer-ica).
ban plume and occasional regional biomass smoke plumes) are summarized in Table 1.
Here we mainly focus on one particular flight carried out on midday of 19 July 2001 (at 10:00–14:00 LT; hereafter de-fined as Flight #18), being that with the most comprehen-sive data set for the analysis of the Manaus plume available. Where appropriate, data from other flights are also presented. Weather conditions during Flight #18 were mostly sunny, but with intermittent clouds. Wind conditions were char-acterized by relatively strong mean horizontal wind speed, with 3–5 m s−1 measured on a 52 m walk-up scaffolding tower (ca. 20 m above the forest canopy, K34, 2◦3503300S, 60◦1202700W), which was located on a medium-sized plateau about 60 km NNW of the city of Manaus. The mean wind speed within the entire CBL (0–1500 m level) was derived from the HYSPLIT dispersion model constrained with re-analyzed meteorological data for this period, and was about 10 m s−1, which is characteristic for the storm-intensive pe-riods of the wet season. Crutzen et al. (1985) computed dry season average velocities of 7 m s−1at 850 hPa and Andreae et al. (1988) presented similar results. At the surface tower site, wind direction was predominantly from the east, ranging between 90–104◦during the flight period.
The land cover map in Fig. 1 shows that the plume passed the Rio Negro river over an expanse of ca. 12 km, before
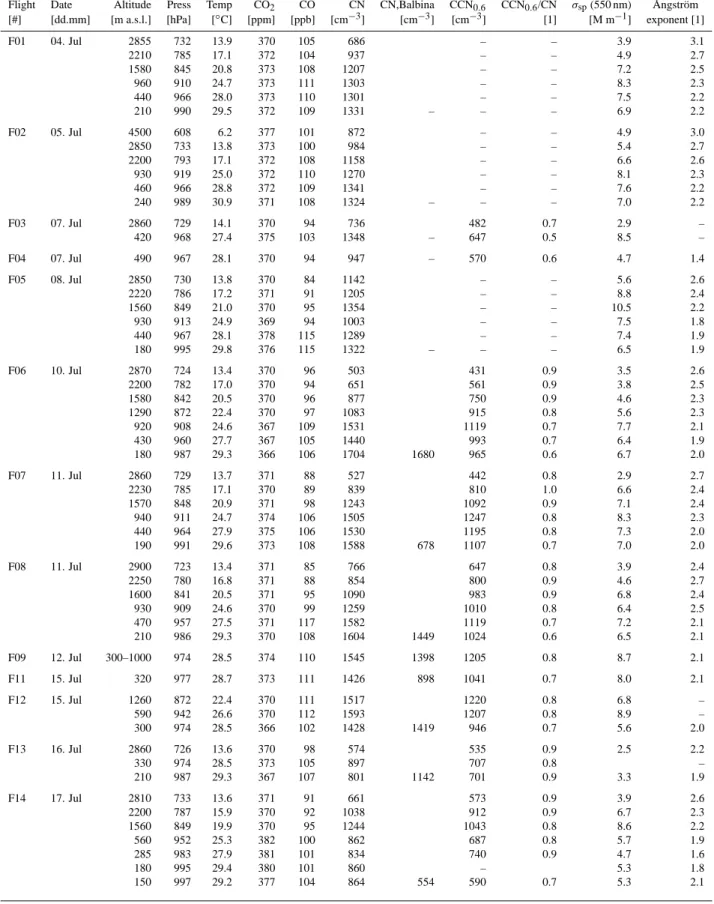
Table 1. Complete set of measurements of long-lived trace gases and aerosols in the regional background atmosphere (outside the Manaus
urban plume and occasional regional biomass smoke plumes) during LBA-CLAIRE-2001. CN Balbina refers to CN concentrations measured simultaneously at the Balbina ground-based site. σsp(550 nm) is the scattering coefficient at 550 nm wavelength. All concentrations and scattering coefficients have been normalized to standard conditions in dry air (273.15 K, 1000 hPa).
Flight Date Altitude Press Temp CO2 CO CN CN,Balbina CCN0.6 CCN0.6/CN σsp(550 nm) Angstr¨om˚
[#] [dd.mm] [m a.s.l.] [hPa] [◦C] [ppm] [ppb] [cm−3] [cm−3] [cm−3] [1] [M m−1] exponent [1]
F01 04. Jul 2855 732 13.9 370 105 686 – – 3.9 3.1 2210 785 17.1 372 104 937 – – 4.9 2.7 1580 845 20.8 373 108 1207 – – 7.2 2.5 960 910 24.7 373 111 1303 – – 8.3 2.3 440 966 28.0 373 110 1301 – – 7.5 2.2 210 990 29.5 372 109 1331 – – – 6.9 2.2 F02 05. Jul 4500 608 6.2 377 101 872 – – 4.9 3.0 2850 733 13.8 373 100 984 – – 5.4 2.7 2200 793 17.1 372 108 1158 – – 6.6 2.6 930 919 25.0 372 110 1270 – – 8.1 2.3 460 966 28.8 372 109 1341 – – 7.6 2.2 240 989 30.9 371 108 1324 – – – 7.0 2.2 F03 07. Jul 2860 729 14.1 370 94 736 482 0.7 2.9 – 420 968 27.4 375 103 1348 – 647 0.5 8.5 – F04 07. Jul 490 967 28.1 370 94 947 – 570 0.6 4.7 1.4 F05 08. Jul 2850 730 13.8 370 84 1142 – – 5.6 2.6 2220 786 17.2 371 91 1205 – – 8.8 2.4 1560 849 21.0 370 95 1354 – – 10.5 2.2 930 913 24.9 369 94 1003 – – 7.5 1.8 440 967 28.1 378 115 1289 – – 7.4 1.9 180 995 29.8 376 115 1322 – – – 6.5 1.9 F06 10. Jul 2870 724 13.4 370 96 503 431 0.9 3.5 2.6 2200 782 17.0 370 94 651 561 0.9 3.8 2.5 1580 842 20.5 370 96 877 750 0.9 4.6 2.3 1290 872 22.4 370 97 1083 915 0.8 5.6 2.3 920 908 24.6 367 109 1531 1119 0.7 7.7 2.1 430 960 27.7 367 105 1440 993 0.7 6.4 1.9 180 987 29.3 366 106 1704 1680 965 0.6 6.7 2.0 F07 11. Jul 2860 729 13.7 371 88 527 442 0.8 2.9 2.7 2230 785 17.1 370 89 839 810 1.0 6.6 2.4 1570 848 20.9 371 98 1243 1092 0.9 7.1 2.4 940 911 24.7 374 106 1505 1247 0.8 8.3 2.3 440 964 27.9 375 106 1530 1195 0.8 7.3 2.0 190 991 29.6 373 108 1588 678 1107 0.7 7.0 2.0 F08 11. Jul 2900 723 13.4 371 85 766 647 0.8 3.9 2.4 2250 780 16.8 371 88 854 800 0.9 4.6 2.7 1600 841 20.5 371 95 1090 983 0.9 6.8 2.4 930 909 24.6 370 99 1259 1010 0.8 6.4 2.5 470 957 27.5 371 117 1582 1119 0.7 7.2 2.1 210 986 29.3 370 108 1604 1449 1024 0.6 6.5 2.1 F09 12. Jul 300–1000 974 28.5 374 110 1545 1398 1205 0.8 8.7 2.1 F11 15. Jul 320 977 28.7 373 111 1426 898 1041 0.7 8.0 2.1 F12 15. Jul 1260 872 22.4 370 111 1517 1220 0.8 6.8 – 590 942 26.6 370 112 1593 1207 0.8 8.9 – 300 974 28.5 366 102 1428 1419 946 0.7 5.6 2.0 F13 16. Jul 2860 726 13.6 370 98 574 535 0.9 2.5 2.2 330 974 28.5 373 105 897 707 0.8 – 210 987 29.3 367 107 801 1142 701 0.9 3.3 1.9 F14 17. Jul 2810 733 13.6 371 91 661 573 0.9 3.9 2.6 2200 787 15.9 370 92 1038 912 0.9 6.7 2.3 1560 849 19.9 370 95 1244 1043 0.8 8.6 2.2 560 952 25.3 382 100 862 687 0.8 5.7 1.9 285 983 27.9 381 101 834 740 0.9 4.7 1.6 180 995 29.4 380 101 860 – 5.3 1.8 150 997 29.2 377 104 864 554 590 0.7 5.3 2.1
Table 1. Continued.
Flight Date Altitude Press Temp CO2 CO CN CN,Balbina CCN0.6 CCN0.6/CN σsp(550 nm) Angstr¨om˚
[#] [dd.mm] [m a.s.l.] [hPa] [◦C] [ppm] [ppb] [cm−3] [cm−3] [cm−3] [1] [M m−1] exponent [1]
F15 17. Jul 3840 645 9.1 371 82 584 359 0.6 4.3 2.2 2840 727 13.8 370 86 658 549 0.8 2.0 1.1 2210 783 16.9 370 89 762 717 0.9 3.3 1.0 1570 844 20.0 369 91 904 817 0.9 6.4 2.2 900 912 24.3 367 90 961 783 0.8 5.7 1.8 420 962 28.0 366 92 948 677 0.7 5.2 1.8 170 991 29.3 364 – 906 768 621 0.7 5.3 1.4 F16 18. Jul 2850 727 14.2 369 74 478 273 0.6 3.2 2.5 2190 786 18.0 370 75 492 264 0.5 – – 1560 846 21.0 369 74 786 379 0.5 – – 910 913 23.8 371 77 697 450 0.6 4.3 1.4 450 962 27.7 374 81 694 415 0.6 4.1 1.7 180 991 30.8 372 82 713 – 383 0.5 3.7 2.0 F17 18. Jul 2870 724 14.3 370 72 411 249 0.6 2.8 3.8 180 989 32.2 367 83 782 817 490 0.6 2.3 0.6 F18 19. Jul 1950 808 19.3 369 70 387 267 0.7 3.6 1.6 1230 880 22.5 368 74 1011 704 0.7 4.0 1.9 910 911 24.8 369 74 1143 756 0.7 4.4 1.7 600 945 27.2 370 78 1227 692 0.6 5.1 1.8 290 980 29.1 370 78 1243 1047 572 0.5 5.4 1.4 F19 19. Jul 940 907 26.3 369 79 936 602 0.6 – – 290 976 32.0 369 78 951 984 640 0.7 – – F20 20. Jul 2900 730 16.1 369 75 692 392 0.6 – – 2250 782 18.4 369 77 965 679 0.7 – – 1600 843 21.4 370 85 1421 706 0.5 – – 930 906 25.0 372 90 1196 750 0.6 – – 470 956 28.8 373 90 1144 728 0.6 – – 240 974 30.2 372 89 1149 1073 611 0.5 – – F21 20. Jul 2900 726 15.6 370 79 698 465 0.7 – – 2250 781 17.2 371 91 1038 832 0.8 – – 1600 830 21.0 371 94 1141 858 0.8 – – 930 909 26.9 370 98 1240 840 0.7 – – 470 955 31.1 370 98 1254 698 0.6 – – 220 984 33.2 369 99 1310 1555 791 0.6 – –
travelling over a region that is comprised of a mix of rainfor-est and wetlands. Typical back-trajectories for this site and time period (5–17 July 2001) are shown in Kuhn et al. (2007), revealing footprint areas upwind of Manaus predominantly of pristine rainforest. Previous measurements in the Ama-zon Basin have shown that radiative cooling at dusk results in the formation of a shallow, decoupled nocturnal bound-ary layer over the forest, whilst heating of the surface in the morning causes a well mixed CBL to develop at a vertical growth rate of ca. 10 m min−1(Garstang et al., 1988). The CBL heights, deduced from different airborne vertical profile measurements of potential temperature and other trace con-stituents during LBA-CLAIRE-2001, ranged between 500 and 1400 m (Kuhn et al., 2007), and were within the typi-cal mixed layer heights that are expected above Amazonian tropical forests (Dias et al., 2002; Fisch et al., 2004).
2.3 Flight track
Figure 1 shows a 2-D map of the flight pattern of Flight #18 overlaying the Manaus area land cover image, and also in-cluding the output of the HYSPLIT plume dispersion model for the time period of the airborne measurements (starting 10:00 LT, with 4 h run time). The latter closely resembles the observations as will be shown below. For better visualization of the flight track, a 3-D diagram with colour-coded flight altitudes and including the VOC cartridge sampling periods in some of the plume crosswind transects is given in Fig. 2. After takeoff at the airport of Manaus, the flight pattern was designed to conduct a Lagrangian experiment with a series of vertical profiles (3–6 crosswind transects each) at successive distances (10, 40, 70 and 100 km) in the plume downwind of Manaus City. This way the aircraft was able to sample plume air masses with progressively increasing photochem-ical ages. Each of the 18 consecutive plume transects was
Copernicus Publications Bahnhofsallee 1e 37081 Göttingen Germany
Martin Rasmussen (Managing Director) Nadine Deisel (Head of Production/Promotion)
Contact publications@copernicus.org http://publications.copernicus.org Phone +49-551-900339-50 Fax +49-551-900339-70 Legal Body Copernicus Gesellschaft mbH Based in Göttingen Registered in HRB 131 298 County Court Göttingen Tax Office FA Göttingen USt-IdNr. DE216566440
Page 1/1
Fig. 2. 3-D plot of Flight #18 on 19 July 2001. After takeoff at
the airport of Manaus the flight pattern was set up as a Lagrangian experiment with a series of stacked horizontal profiles (with 3–6 crosswind transects each) in the urban outflow at successive dis-tances downwind of Manaus City (10, 40, 70 and 100 km). The flight altitude is colour-coded in blue (z-axis). Red lines indicate the VOC cartridge sample intervals within some of the plume tran-sects. The grey line is the XY-projection as in Fig. 1.
accomplished at constant altitude and aircraft speed, approx-imately perpendicular to the longitudinal axis of the plume. Within a flight duration of ca. 4 h, the plume was followed in westerly direction, with vertical profile transects alternat-ing between ascendalternat-ing and descendalternat-ing. With the estimated CBL mean wind speed of 10 m s−1(see above) the plume air
parcels travelled slightly ahead of the aircraft’s flight sched-ule.
The urban plume borders were distinct from the clean background air on either side of it. Predictions by the HYS-PLIT dispersion model already indicated that under the pre-vailing meteorological conditions the plume was not signif-icantly fragmented by turbulence (Fig. 1), with only low crosswind dispersion. This is also evidenced by the observed remarkable uniformity of concentration changes within the flight transects flown at different distances from Manaus (e.g. CO as non-reactive tracer in Figs. 4, 5).
In the absence of NO2 values for Flight #18, due to a
breakdown of the photolytic converter, the data collected during Flight #11 (15 July 2001, 09:00–13:00 LT) are pre-sented and used as a proxy to estimate the total NOx
mix-ing ratios. Weather conditions durmix-ing Flight #11 were simi-lar to those during Flight #18, but winds speeds were lower (2 m s−1, measured 20 m above the forest canopy, K34, ver-sus 3–5 m s−1 during Flight #18), leading to faster photo-chemical aging with travel distance from Manaus. Here only three transects were at a similar altitude (230–280 m) at 10, 40 and 70 km distance from Manaus.
3 Results and discussion
3.1 Amazon background conditions (green ocean air)
During LBA-CLAIRE-2001 the airborne measurements fo-cussed on data collection around midday, as this is the pho-tochemically most active period and typically the time of the most intense vertical mixing. To characterize the background conditions in the Manaus region during the wet-to-dry season transition period, vertical profiles of observed mixing ratios for CO, NO, O3, CO2, H2O, CN, CCN0.6, and the
poten-tial temperature from Flight #18 are shown in Fig. 3; and for isoprene (the dominant biogenic VOC species) and α-pinene (the dominant monoterpene species) the mean vertical pro-files from 8 background flights during the LBA-CLAIRE-2001 are shown. A summary of the complete set of mea-surements of long-lived trace gases and aerosols in the back-ground atmosphere during LBA-CLAIRE-2001 is given in Table 1. As is shown by the dispersion model results in Fig. 1, the crosswind dispersion of the Manaus plume was low, therefore we were able to use data collected at either edge of each transect, during ascent or descent to the next flight altitude, to characterize the Manaus background air conditions. The mixing ratios outside of the plume were spa-tially quite uniform, comparing both the north-south gradient and the east-west gradient following the plume travel path with time. For most species, these background data resemble airborne measurements that were carried out at more remote regions to the north of Manaus City during LBA-CLAIRE-2001. Only for the aerosol number concentrations are the levels at the edge of the plume somewhat elevated. This can be explained by the fact that the ratio between in-plume and background levels are highest (as much as a factor of 30) in the case of aerosol number concentration, so that even a slight amount of diffusion of plume air into the surroundings yields a detectable enhancement.
The uniformity of vertical profiles of most trace con-stituents in Fig. 3 is indicative of a well-mixed CBL, with mixing ratios representative for wet-season background con-ditions containing very low levels of pollution from biomass burning or industrial emissions. The vertical profiles of po-tential temperature and specific humidity in Fig. 3 indicate a CBL height of about 1400 m. CO2 mixing ratios were in
a range of 369–374 ppm, and quite constant above the CBL (see Lloyd et al., 2007 for more details on the CO2profiles
and budget).
CO mixing ratios on Flight #18 were in the range of 70– 90 ppb within the CBL and slightly decreasing with alti-tude. This is near the lower end of CO concentrations in the CBL observed during the campaign (78–115 ppb, see Ta-ble 1) and indicates that this flight fell into a relatively un-polluted period with values significantly lower than normally observed during the middle of the Amazon dry season (100– 600 ppb; Crutzen et al., 1985; Andreae et al., 1988; Kauf-man et al., 1992; Blake et al., 1996; Sachse et al., 1988).
0 500 1000 1500 2000 60 80 100 0 5 10 15 0 1000 2000 3000 0 20 40 0 50 100 305 310 370 380 390 400 0 1 2 3 40 500 1000 1500 2000 0.0 0.1 0.2 0.3 0.4 0 1000 2000 CO [ppb] h e ig h t [m ] CO CN [cm-3] CN spec. humidity [g kg-1] sh O3 O3 [ppb] NO NO [ppt] temp pot. temp. [K] CO2 CO2 [ppm] isoprene isoprene [ppb] h e ig h t [m ] a-pinene αααα-pinene [ppb] CCN0.6 [cm-3 ] CCN_0.6
Fig. 3. Background concentrations of trace constituents and meteorological data measured during Flight #18 on 19 July 10:00–14:00 LT. All
data collected outside of the plume (i.e., at either side of each transect of the 18 transects, during ascending or descending to the next flight altitude) were merged. As there were no background VOC measurements within this specific flight, the mean vertical profiles of isoprene and α-pinene from 8 background flights during the LBA-CLAIRE-2001 campaign are shown in the right panel (see Kuhn et al., 2007).
They are comparable to the values found over the Amazon Basin during the early dry season in 1985 and the wet sea-son in 1987 (75–110 ppb) (Sachse et al., 1988; Harriss et al., 1990). Typical CO mixing ratios measured during July at Ascension Island, which also lies in the Southeast Trades, are 60–90 ppb (data from NOAA-ESRL ftp://ftp.cmdl.noaa. gov/ccg/co/flask/event/). This suggests that little or no addi-tion of CO from surface sources had taken place during the transit of the airmasses over the Amazon Basin in the case of Flight #18, but that some additional CO may have been present during other periods of LBA-CLAIRE-2001. Some of this additional CO may have been the result of VOC ox-idation. However, the fact that the highest CO values were observed during those parts of the campaign when the tra-jectories had passed the burning areas in Eastern Amazonia (Rissler et al., 2004) suggests that most of the enhancement was probably due to upwind pyrogenic emissions. This is supported by the correlation between CN and CO concentra-tions in the background air (see below).
The CBL background NO mixing ratios were mostly be-low the instrument’s detection limit of 30 ppt, and sbe-lowly decreasing with altitude (Fig. 3), comparable to ground-based data measured by Cordova et al. (2004) and Moura et al. (2004) at an Amazonian forest site 150 km North of Manaus during the same time period. They are thus com-parable to data within the atmospheric boundary layer and lower free troposphere in remote maritime locations (20– 40 ppt; Bottenheim et al., 1986; Bradshaw et al., 2000). This implies that the NOx mixing ratios during
LBA-CLAIRE-2001 over the Amazon forest were close to the threshold
re-quired for net photochemical ozone formation (Chameides et al., 1992), and therefore very sensitive to anthropogenic pollution. Singh et al. (1990) reported a median NO con-centration as low as 8 ppt at 0–6 km altitude over the Ama-zon basin in April–May 1987 (wet season), with little verti-cal gradient. Torres and Buchan (1988) observed boundary layer NO concentrations in the range 25–60 ppt over the cen-tral Amazon in July–August 1985. Although the data base in tropical areas is still quite sparse, ground-based observa-tions in the remote Amazon forest (not under the direct influ-ence of biomass burning) appear to range from 20 to 100 ppt of NO. The somewhat higher NOx concentrations found in
tropical forests, as compared to those observed in remote marine locations could result from the primary continental sources of biomass burning or from NOxemissions by soil
(Kaplan et al., 1988; Torres and Buchan, 1988; Gut et al., 2002; Ganzeveld et al., 2002; Rummel et al., 2002). Alter-natively they may derive from lightning activity within thun-derstorms as observed over southern Brazil by Huntrieser et al. (2007).
O3mixing ratios varied from 18–24 ppb within the
back-ground CBL (though one of 18 transects dropped down to 14 ppb) and were fairly constant with height in the lower CBL, although increasing to peak values of 38 ppb above 1500 m altitude. The sources of ozone in the remote tro-posphere are downward transport from the stratosphere and in situ photochemical production. Losses result from pho-tochemical processes and from deposition and destruction at the earth’s surface. In the tropics, near the surface, the contribution by transport from the stratosphere is relatively
minor and the ozone budget is largely controlled by photo-chemical processes, balanced by dry deposition (Roelofs and Lelieveld, 1997). Tropospheric ozone is an important player in atmospheric chemistry because OH radicals are gener-ated from the photolysis of ozone (Lelieveld et al., 2008). OH is the principal oxidizing agent in the troposphere that dominates the daytime removal of most gaseous pollutants (dubbed the “detergent” of the atmosphere), but was not mea-sured directly during LBA-CLAIRE-2001.
Background ambient air contains a suite of highly reactive biogenic VOC emitted by vegetation. VOC composition was dominated by isoprene, contributing up to 90% of the mea-sured biogenic species, as typically found in tropical regions (e.g. Jacob and Wofsy, 1988; Kesselmeier et al., 2002; Kuhn et al., 2007; Karl et al., 2007). The mixing ratios of α-pinene were an order of magnitude lower, and comprised about half of the sum of detected monoterpene species. The mean verti-cal profiles of isoprene and α-pinene during LBA-CLAIRE-2001 showed similar characteristics, both declining with alti-tude, and ranging from 4.7 ppb for isoprene and 0.23 ppb for
α-pinene to below detection limit for both compounds in the free troposphere (FT) (Fig. 3; Kuhn et al., 2007). As tropical ecosystems are characterized by both, high leaf area index and strong VOC emission factors (Rinne et al., 2002; Kuhn et al., 2007, Karl et al., 2007), also occurring all year round (Kuhn et al., 2004 a, b), they are the major contributors to the global burden of biogenic VOC. For example, 83% isoprene, 69%, and 66% of the global annual emissions of isoprene, monoterpenes, and methanol, respectively, are estimated to originate from the tropical regions (30◦S–30◦N; Lathiere et al., 2006).
Aerosol concentrations during LBA-CLAIRE-2001 were somewhat elevated relative to truly unpolluted pristine rain-forest values, with mean values of aerosol number concentra-tions (CN) within the CBL of 700–1700 cm−3 and CCN0.6
concentrations of 400–1200 cm−3, both decreasing with al-titude (Fig. 3, Table 1). The cleanest conditions during LBA-CLAIRE-2001 were reached after the aircraft cam-paign, during 23–25 July, when the average CN concen-trations at Balbina were 513 ± 160 cm−3. Values of 400– 500 particles cm−3are typical of unpolluted Amazonia in the absence of extensive precipitation (Roberts et al., 2001b; An-dreae et al., 2004; AnAn-dreae, 2009; Martin et al., 2010a, b; P¨oschl et al., 2010).
In general, the background aerosol concentrations ob-tained on the aircraft were in good agreement with simulta-neous measurements made at a ground-based site, located at Balbina, some 125 km NE of Manaus (Table 1). During some flights the background CN concentrations measured on the aircraft were slightly higher than those measured at Balbina, which may have been due to the flights being located gener-ally downwind of the Manaus region, where minor amounts of pollutants may have been present. Because of the very high aerosol enhancement in the Manaus plume relative to that of CO (average 1CN/1CO = 340 ± 230 cm−3ppb−1,
see Sect. 3.6) a CN enhancement of about 200 cm−3, as was
observed on Flight #18, would correspond to a CO enhance-ment of less than 1 ppb, which could not be distinguished from the regional background.
The enhancements of CO and CN in the background air during LBA-CLAIRE-2001 are significantly correlated (r2= 0.52) with a 1CN/1CO slope of 20 ± 2 cm−3ppb−1, in good agreement with the CN/CO emission ratios from biomass burning (Guyon et al., 2005). For an assumed CO background value of 70 ppb, the regression of CN on CO pre-dicts a CN concentration of 509 particles cm−3, consistent with the background values observed during the clean pe-riod of 23–25 July and also during SMOCC-2002 (Andreae et al., 2004). The concentrations of CO and aerosols tended to decline with altitude from the CBL into the FT; the low-est values were reached during Flight #18 in the FT (70 ppb). These observations suggest that during 18–19 July, a small enhancement of ca. 10 ppb CO and 200 particles cm−3of CN
was present as a result of pyrogenic emissions in eastern Amazonia.
An average of 66 ± 15% of the CN present in the BL were CCN active at 0.6% super-saturation (SS) (Fig. 3, Table 1), and this fraction increased to 77 ± 14% in the FT. This CCN fraction is in close accordance with Amazon background data measured during other campaigns under clean condi-tions (Roberts et al., 2003; Vestin et al., 2007; Gunthe et al., 2009; Martin et al., 2010a). Organic material, about half of which is water soluble, constitutes some 80% of the clean air (wet-season) aerosol mass in the Amazon Basin, while sol-uble inorganic salts (predominantly ammonium bisulphate) represent about 15%. The organic and inorganic fractions, in spite of their different mass fractions, make similar con-tributions to the soluble molecules that account for the CCN activity of Amazon aerosols (Roberts et al., 2002; Martin et al., 2010a).
At the low natural levels of ozone and NOxtypical of the
unpolluted tropical atmosphere, the oxidation of biogenic VOC proceeds mostly through reaction with OH and has a low aerosol and CCN yield. Under these low CCN condi-tions, cloud droplets can grow rapidly to the size where pre-cipitation occurs (“warm rain” formation), and it has been observed that the precipitation from convection over tropi-cal Amazonia is more of a maritime type (Dias et al., 2002; Williams et al., 2002; Andreae et al., 2004). At such low CCN concentrations, cloud properties (e.g., droplet effective radius and maximum supersaturation) are most sensitive to an increase in CCN (Roberts et al., 2001, 2003). There-fore, enhanced aerosol emissions due to human activity in the Amazon Basin may have a stronger impact on climate than emissions in other continental regions.
The light scattering coefficients, σsp, at 550 nm in the CBL
were typically in the range 5–10 Mm−1. They were about 30–50% lower than measured simultaneously at a ground-based site in Balbina (unpublished data). This is most likely a consequence of low efficiency of the aircraft’s aerosol inlet
for large particles, as the coarse aerosol fraction accounts for about half of the light scattering of the background Amazo-nian aerosol (Guyon et al., 2003). The lowest values of σsp
were measured during the clean period when Flight #18 took place. The ˚Angstr¨om coefficients were typically around 2, which also suggests that light scattering was mostly due to the fine mode aerosol.
3.2 Air pollutants within the Manaus plume
Figure 4 shows the time series of the airborne measurements obtained for Flight #18, including the complete chronology of all plume transects at different altitudes and distances from Manaus. Within the plume, mixing ratios of CO, O3 and
NO were drastically enhanced compared to background air. Peak values within the plume of 140 ppb CO were observed in the vicinity (10 km distance) of the city, but remained fairly constant with time when travelling downwind of Man-aus. Only little plume dilution occurred for the long-lived trace gases like CO, this also being reflected by the CCN measurements. The CCN0.6 concentrations peaked at 2000–
2500 particles cm−3 on all transects, and total aerosol num-ber concentrations (CN) were close to 30 000 particles cm−3 for the plume transects at 10 km distance. Extrapolation us-ing CN/CO correlations suggests similar CN concentrations in the downwind transects where peak concentrations were not measured due to instrumental problems. These concen-trations are comparable to the levels found in megacities such as Beijing (Wehner et al., 2008, and references therein).
Table 2 contains an overview of all the plume encounters made during the LBA-CLAIRE-2001 flights. The first part of the table provides information on the Manaus plume, the second shows results from some biomass burning plumes that were incidentally sampled during the flights. While the enhancement of CO in the plumes was always very obvious, the combustion-derived CO2 could not always be
readily distinguished from background fluctuations result-ing from biospheric fluxes. 1CO/1CO2 enhancement
ra-tios could therefore not always be determined, and in some cases might be biased by high CO2 in residual night time
air. This is especially problematic during morning flights (Guyon et al., 2005). Nevertheless, it is quite clear from the data in Table 2 that the urban emissions had much lower CO enhancement ratios (11.3 ± 10.9 × 10⁻³)than the biomass plumes (77 ± 40 × 10−3 during LBA-CLAIRE-2001, simi-lar to previous observations of pyrogenic emissions, Andreae and Merlet, 2001). The lowest 1CO/1CO2ratios (around
1 × 10⁻³)were found when the aircraft sampled emissions
from the power plants (pin symbols in Fig. 1), e.g., on Flights 6 and 11 (Table 2). Efficiently operating power plants are known to emit very little CO, often with 1CO/1CO2 less
than 1 × 10⁻³, but emissions can be higher when operating conditions are not optimal (EPA AP-42; Nicks et al., 2003).
It is noteworthy that the CO enhancement ratios in the Manaus plume are similar to the values of around 10 × 10−3
0 20 40 60 0 2000 4000 6000 8000 10000 10:000 10:30 11:00 11:30 12:00 12:30 13:00 13:30 14:00 3000 6000 9000 0 1000 2000 3000 80 120 160 200 0 1000 2000 O3 [ p p b ] O3 NO N O [ p p t] CN C N [ c m -3] local time [hh:mm] 100 km 70 km 40 km 10 km distance C C N0 .6 [ c m -3] CCN CO C O [ p p b ] altitude a lt it u d e [ m ]
Fig. 4. Complete time series of trace constituent measurements on
plume transects during Flight #18 on 19 July 10:00–14:00 LT. Ver-tical profiles of crosswind transects in the urban outflow are shown for successive distances (10, 40, 70 and 100 km) downwind of Man-aus City. The rightmost sections of the diagrams show the flight back to Manaus at the 200 m level (crossing the plume approx. per-pendicularly). CN data were cut off at 10 000 cm−3for most of the flight; only the first transects were recorded in full scale with values up to 30 000 cm−3(data not shown).
that are typical for North American urban plumes (Potosnak et al., 1999; Schwarz et al, 2008). This implies that the vehi-cle fleet in Manaus is quite modern (in agreement with infor-mal observations in the streets of Manaus), more comparable to, for example, Houston with a 1CO/1CO2of 1–3 × 10⁻³
(G. Frost, personal communication, 2007) than with Mex-ico City with a mean 1CO/1CO2of 96 × 10−3(Jiang et al.,
2005). The variability seen in the CO enhancement ratios in Table 2 therefore most likely reflects mixtures of vary-ing proportions of power plant, vehicular and wood burnvary-ing emissions.
In contrast to the non-reactive components, the mixing ra-tios of reactive compounds changed significantly with dis-tance from their source. Peak values >9 ppb NO were found close to Manaus, decreasing strongly with the plume pho-tochemical age further downwind. The NO data at 40 and 70 km distance are comparable to wet season pollution data reported by Pickering et al. (1992), who observed >1 ppb of NO during one aircraft intercept of the Manaus effluent at 50 km downwind distance. In the proximity of the urban sources, NO and NO2are assumed to be the dominant
con-stituents of the total reactive nitrogen (NOy = sum of NOx,
HNO3, NO3, N2O5, HONO, PAN, and other organic
nitro-gen compounds). As shown in Fig. 4 (see also Fig. 6), ozone mixing ratios increased with decreasing NO, with peak val-ues of O3(65 ppb) measured at the furthest distance sampled
(100 km). Figures 5 and 6 show the geographic distribution of the Manaus plume in terms of CN, CO, NO and O3mixing
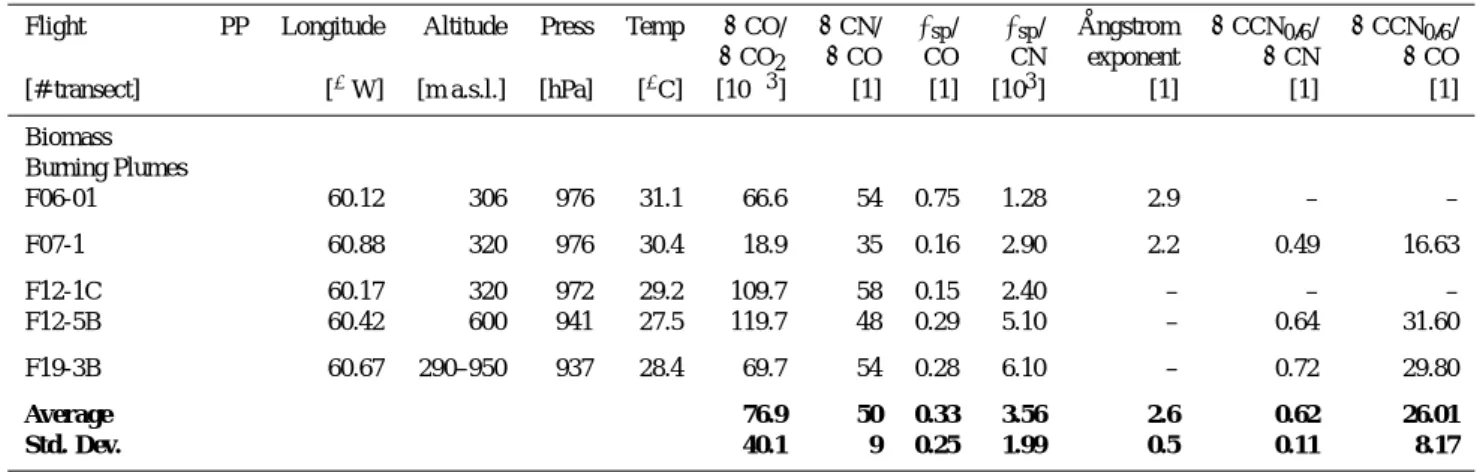
Table 2. Overview of all the plume encounters made during the LBA-CLAIRE-2001 flights (Manaus plumes in the upper part, and biomass
burning plumes in the lower part). PP means that power plant plume was sampled, based on trajectory analysis. σsp (550 nm) is the scattering coefficient at 550 nm wavelength. All concentrations and scattering coefficients have been normalized to standard conditions in dry air (273.15 K, 1000 hPa).
Flight PP Longitude Altitude Press Temp 1CO/ 1CN/ σsp/ σsp/ Angstrom˚ 1CCN0.6/ 1CCN0.6/
1CO2 1CO CO CN exponent 1CN 1CO
[#-transect] [◦W] [m a.s.l.] [hPa] [◦C] [10−3] [1] [1] [103] [1] [1] [1]
Urban Plumes: F01-1 60.60 270 984 28.0 – 109 0.17 1.86 2.4 – – F02-2 60.20 420 970 30.2 – 317 0.44 0.47 2.2 – – F06-2 PP 60.19 310 975 31.0 1.2 826 – – 2.1 0.08 – F07-2 60.88 320 976 30.4 6.0 225 – – 2.3 0.15 38.27 F08-1&2 near K34 200-930 959 29.0 – 81 0.54 3.22 2.3 0.48 37.58 F08-3 60.10 290 963 29.2 – – – 1.31 2.1 0.09 – F09A 60.17 300 979 29.6 – 306 0.11 0.92 2.1 0.31 12.56 F09H 60.21 300 979 29.6 – 290 0.22 0.68 2.1 0.15 36.44 F09I 60.21 300 979 29.6 – 364 0.22 0.33 2.3 0.14 45.84 F09C 60.26 300 979 29.6 – 130 0.13 1.14 2.2 0.22 22.30 F09B 60.31 300 979 29.6 4.1 97 0.29 2.33 2.2 0.31 55.34 F09D 60.34 630 945 26.6 – 124 0.23 1.01 2.3 0.09 35.88 F09F 60.34 300 979 29.6 – 133 0.31 1.74 2.3 0.36 62.70 F09G 60.34 300 979 29.6 – 240 0.49 1.35 2.3 0.35 85.68 F09E 60.58 300 979 29.6 – 100 0.57 2.57 2.3 0.47 48.67 F11-1N 60.18 180–910 951 27.1 4.9 93 0.10 0.86 2.0 0.13 27.52 F11-1S PP 60.17 180-910 951 27.1 1.4 462 – – 2.2 0.14 37.30 F11-5 60.17 370 972 29.7 – – – 0.51 2.2 0.11 – F11-2 60.42 140–170 944 27.4 2.0 327 0.08 0.38 2.1 0.22 90.92 F11-4 60.42 340 977 30.2 3.4 233 – 0.48 2.1 0.21 76.47 F11-3 PP 60.67 320 977 30.2 0.8 372 – – 2.2 0.43 159.07 F12-1A 60.17 300 972 28.9 – 196 – 0.65 1.2 0.08 19.79 F12-1B 60.16 305 972 28.9 – 302 0.24 – – – – F12-2 60.17 620 939 27.5 – 246 0.29 0.46 – 0.05 14.53 F12-5A 60.42 600 941 27.8 – 184 0.61 0.62 – 0.08 17.57 F18-1 PP 60.17 100–1250 938 26.1 – 827 0.11 0.15 1.6 0.03 68.91 F18-2 PP 60.40 100–1250 960 28.1 – 885 0.13 0.16 1.8 0.07 77.01 F18-3 60.67 150–1260 941 27.3 – 713 0.14 0.18 2.0 0.05 75.96 F18-4 60.92 290–910 950 29.1 23.9 507 0.14 0.28 2.0 0.12 69.91 F19-1 60.17 290–950 950 29.1 15.1 680 0.13 0.19 1.9 0.04 40.78 F19-2 60.42 290–950 939 28.2 8.4 698 0.17 0.29 2.2 0.08 53.00 F19-3S 60.67 290–950 937 28.4 32.0 427 – – – 0.08 33.10 F19-3N 60.67 290–950 937 28.4 5.8 554 – – – 0.08 51.10 F20-1N 60.18 330–640 986 29.1 19.7 116 – – – 0.10 12.80 F20-1S PP 60.18 330–640 986 29.1 – 259 – – – 0.25 91.00 F20-2N 60.30 330–640 986 30.3 – 200 – – – 0.07 14.60 F20-2S PP 60.30 330-640 986 30.3 4.5 372 – – – 0.16 69.00 F20-3 60.42 330–640 959 27.9 5.1 238 – – – 0.21 57.00 F21-1 60.18 300–1080 927 27.7 16.0 620 – – – 0.04 30.50 F21-2 60.42 470–1420 912 26.6 26.4 239 – – – 0.11 29.80 F21-3 60.67 480–940 930 28.2 – 206 – – – 0.11 25.00 F21-4 60.65–60.12 600 943 29.0 33.7 268 – – – 0.07 28.30 Average 11.3 339 0.25 0.93 2.1 0.16 48.67 Std. Dev. 10.9 225 0.16 0.82 0.2 0.12 30.04
Table 2. Continued.
Flight PP Longitude Altitude Press Temp 1CO/ 1CN/ σsp/ σsp/ Angstrom˚ 1CCN0.6/ 1CCN0.6/
1CO2 1CO CO CN exponent 1CN 1CO
[#-transect] [◦W] [m a.s.l.] [hPa] [◦C] [10−3] [1] [1] [103] [1] [1] [1]
Biomass Burning Plumes F06-01 60.12 306 976 31.1 66.6 54 0.75 1.28 2.9 – – F07-1 60.88 320 976 30.4 18.9 35 0.16 2.90 2.2 0.49 16.63 F12-1C 60.17 320 972 29.2 109.7 58 0.15 2.40 – – – F12-5B 60.42 600 941 27.5 119.7 48 0.29 5.10 – 0.64 31.60 F19-3B 60.67 290–950 937 28.4 69.7 54 0.28 6.10 – 0.72 29.80 Average 76.9 50 0.33 3.56 2.6 0.62 26.01 Std. Dev. 40.1 9 0.25 1.99 0.5 0.11 8.17
ratios. The width of the urban plume was about 20–25 km, resembling the dimension of the city itself, with little down-wind spreading (see also the HYSPLIT dispersion model in Fig. 1).
3.3 Observation-based ozone production rates within
the plume
Peak ozone mixing ratios on Flight #18 reached up to 65 ppb at the 850-m level at 100 km distance of Manaus City, which represents a more than 3-fold enhancement with respect to the background values (21 ppb at either edge of this transect). The dependence of the production of ozone, P (O3), on
pre-cursors is controlled by the primary radical sources, which in turn is dependent on both, the NOx availability and the
VOC reactivity, and is non-linear with respect to emission strengths (Liu et al., 1987; Daum et al., 2000; Ryerson et al., 2003; Kleinman et al., 2003). Ozone precursors are ubiq-uitously emitted in urban areas, the major source categories being vehicles, power plants, and solvent use. Essentially all photochemical production of O3 in the troposphere occurs
by the reactions in Eqs. (1–3), where the oxidation of NO takes place by reaction with the hydroperoxy radical (HO2)
and organic peroxy radicals (RO2)formed by the reaction of
OH with VOCs. The product NO2photodissociates to
recy-cle NO and an O atom, which immediately combines with O2to yield O3. This way, NOxacts as a catalyst in the ozone
formation process (e.g., Trainer et al., 2000).
OH + VOC(or CO) + O2→RO2+H2O(or HO2+CO2) (1)
RO2+O2(or HO2)+NO→Carbonyl+HO2(or OH)+NO2(2)
NO2+hv(+O2) →NO + O3 (3)
Ultimately, P (O3)depends on the mixing ratio of NO and the
peroxy radicals (determined by the rate at which OH reacts with VOCs in the VOC-sensitive case). O3 production can
Page 1/1 Copernicus Publications Bahnhofsallee 1e 37081 Göttingen Germany Contact publications@copernicus.org http://publications.copernicus.org Phone +49-551-900339-50 Fax +49-551-900339-70 Legal Body Copernicus Gesellschaft mbH Based in Göttingen Registered in HRB 131 298 County Court Göttingen
Fig. 5. Bird view image (see Fig. 1) of the total aerosol number
concentration (CN) and CO mixing ratios observed downwind of Manaus City (−3.08◦, −60.01◦) during Flight #18 on 19 July 2001, 10:00–14:00 LT As flight legs at a certain distance of Manaus lie on top of each other (compare Figs. 1, 2), perspective is added in a way that highest altitudes transects are displayed on most right-hand side. One longitudinal degree corresponds to ∼111 km.
9264 U. Kuhn et al.: Impact of Manaus City on the Amazon Green Ocean atmosphere thus be considered as a radical competition process, in which
VOCs and NOxcompete for the OH radical. In Fig. 6, an
an-ticorrelated evolution of NO versus O3is shown, indicating
the conversion of NO to NO2during photochemical
process-ing, and the removal of NOxfrom the photochemical cycle
by oxidation to HNO3, peroxyacyl nitrates (PAN) or other
organic nitrates (unfortunately neither NO2, nor NOy were
available for Flight #18). Neglecting the influence of plume dilution (horizontal dispersion and vertical entrainment), de-position (dry and wet), and aerosol surface reactions, a lower bound estimate of the amount of O3formed over the
obser-vation period (between initial time t0of the first transect and
time ti further downwind) should be approximately equal to
the O3enhancement, or [O3(ti)] − [O3(t0)] = ti Z t0 P (O3(t0))dt0 (4)
The observed net ozone production rates approximated from the change in observed peak O3 mixing ratios at different
distances from the source (Fig. 4), were 10–15 ppb h−1 be-tween 10 and 40 km and bebe-tween 40 and 70 km distance, and around 0–15 ppb h−1 between 70 and 100 km distance (where high production was observed at the uppermost alti-tude, but no further increase of O3at the 200–550 m level).
A peak value of 63 ppb O3was reached at 100 km distance
from Manaus at 850 m altitude, with 21 ppb in the adjacent background. Assuming a mean plume travel time of 2.8 h and a CBL wind speed of 10 m s−1, we estimate an observation-based O3net production rate of 15 ppb h−1for the entire
ob-served travel path at the 850 m level. The vertical gradient in observed ozone enhancement underscores the finding of Pickering et al. (1992) that convective transport away from the surface enables precursor compounds to achieve their full ozone generating potential.
These P (O3)are comparable to values of 12–14 ppb h−1,
estimated for ozone production in the New York City plume in July 1996 (Kleinman et al., 2000), and with other high ozone production episodes in the vicinity of US cities (a com-parison of five different cities, with a variety of background conditions, is given by Kleinman et al., 2005). Likewise, for the Lombardy region with the city Milan in its centre being one of the most economically important areas in Eu-rope, estimated P (O3)of 5–25 ppb h−1’ have been reported
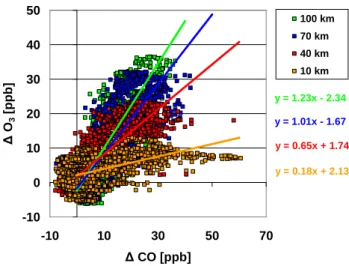
(May/June 1998; Dommen et al., 2002; Spirig et al., 2002). The evolution of the O3 mixing ratios is determined by
the net photochemical ozone production (or destruction), de-position and dilution processes, and through entrainment of unpolluted (low O3)air. The latter can be accounted for by
using the observed correlation between O3and CO. Carbon
monoxide is a tracer of anthropogenic emissions with well-known sources from combustion, industry, and oxidation of hydrocarbons. Because of its long chemical lifetime and relatively small biogenic exchange rates, it can be assumed that after emission only dilution by dispersion will modify
Page 1/1
Copernicus Publications
Bahnhofsallee 1e 37081 Göttingen Germany
Martin Rasmussen (Managing Director) Nadine Deisel (Head of Production/Promotion)
Contact publications@copernicus.org http://publications.copernicus.org Phone +49-551-900339-50 Fax +49-551-900339-70 Legal Body Copernicus Gesellschaft mbH Based in Göttingen Registered in HRB 131 298 County Court Göttingen Tax Office FA Göttingen USt-IdNr. DE216566440
Fig. 6. Bird view image (see Fig. 1) of O3and NO mixing ratios ob-served downwind of Manaus City (−3.08◦, −60.01◦) during Flight #18 on 19 July 2001, 10:00–14:00 LT. The linear colour code of NO (lower panel) was selected to resolve values of 0–500 ppt, while the dark red colour in the vicinity of Manaus City includes values up to 10 ppb of NO (see Fig. 4). For O3(upper panel) one transect (70 km distance, 550 m level) was interpolated due to lack of data. As flight legs at a certain distance of Manaus lie on top of each other (com-pare Figs. 1, 2), perspective is added in a way that highest altitudes transects are displayed on most right-hand side. One longitudinal degree corresponds to ∼111 km.
CO mixing ratios during the transport downwind of the ur-ban emission source on short time scales (hours). All plume components (CO, O3and NOx)are expected to be equally
affected by plume dispersion in the boundary layer; and de-viations in the ratios between reactive and long-lived gases will give insight into the role of their chemical processing (production or conversion/degradation, respectively), hence eliminating the dilution effects.
Here, the enhancement factor (EFO3/CO)is calculated as
the enhancement (1) of O3 in the plume (O3p)above the
respective background values (O3b, derived from the edges
of the flight transects at either side of the plume) over the enhancement of the conserved tracer CO:


![[PDF] Démarrer et avancer avec la programmation en VBA Excel cours PDF - Cours Excel](data:image/gif;base64,R0lGODlhAQABAIAAAP///wAAACH5BAEAAAAALAAAAAABAAEAAAICRAEAOw==)