HAL Id: hal-03154503
https://hal.archives-ouvertes.fr/hal-03154503
Submitted on 1 Mar 2021
HAL is a multi-disciplinary open access archive for the deposit and dissemination of sci-entific research documents, whether they are pub-lished or not. The documents may come from teaching and research institutions in France or abroad, or from public or private research centers.
L’archive ouverte pluridisciplinaire HAL, est destinée au dépôt et à la diffusion de documents scientifiques de niveau recherche, publiés ou non, émanant des établissements d’enseignement et de recherche français ou étrangers, des laboratoires publics ou privés.
Enzo Piponnier, Sébastien Ratel, Emeric Chalchat, Bastien Bontemps, Olivia
Bocock, Valérie Julian, Martine Duclos, Vincent Martin
To cite this version:
Enzo Piponnier, Sébastien Ratel, Emeric Chalchat, Bastien Bontemps, Olivia Bocock, et al.. M-wave and H-reflex recruitment curves in boys and men. International Journal of Developmental Neuroscience, Elsevier, 2021, �10.1002/jdn.10099�. �hal-03154503�
M-wave and H-reflex recruitment curves in boys and men
Authors: Piponnier Enzo1,2, Ratel Sébastien1, Chalchat Emeric1, Bontemps Bastien1, Bocock
Olivia 3, Julian Valérie 3, Duclos Martine 3 & Martin Vincent1,4 PhD
Authors affiliations: 1: Université Clermont Auvergne, AME2P, Clermont-Ferrand, France, 2:
Université Côte d’Azur, LAMHESS, Nice, France, 3: Centre Hospitalier Universitaire de Clermont-Ferrand, Clermont-Ferrand, France, 4: Institut Universitaire de France (IUF), Paris, France.
Corresponding author: Piponnier Enzo, LAMHESS, Université Côte d’Azur, Campus STAPS,
Sciences du Sport, 261, boulevard du Mercantour - 06205 Nice, France. ORCID ID: https://orcid.org/0000-0003-0368-5589 ; Phone number: +33 4.89.15.39.58. Email: enzo.piponnier@univ-cotedazur.fr
Conflicts of interest: None of the authors has any conflict of interest to disclose.
Ethics approval: The local ethics committee (Protection Committee of People for Biomedical
Research South-East 6; authorization number, AU 1268) approved the present study.
Co-author details: Ratel Sébastien (sebastien.ratel@uca.fr), Chalchat Emeric (emchalchat@gmail.com), Bontemps Bastien (bastienbontemps9@gmail.com), Bocock Olivia (oliviabocock@gmail.com), Julian Valérie (vjulian@chu-clermontferrand.fr), Duclos Martine (mduclos@chu-clermontferrand.fr) & Martin Vincent (vincent.martin@uca.fr)
Author contribution: EP, SR and VM designed the research; EP, EC, BB, VJ, OB and MD
collected data and performed research; EP, EC, BB, SR and VM analysed data; EP, SR and VM wrote the manuscript and all authors provided critical revisions important for intellectual content of the finished manuscript. All authors approved the final version of the manuscript and agree to be accountable for all aspects of the work in ensuring that questions related to the accuracy or integrity of any part of the work are appropriately investigated and resolved.
ABSTRACT
The aim of the present study was to check whether the M-wave and H-reflex recruitment curves differ between prepubertal boys and men. Eleven boys (9-11 yr) and eleven men (18-35 yr) were magnetically stimulated at the tibial nerve in a prone position. M-wave and H-reflex maximal amplitudes (Hmax; Mmax; Hmax/Mmax), thresholds, regression slopes (Hslp; Mslp; Hslp/Mslp) were
extracted from M-wave and H-reflex recruitment curves and compared between the two age groups. Overall, no significant difference in M-wave and H-reflex recruitment curve parameters was found between the two populations. Nevertheless, the size of the M-wave associated to maximal H-reflex amplitude was lower in boys as compared to men when expressed relative to maximal M-wave amplitude (MHmax/Mmax: 0.18 ± 0.06 vs. 0.31 ± 0.13; P<0.05). This result
suggests that the development of peripheral nerve was completed in 9-11-year-old boys and did not affect the M-wave and H-reflex recruitment curves parameters. In neuromuscular function studies, it implies that Hmax/Mmax and Hslp/Mslp could be used indifferently to compare spinal
motoneuron excitability between 9-11-year-old boys and men. Conversely, evoking H-reflexes at a given percentage of Mmax may bias the comparison between boys and men.
Keywords: spinal motoneuron excitability, Magnetic nerve stimulation, Growth, Peripheral nerve,
SHORT ABSTRACT
Boys and men displayed comparable M-wave and H-reflex recruitment curves. In neuromuscular function studies, it implies that Hmax/Mmax and Hslp/Mslp could be used indifferently
to compare spinal motoneuron excitability between 9-11-year-old male children and adults.
ABBREVIATIONS
EMG: Electromyography H-reflex: Hoffmann reflex
Hmax: Maximal H-reflex amplitude
Hslp: Regression slope of the H-reflex recruitment curve
IHmax: Stimulus intensity at maximal H-reflex
IMmax: Stimulus intensity at maximal M-wave
IthresH: Minimum stimulus intensity required to evoke a detectable H-reflex
IthresM: Minimum stimulus intensity required to evoke a detectable M-wave
M-wave: Compound action potential
MHmax: M-wave amplitude associated to maximal H-reflex
Mmax: Maximal M-wave amplitude
Mslp: Regression slope of M-wave recruitment curve
SOL: Soleus 20 40 60 80 100 120 0 2 4 6 8
Intensity of stimulation (%IMmax)
EMG r
esponses (mV)
Men H-reflex Boys H-reflex Men M-wave Boys M-wave
Mmax Ithr esM Ithr esH IHmax IMmax Mslp Hslp Hmax MHmax
INTRODUCTION
In the field of developmental neuroscience, many studies have focused on the development of supra-spinal structures (e.g., Paus et al., 1999) and their effect on motor, cognitive and sensory functions. Much less is known about the development of spinal and peripheral nervous structures. Most studies have focused on conduction velocities (Gamstorp, 1970). The compound muscle action potential (M-wave) and the Hoffmann reflex (H-reflex) have been widely used to compare conduction velocities between children and adults. Indeed, as suggested by Vecchierini-Blineau and Guiheneuc (1981), the H-reflex is one of the sole motor reflexes that persists in adults. It is thus a fair experimental approach to compare children and adults.
The H-reflex is generally used to estimate spinal motoneuron excitability modulations (Zehr, 2002). Briefly, it is under the combined influence of pre-synaptic inhibition, motoneuron intrinsic properties and peripheral nerve properties when evoked at rest. The reflex is evoked by electrical stimulation of the Ia sensory afferents at submaximal intensities and is recorded at the muscle using electromyography (EMG) (Pierrot-Desilligny, 1969). This technique is less discomfortable than cervicomedullary or thoracic electrical stimulations (gold standard to assess spinal motoneuron excitability). Consequently, it is used more frequently in children (Grosset et al., 2007). The maximal H-reflex normalized to maximal M-wave (Hmax/Mmax) is the most used
parameter to estimate spinal motoneuron excitability (Palmieri et al., 2004). The available literature reports conflicting results regarding the effect of maturation on this parameter: some authors reported no difference of the Hmax/Mmax ratio between 7-11 years-old children and adults (Grosset
et al., 2007), whereas others observed a difference between 4 years-old and adults (Vecchierini-Blineau and Guiheneuc, 1981), or between children (7-12 old) and adolescents (13-16 years-old) (Hodapp et al., 2007).
Given the multiple mechanisms that may influence the H-reflex amplitude, it has been recommended to assess the full H/M recruitment curves in cross-sectional studies (Zehr, 2002). Some parameters of the H/M recruitment curves, such as regression slopes ratio (Hslp/Mslp)could
be more discriminant than the Hmax/Mmax ratio since they are independent from the activation
thresholds (Funase et al., 1996). Therefore, this ratio could be implemented in comparisons of spinal motoneuron excitability between children and adults. However, to our knowledge, no study has investigated the difference in H/M recruitment curves parameters between pre-pubertal children and adults.
Therefore, the aim of the present study was to compare H-reflex and M-wave recruitment curves between pre-pubertal children and adults to verify if Hmax/Mmax and Hslp/Mslp differ between
these two populations.
METHODS
PopulationEleven boys (age: 10.2 ± 0.7 yr, height: 1.40 ± 0.06 m, body mass: 34.7 ± 5.7 kg) and eleven men (age: 22.2 ± 4.1 yr, height: 1.78 ± 0.08 m, body mass: 72.7 ± 9.0 kg) volunteered to participate in the study. All the boys were prepubertal (Tanner stages I and II). Their age at the peak height velocity was 13.2 ± 0.3 yr and their maturity offset was -3.3 ± 0.6 yr. Tanner stages were determined from self-reported assessment on the basis of pubic hair and testicular/penis development (Tanner and Whitehouse, 1976). Self-reported pubertal status of the boys also involved assistance from their parents while completing the questionnaire. Maturity offset was used to assess somatic maturity and determined using chronological age, standing height, sitting height
and body mass of the boys. Its calculation was based on sex-specific regression equations (Mirwald et al., 2002).
All participants were tested on their right (dominant – kicking leg) leg. Participants were free from orthopedic and neuromuscular disorders. To be included, all participants had to spend less than 4 h per week in recreational physical activity. The local ethics committee (Protection Committee of People for Biomedical Research South-East 6; authorization number, AU 1268) approved the present study. Participants were fully informed of the experimental procedures and gave their written consent before any testing was conducted. Written consent of parents/guardians was also obtained for the children. When enrolled, the volunteers were asked to avoid participation in any intensive physical activity for two days prior to the beginning of the experiment.
Protocol
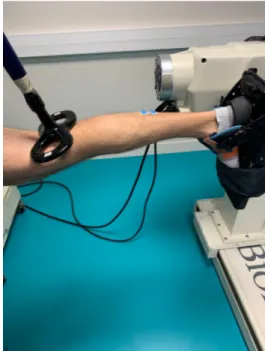
Participants laid prone on an isokinetic dynamometer (Biodex System 2, Biodex, Shirley, NY) chair with straps securely fastened at the hip to minimize upper body movement. The right foot was positioned in a snowboard binding attached to the Biodex foot plate. This set-up was used to minimize movement of the ankle and foot, which is difficult to obtain with the standard (original) Biodex ankle flexion/extension accessory. During all tests, hip and knee angles were maintained at 180° (hip neutral position and knee full extension) and the ankle was set at 90° (neutral position; Fig. 1). The participants were asked to position their head and arm comfortably and to stay in this position during all measurements.
The H-M recruitment curves were obtained by stimulating the tibial nerve with increased magnetic stimulation intensity. The use of H-reflex to assess spinal motoneuron excitability was preferred to cervicomedullary or thoracic electrical stimulation because it causes less discomfort, especially in children. Magnetic stimulation is generally used for the assessment of neuromuscular function
in children (Ratel et al., 2015) because it causes less discomfort and pain than electrical stimulation. The use of magnetic stimulation for the assessment of the H-reflex has been validated on the soleus muscle (Panizza et al., 1992; Piponnier et al., 2018; Zhu et al., 1992). Stimuli were delivered, every 5 s, between 20 and 100% of the maximal magnetic stimulator output (steps of 5%). EMG responses were recorded twice for all stimulation intensities (i.e. 32 stimulation points) and we used the mean value between the two stimuli to limit the variability of the responses.
Instrumentation
To ensure low impedance at the skin-electrode interface (Z < 5 kΩ), the skin was prepared prior to the EMG surface electrodes placement by shaving, lightly abrading with sandpaper and cleaning with alcohol. EMG electrodes (Ag-AgCl, Blue Sensor N-00-S, Ambu, Denmark) were Figure 1 : Ankle position in the Biodex foot plate and coil location over the posterior tibial nerve in the popliteal fossa.
ratio > 85dB, gain = 1000) and digitized by an external analog-to-digital converter (PowerLab 8/35, ADInstruments, New South Wales, Australia) driven by the LabChart 7.3 Pro software (ADInstruments, New South Wales, Australia) at a frequency of 2 kHz.
Magnetic nerve stimulations were delivered with a 70-mm figure-of-eight coil connected to two Magstim 2002 stimulators linked and synchronized by the Bistim2 module to increase the
stimulus duration (peak magnetic field strength: 2.5 T, stimulus duration: 115 μs; Magstim, Witland, Dyfed, UK). The coil was placed over the posterior tibial nerve in the popliteal fossa (Fig.1). Before any testing, small spatial adjustments were performed to determine the optimal position at which the greatest compound muscle action potentials (i.e. M-wave) of the SOL were evoked.
Data analysis
For every stimulation, peak-to-peak H-reflex and M-wave amplitudes were measured. Means of the two values obtained at every stimulation intensity were used to obtain H-reflex and M-wave recruitment curves. Maximal H-reflex (Hmax) and M-wave (Mmax) amplitudes were
determined, together with the corresponding stimulation intensities (IHmax and IMmax respectively;
Fig.2). The Hmax/Mmax ratio was then calculated. The H-reflex (IthresH) and M-wave (IthresM)
thresholds were determined as the minimum stimulus intensity required to evoke a detectable EMG response and expressed as percentage of IMmax (Fig. 2). The amplitude of the M-wave associated
with Hmax (i.e. evoked at IHmax; MHmax) was also measured (Fig.2) and the MHmax/Mmax ratio was
calculated to characterize motor fiber activation when Ia-fiber activation was maximal. The regression slopes (Hslp and Mslp) were determined by linear fitting between the thresholds and the
maximal amplitudes for individual H and M recruitment curves (Hwang, 2002) (Fig.2). The Hslp/Mslp ratio was then computed to further investigate spinal motoneuron excitability since it has
been shown to be theoretically independent of the activation threshold (Funase et al., 1996).
20 40 60 80 100 120 0 2 4 6 8
Intensity of stimulation (%IMmax)
EMG r
esponses (mV)
Men H-reflex Boys H-reflex Men M-wave Boys M-wave
Figure 2 : Typical M-wave and H-reflex recruitment curves in boys and men. Intensities
were normalized to the maximal M-wave intensity (IMmax). Hmax: Maximal H-reflex
amplitude; Mmax: Maximal M-wave amplitude; MHmax: M-wave associated to Hmax; IMmax:
Statistical analysis
Distribution normality and homogeneity of variances were tested using a Shapiro–Wilk normality test and the Bartlett’s test, respectively. All parameters were compared between groups (boys vs. men) with unpaired Student t-tests. The effect size was assessed using the Cohen’s d and ranked as follows: 0.20 = small effect, 0.50 = moderate effect, and ≥ 0.80 = large effect (Cohen, 1969). Data are reported as mean ± SD and the α–level for statistical significance was set at p < 0.05. Statistica 8.0 software (Statsoft, Inc, USA) was used for all statistical analysis.
R
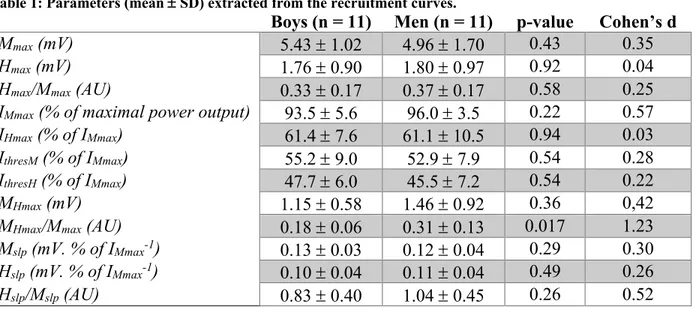
ESULTSAll parameters of the recruitment curves are reported in Table 1. No significant difference was found between boys and men for Mmax, Hmax and Hmax/Mmax. Similarly, intensities at Mmax and
Hmax (expressed as percentage of IMmax) and H-reflex and M-wave thresholds (expressed as a
percentage of IMmax) did not differ between groups. In addition, no significant difference was found
for MHmax comparisons. However, men displayed greater MHmax/Mmax than boys (P = 0.017). No
significant difference was found between boys and men for Mslp, Hslp and Hslp/Mslp.
Table 1: Parameters (mean ± SD) extracted from the recruitment curves.
Boys (n = 11) Men (n = 11) p-value Cohen’s d
Mmax (mV) 5.43 ± 1.02 4.96 ± 1.70 0.43 0.35
Hmax (mV) 1.76 ± 0.90 1.80 ± 0.97 0.92 0.04
Hmax/Mmax (AU) 0.33 ± 0.17 0.37 ± 0.17 0.58 0.25
IMmax (% of maximal power output) 93.5 ± 5.6 96.0 ± 3.5 0.22 0.57
IHmax (% of IMmax) 61.4 ± 7.6 61.1 ± 10.5 0.94 0.03
IthresM (% of IMmax) 55.2 ± 9.0 52.9 ± 7.9 0.54 0.28
IthresH (% of IMmax) 47.7 ± 6.0 45.5 ± 7.2 0.54 0.22
MHmax (mV) 1.15 ± 0.58 1.46 ± 0.92 0.36 0,42
MHmax/Mmax (AU) 0.18 ± 0.06 0.31 ± 0.13 0.017 1.23
Mslp (mV. % of IMmax-1) 0.13 ± 0.03 0.12 ± 0.04 0.29 0.30
Hslp (mV. % of IMmax-1) 0.10 ± 0.04 0.11 ± 0.04 0.49 0.26
Hslp/Mslp (AU) 0.83 ± 0.40 1.04 ± 0.45 0.26 0.52
Mmax: Maximal M-wave amplitude; Hmax: Maximal H-reflex amplitude; IMmax: Intensity at Mmax; IHmax: Intensity at
Hmax; IthresM: M-wave threshold; IthresH: H-reflex threshold; MHmax: M-wave associated to Hmax; Mslp: M-wave regression
slope; Hslp: H-reflex regression slope; AU: arbitrary unit.
DISCUSSION
The aim of this study was to compare the M-wave and H-reflex recruitment curves between prepubertal children and adults and to verify if Hmax/Mmax and Hslp/Mslp differ between these two
populations. No differences in recruitment curve parameters were found between boys and men. Boys only displayed a lower M-wave amplitude at IHmax expressed as a percentage of Mmax than
men.
on these different mechanisms and their relations is rather scarce. To date, no data are available on the effect of maturation on pre-synaptic inhibition in humans. Some data from animal studies suggest that pre-synaptic inhibition is rather weak at birth in mice but rapidly develops in the post-natal phase (Sonner and Ladle, 2013). It is currently unknown if this is also the case in humans. The effect of maturation on intrinsic motoneuron properties has also been studied in animal models, but not in humans. The mechanisms (transient outward current, T-type calcium current and L-type calcium current) involved in motoneuron intrinsic properties modulation are affected postnatally, in order to support motor function (Perrier and Hounsgaard, 2000). However, it is currently unknown when these intrinsic motoneuron properties reach a mature phenotype. Interestingly, it has been suggested that these properties and pre-synaptic inhibition may be affected by physical training (Perrier and Hounsgaard, 2000; Zehr, 2006). As the level of physical activity differs between children and adults (Pratt et al., 1999), this should translate into H-reflex differences between children and adults. In the current study, populations were matched by physical activity levels. This could have contributed to the lack of difference in recruitment curve characteristics between children and adults.
The sole difference between boys and men in the current study was the lower M-wave amplitude at IHmax expressed as a percentage of Mmax in boys. As Hslp and Mslp were found to be
similar between boys and men, the difference in MHmax/Mmax between this population suggests a
slight difference in afference and efference recruitment thresholds between boys and men. This result is consistent with a previous report showing that motor fiber rheobase was higher in pre-pubertal children than men (Farrar et al., 2013). The decrement in motor fiber rheobase from infancy to adulthood could principally be attributed to an increase in axonal diameter and myelin thickness (Schröder et al., 1978) or to changes in active variables (Farrar et al., 2013), such as ion channel function or membrane potential. It should also result in a decrease of the activation threshold. However, in the present study, no significant difference in IthresM and IthresH was observed
between boys and men. This inconsistency could be related to the stimulation technique used, i.e. magnetic nerve stimulation. Indeed, it has previously been reported that magnetic nerve stimulation the preferentially recruits motor fibers more than conventional electrical nerve stimulation (Panizza et al., 1992). This limitation could be attributed to the shorter stimuli duration of magnetic nerve stimulation (115 μs) as compared to electrical nerve stimulation (1 000 μs). Although the use of magnetic nerve stimulation may reduce the IthresM, it is assumed that this limitation should similarly
affect children and adults. As a result, the comparison of sensory and motor fiber thresholds between the two age groups should not have been biased. From a methodological point of view, the difference in MHmax/Mmax between boys and men suggests that setting the stimulation intensity
as a percentage of Mmax to evoke standardized H-reflex (Crenna and Frigo, 1987) is a biased
approach when comparing these two populations. Indeed, for a stimulation intensity applied at the same percentage Mmax (e.g. 17.5-20% of Mmax), the H-reflex amplitude expressed as a percentage
of Hmax could differ between children and adults. To compare more fairly children and adults,
recruitment curves should be entirely performed to determine precisely Hmax and Mmax in each
population.
Given the current lack of knowledge about the effect of maturation on presynaptic inhibition and intrinsic motoneuron properties in humans, future studies should assess the M-wave and H-reflex recruitment curves longitudinally during growth and maturation. They should be evaluated in passive and active conditions, during various motor tasks, together with the manipulation of body posture to vary the level of pre-synaptic inhibition (Zehr, 2002). The evaluation of persistent inward currents (e.g., Vandenberk and Kalmar, 2014) could also be an
maturation. Finally, these recruitment curves should be related to motor output variables, such as the voluntary activation level, to assess if the maturation of mechanisms affecting spinal motoneuron excitability could account for the lower voluntary activation level reported in children under 10 years of age than adults (Grosset et al., 2008; O’Brien et al., 2010).
To conclude, except for the lower MHmax/Mmax, the two populations displayed comparable
M-wave and H-reflex recruitment curves. In neuromuscular function studies, it implies that Hmax/Mmax and Hslp/Mslp could be used indifferently to compare spinal motoneuron excitability
between 9-11-year-old male children and adults. It is nevertheless recommended to perform complete recruitment curves to fairly compare children and adults and avoid the biased approach of setting the stimulation intensity as a percentage of Mmax to evoke standardized H-reflex.
Additional studies applying this methodology are required to get insight into the influence of maturation on pre-synaptic inhibition and intrinsic motoneuron properties, and their relationship with motor output.
ACKNOWLEDGEMENTS
The authors thank the participants for their time and effort. The authors are grateful to Pr. Geraldine Naughton for language edition and valuable comments during the preparation of the manuscript.
DATA AVAILABILITY STATEMENT
The data that support the findings of this study are available on request from the corresponding author. The data are not publicly available due to privacy or ethical restrictions.
REFERENCES
Cohen, J., 1969. Statistical power analysis for Behavioral sciences, Academic Press. ed.
Crenna, P., Frigo, C., 1987. Excitability of the soleus H-reflex arc during walking and stepping in man. Exp. Brain Res. 66, 49–60. https://doi.org/10.1007/bf00236201
Farrar, M.A., Park, S.B., Lin, C.S.-Y., Kiernan, M.C., 2013. Evolution of peripheral nerve function in humans: novel insights from motor nerve excitability. J. Physiol. 591, 273–286. https://doi.org/10.1113/jphysiol.2012.240820 Funase, K., Higashi, T., Yoshimura, T., Imanaka, K., Nishihira, Y., 1996. Evident difference in the excitability of the
motoneuron pool between normal subjects and patients with spasticity assessed by a new method using H-reflex and M-response. Neurosci. Lett. 203, 127–130. https://doi.org/10.1016/0304-3940(95)12284-2
Gamstorp, I., 1970. Conduction velocity of peripheral nerves and electromyography in infants and children. Psychiatr. Neurol. Med. Psychol. Beih. 13–14, 235–244.
Grosset, J.F., Mora, I., Lambertz, D., Pérot, C., 2008. Voluntary activation of the triceps surae in prepubertal children. J. Electromyogr. Kinesiol. Off. J. Int. Soc. Electrophysiol. Kinesiol. 18, 455–465. https://doi.org/10.1016/j.jelekin.2006.11.002
Grosset, J.-F., Mora, I., Lambertz, D., Pérot, C., 2007. Changes in stretch reflexes and muscle stiffness with age in
prepubescent children. J. Appl. Physiol. Bethesda Md 1985 102, 2352–2360.
https://doi.org/10.1152/japplphysiol.01045.2006
Hermens, H.J., Freriks, B., Disselhorst-Klug, C., Rau, G., 2000. Development of recommendations for SEMG sensors and sensor placement procedures. J. Electromyogr. Kinesiol. Off. J. Int. Soc. Electrophysiol. Kinesiol. 10, 361– 374. https://doi.org/10.1016/s1050-6411(00)00027-4
Hodapp, M., Klisch, C., Berger, W., Mall, V., Faist, M., 2007. Modulation of soleus H-reflexes during gait in healthy children. Exp. Brain Res. 178, 252–260. https://doi.org/10.1007/s00221-006-0730-1
O’Brien, T.D., Reeves, N.D., Baltzopoulos, V., Jones, D.A., Maganaris, C.N., 2010. In vivo measurements of muscle specific tension in adults and children. Exp. Physiol. 95, 202–210. https://doi.org/10.1113/expphysiol.2009.048967 Palmieri, R.M., Ingersoll, C.D., Hoffman, M.A., 2004. The hoffmann reflex: methodologic considerations and
applications for use in sports medicine and athletic training research. J. Athl. Train. 39, 268–277.
Panizza, M., Nilsson, J., Roth, B.J., Basser, P.J., Hallett, M., 1992. Relevance of stimulus duration for activation of motor and sensory fibers: implications for the study of H-reflexes and magnetic stimulation. Electroencephalogr. Clin. Neurophysiol. 85, 22–29. https://doi.org/10.1016/0168-5597(92)90097-u
Paus, T., Zijdenbos, A., Worsley, K., Collins, D.L., Blumenthal, J., Giedd, J.N., Rapoport, J.L., Evans, A.C., 1999. Structural maturation of neural pathways in children and adolescents: in vivo study. Science 283, 1908–1911. https://doi.org/10.1126/science.283.5409.1908
Perrier, J.F., Hounsgaard, J., 2000. Development and regulation of response properties in spinal cord motoneurons. Brain Res. Bull. 53, 529–535. https://doi.org/10.1016/s0361-9230(00)00386-5
Pierrot-Desilligny, E., 1969. [The H-reflex. Its significance for the functional exploration of the nervous system]. Presse Med. 77, 129–130.
Piponnier, E., Ratel, S., François, B., Garcia-Vicencio, S., Martin, V., 2018. Assessment of the H-reflex using two synchronized magnetic stimulators in order to increase stimulus durations: A comparison with electrical stimulation. Neurosci. Lett. 675, 89–94. https://doi.org/10.1016/j.neulet.2018.03.039
Pratt, M., Macera, C.A., Blanton, C., 1999. Levels of physical activity and inactivity in children and adults in the United States: current evidence and research issues. Med. Sci. Sports Exerc. 31, S526-533. https://doi.org/10.1097/00005768-199911001-00007
Ratel, S., Kluka, V., Vicencio, S.G., Jegu, A.-G., Cardenoux, C., Morio, C., Coudeyre, E., Martin, V., 2015. Insights into the Mechanisms of Neuromuscular Fatigue in Boys and Men. Med. Sci. Sports Exerc. 47, 2319–2328. https://doi.org/10.1249/MSS.0000000000000697
Schröder, J.M., Bohl, J., Brodda, K., 1978. Changes of the ratio between myelin thickness and axon diameter in the human developing sural nerve. Acta Neuropathol. (Berl.) 43, 169–178. https://doi.org/10.1007/bf00685012 Sonner, P.M., Ladle, D.R., 2013. Early postnatal development of GABAergic presynaptic inhibition of Ia
proprioceptive afferent connections in mouse spinal cord. J. Neurophysiol. 109, 2118–2128. https://doi.org/10.1152/jn.00783.2012
Tanner, J.M., Whitehouse, R.H., 1976. Clinical longitudinal standards for height, weight, height velocity, weight velocity, and stages of puberty. Arch. Dis. Child. 51, 170–179. https://doi.org/10.1136/adc.51.3.170
Vandenberk, M.S., Kalmar, J.M., 2014. An evaluation of paired motor unit estimates of persistent inward current in human motoneurons. J. Neurophysiol. 111, 1877–1884. https://doi.org/10.1152/jn.00469.2013
Vecchierini-Blineau, M.F., Guiheneuc, P., 1981. Excitability of the monosynaptic reflex pathway in the child from birth to four years of age. J. Neurol. Neurosurg. Psychiatry 44, 309–314. https://doi.org/10.1136/jnnp.44.4.309 Zehr, E.P., 2006. Training-induced adaptive plasticity in human somatosensory reflex pathways. J. Appl. Physiol.
Bethesda Md 1985 101, 1783–1794. https://doi.org/10.1152/japplphysiol.00540.2006
Zehr, E.P., 2002. Considerations for use of the Hoffmann reflex in exercise studies. Eur. J. Appl. Physiol. 86, 455– 468. https://doi.org/10.1007/s00421-002-0577-5
Zhu, Y., Starr, A., Su, S.H., Woodward, K.G., Haldeman, S., 1992. The H-reflex to magnetic stimulation of lower-limb nerves. Arch. Neurol. 49, 66–71. https://doi.org/10.1001/archneur.1992.00530250070018