HAL Id: cea-02931332
https://hal-cea.archives-ouvertes.fr/cea-02931332
Submitted on 6 Sep 2020
HAL is a multi-disciplinary open access
archive for the deposit and dissemination of
sci-entific research documents, whether they are
pub-lished or not. The documents may come from
teaching and research institutions in France or
abroad, or from public or private research centers.
L’archive ouverte pluridisciplinaire HAL, est
destinée au dépôt et à la diffusion de documents
scientifiques de niveau recherche, publiés ou non,
émanant des établissements d’enseignement et de
recherche français ou étrangers, des laboratoires
publics ou privés.
Quantification of spatial and temporal variations in trace
element fluxes originating from urban areas at the
catchment scale
Claire Froger, Cecile Quantin, Louise Bordier, Gaël Monvoisin, Olivier
Evrard, Sophie Ayrault
To cite this version:
Claire Froger, Cecile Quantin, Louise Bordier, Gaël Monvoisin, Olivier Evrard, et al.. Quantification of
spatial and temporal variations in trace element fluxes originating from urban areas at the catchment
scale. Journal of Soils and Sediments, Springer Verlag, In press, �10.1007/s11368-020-02766-1�.
�cea-02931332�
Quantification of spatial and temporal
1
variations in trace element fluxes
2
originating from urban areas at the
3
catchment scale
4 5
Claire Froger*,1,2,3, Cécile Quantin3, Louise Bordier2, Gaël Monvoisin3, Olivier Evrard2,Sophie Ayrault2
6 7
*Corresponding author: claire.froger@inrae.fr 8
Tel: ± 332 38 41 80 49 9
Address: INRA, 2163 avenue de la Pomme de Pin, 45075 ORLEANS CEDEX 2 10
1 INRAE, US1106 Unité Infosol, Centre de Recherches d’Orléans, CS 40001, Ardon, 45075 Orléans Cedex 2,
11
France 12
2 Laboratoire des Sciences du Climat et de l’Environnement (LSCE/IPSL), CEA-CNRS-UVSQ, Université
Paris-13
Saclay, 91191 Gif-sur-Yvette, France 14
3 Géosciences Paris Sud (GEOPS), Université Paris-Saclay – CNRS, 91400 Orsay, France
15 16 17 18 19 20 Manuscript 1 2 3 4 5 6 7 8 9 10 11 12 13 14 15 16 17 18 19 20 21 22 23 24 25 26 27 28 29 30 31 32 33 34 35 36 37 38 39 40 41 42 43 44 45 46 47 48 49 50 51 52 53 54 55 56 57 58 59 60
Abstract 21
Background, aim and scope 22
The release of trace elements (TE) associated with the development of human activities has accelerated since the 23
19th century, leading to the pollution of river systems. Despite a drastic reduction in industrial inputs in Northern
24
Europe, diffuse pollution originating from urban areas still prevents achieving the good status required by the 25
European Water Framework Directive. The objectives of the current study, which is a part of a wider project, were 26
to determine the impact of hydrological dynamics on the total exports of TE from an urban catchment and to 27
develop an assessment tool to evaluate the level of contamination of a catchment based on its specific particulate 28
TE fluxes. 29
Materials and methods 30
Accordingly, this research investigated the behavior of TE contamination in a 950-km2 catchment (Orge River,
31
France) showing a strong urbanization gradient in downstream direction. Particulate and dissolved samples were 32
collected in the river during a hydrological year at four stations reflecting the increasing urbanization gradient. 33
Trace element concentrations were measured in the samples using inductively coupled plasma/mass spectrometry 34
(ICP-MS). Daily and annual TE fluxes were calculated at the four stations to evaluate the contribution of urban 35
areas to the total TE exports from the catchment. 36
Results 37
The quantification of TE fluxes showed that up to 70% of particulate Cu, Zn, Sb and Pb exported by the Orge 38
River originated from the urban areas located in the lower catchment portions, especially during average water 39
flow periods characterized by frequent rain events. Moreover, the results show that 50% of the dissolved fluxes of 40
Cu, Zn and Pb are supplied by urban areas during the entire year, regardless of hydrological conditions, and that 41
the specific contribution of floods to these fluxes (i.e., the June 2016 event) is lower than that in other catchments 42
because of the continuous supply of dissolved metal fluxes to the river in this urbanized environment. 43
Conclusion 44
These results underline the need to integrate all hydrological conditions for the management of TE contamination 45
in urban areas and not to focus on storm events only. Finally, based on a literature survey, the ratios of specific 46
fluxes were homogeneous across different highly urbanized catchments, and they could be used as a tool to 47
compare the levels of anthropogenic pressure in theses contrasted study sites. This observation demonstrates the 48 1 2 3 4 5 6 7 8 9 10 11 12 13 14 15 16 17 18 19 20 21 22 23 24 25 26 27 28 29 30 31 32 33 34 35 36 37 38 39 40 41 42 43 44 45 46 47 48 49 50 51 52 53 54 55 56 57 58 59 60 61
similar impacts of societal development on urban river geochemistry worldwide, although they occurred during 49
different time periods. 50
Keywords: River, metal fluxes, urban runoff, annual fluxes, hydrological regime 51
52
1. Introduction
53Industrial development has led to deleterious impacts on the environment due to the release of trace elements (TE) 54
into rivers since the 19th century (Nriagu 1996). National and European environmental policies were implemented
55
to protect rivers and reduce untreated wastewater release into watercourses, resulting in a drastic decrease of TE 56
concentrations in the rivers (Le Cloarec et al. 2011; Zachmann et al. 2013). However, diffuse pollution still 57
threatens the good chemical status of rivers in developed countries, especially in urban environments, due to the 58
occurrence of multiple sources of TE (Pistocchi et al. 2019). Specifically, road traffic emissions such as (un)burnt 59
fuels, tires, brake pad wear (Adachi and Tainosho 2004; Adamiec et al. 2016), urban surface degradation (i.e., 60
roofs, roads; Charters et al. 2016) and industrial deposits (Brown and Peake 2006) are considered the main sources 61
of TE delivered to rivers via urban runoff. The Seine River basin in France offers an emblematic example of an 62
early-industrialized catchment that is strongly impacted by human activities because it has been accumulating 63
anthropogenic contaminants for more than a century (Meybeck et al. 2007; Ayrault et al. 2012). 64
In this context, several studies have attempted to identify the main sources of contaminants in urban watersheds 65
(Van Metre et al. 2008), and others evaluated the contribution of urban pollutants to river contamination (Van 66
Metre and Mahler 2003; Becouze-Lareure et al. 2016). Nevertheless, most of these studies focused on source-67
specific pathways of TE transfer to the river, such as urban storm water, direct road runoff or roof runoff (Lamprea 68
and Ruban 2011; Charters et al. 2016). At the catchment scale, the evaluation of each pathway’s contribution is 69
not straightforward. Therefore, representation of the complexity of urban inputs might be difficult to assess. 70
Moreover, additional contaminant sources such as unmonitored and untreated water releases originating from 71
domestic or industrial sources should be considered (Revitt and Ellis 2016). Therefore, it is important to 72
discriminate among TE sources and to quantify the impact of human activities on river water quality at the 73
catchment scale through calculation of the contaminant fluxes at the catchment scale (Horowitz et al. 2001; Ollivier 74
et al. 2011). Thus far, most pollutant balances have been calculated on an annual basis (Ollivier et al. 2011), and 75
studies were conducted either in notably large catchments with mixed land uses (Horowitz et al. 2001) or in small 76 1 2 3 4 5 6 7 8 9 10 11 12 13 14 15 16 17 18 19 20 21 22 23 24 25 26 27 28 29 30 31 32 33 34 35 36 37 38 39 40 41 42 43 44 45 46 47 48 49 50 51 52 53 54 55 56 57 58 59 60
drainage areas with a single dominant land-use type (McKee and Gilbreath 2015; Sabin et al. 2005). In the current 77
context of urban sprawl and increasing surface sealing, the need exists to quantify contaminant sources and budgets 78
in urban catchments. Urban streams are more reactive to storm events than rural basins, and the contaminant 79
concentrations in these urban rivers might be strongly variable during single events (Hasenmueller et al. 2017). To 80
improve the management of river contamination, it is necessary to understand the variations of urban inputs during 81
high water stages and extreme events (i.e. floods) characterized by high exports of suspended particulate matter 82
(SPM) (Navratil et al. 2012; Némery et al. 2013). 83
In this context, the Orge River, a subcatchment of the Seine River basin, was selected because of its high urban 84
pressure (i.e., 5000 inhabitants per km2 at the outlet) similar to that found in the vicinity of Paris City (i.e., 7000
85
inhabitants per km2). The results already published focused on sources of particulate TE using geochemistry tools
86
(i.e. enrichment factors, lead stable isotopes composition) and demonstrated an increasing contamination of 87
suspended particles with TE originating from urban surfaces (Le Pape et al. 2012; Froger et al. 2018). Moreover, 88
the dynamic and sources of polycyclic aromatic hydrocarbons contamination were also studied in this catchment 89
(Froger et al. 2019b, a). 90
In order to fully understand the behavior of TE contamination in the catchment, the current research addressed the 91
following issues of 1) identifying the dynamics of dissolved and particulate trace element fluxes in response to 92
hydrological changes including the occurrence of an extreme flood, 2) evaluate the level of contamination of the 93
entire catchment using a new assessment tool based on annual specific particulate fluxes. 94
95
2. Material and methods
962.1. Study site
97
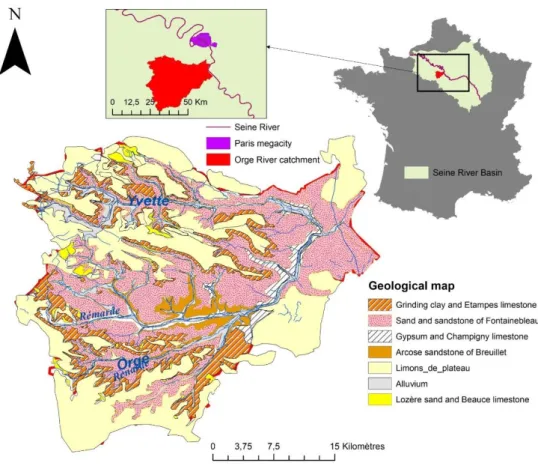
The samples were collected in the Orge River catchment presented in Fig1, which drains into the Seine River 30 98
km southeast of Paris City. Four river sampling sites have been monitored, with three located on the Orge River 99
and one on its main tributary, the Yvette River. The proportion of urban areas rises from 1% to 56% between the 100
upper catchment areas and the outlet. Meanwhile, population densities increase from 300 inhabitants per km2 at
101
the most rural site (Dourdan) to 5000 inh km-2 near the outlet (Viry). Although wastewater is treated mainly outside
102
of the catchment, misconnections in the sewage network are widespread, especially at the outlet, with connection 103
failures estimated at 20% (SAGE Orge-Yvette 2011). The geology of the catchment is characterized by Eocene 104 1 2 3 4 5 6 7 8 9 10 11 12 13 14 15 16 17 18 19 20 21 22 23 24 25 26 27 28 29 30 31 32 33 34 35 36 37 38 39 40 41 42 43 44 45 46 47 48 49 50 51 52 53 54 55 56 57 58 59 60 61
formations including carbonate rocks, marls and gypsum, and Oligocene formations dominated by Fontainebleau 105
sands (Schneider 2005; Le Pape et al. 2012). 106
107
2.2. Hydrological conditions
108
Seven sampling campaigns were organized from June 2015 to November 2016 and were selected to reflect the 109
contrasting hydrological conditions observed in the river (Fig S1). Water discharge measured at the outlet varied 110
from 1.6 to 39.7 m3 s-1 with a median value of 3.4 m3 s-1. A water flow class was attributed to each campaign. June
111
2015 and August 2016 were considered low flow periods (discharge <2 m3 s-1 at the outlet), January and November
112
2016 were campaigns that occurred during average flow periods (3-5 m3 s-1), and September 2015 and April 2016
113
were associated with high flow periods (discharge >5 m3 s-1). The sampling campaign organized on 06/06/2016,
114
during the decreasing stage of the June 2016 flood (discharge of 15 m3 s-1 recorded at the outlet), was considered
115
representative of the conditions that prevailed during this exceptional flood. 116
117
2.3. River sampling and geochemical analysis
118
2.3.1. Sampling protocol
119
First, sediment traps composed of PET bottles submerged in the river, approximately 30 cm under the surface 120
(see Fig S2), for 4 to 5 days were used to collect SPM by sedimentation (n = 27). The suspended solids collected 121
with the traps were decanted, separated from the supernatant and freeze-dried (Gateuille et al. 2014). Suspended 122
particulate matter sampled with sediment traps were shown to be representative of SPM transported in the river 123
(Priadi et al. 2011; Gateuille et al. 2014). 124
In addition, instantaneous samples of river water were collected during sediment trap installation and recovery (n 125
= 32, 4 per site and per campaign) using 1-L PET bottles and 10-L containers. Concentrations of suspended solids 126
were determined based on the instantaneous samples via filtration at 0.45 µm. In Egly (“E”), water samples were 127
collected from a pipe that continually discharged water into the river (Edischarge). All flasks and bottles were washed
128
with HNO3 5% and rinsed three times with ultrapure water before sampling. The bottles were washed several times
129
in the field prior to the sampling. Finally, physico-chemical parameters (pH, conductivity and temperature) were 130
measured during each sampling day. 131 1 2 3 4 5 6 7 8 9 10 11 12 13 14 15 16 17 18 19 20 21 22 23 24 25 26 27 28 29 30 31 32 33 34 35 36 37 38 39 40 41 42 43 44 45 46 47 48 49 50 51 52 53 54 55 56 57 58 59 60
132
2.3.2. Sample preparation and geochemical analysis
133
After filtration (<0.45 µm porosity), aliquots of river water samples were acidified (HNO3 0.5 N) for TE and cation
134
analysis. The remaining samples were stored for anion, silica and alkalinity measurements. Suspended particulate 135
matter collected with sediment traps were recovered using centrifugation (2800 g) and then freeze-dried. 136
The total digestion of 100 mg of finely crushed SPM was done in Teflon beakers, with a three-step procedure 137
using first a mixture of HF (4 mL, 30%) and HClO4 (2 mL, 67%) heated at 150°C for 6 hours. During the second
138
step, a mixture of HCl (3.75 mL, 30%) and HNO3 (1.25 mL, 67%) was added to the samples and heated at 120°C
139
for 3h20. Finally, the third digestion step consisted of three successive evaporations at 110°C of HNO3 (1 mL,
140
67%) added to the samples. The solution obtained after digestion was transferred to Falcon® (polyethylene) tubes 141
using 0.5 N HNO3 to obtain the 50 mL-final volume. To control the mineralization quality, a blank control was
142
included in each digestion batch (22 samples), as well as the Lake Sediment SL1 geostandard (AIEA). 143
Major elements (Ca, Na, Mg, K, Al, and Fe) were measured using atomic absorption spectrometry in the 144
mineralized SPM and the dissolved phases with a VARIAN AAS240FS instrument. Minor and trace element (V, 145
Cr, Mn, Co, Ni, Cu, Zn, As, Se, Rb, Sr, Mo, Ag, Cd, Sb, Cs, Ba, and Tl) contents of mineralized SPM and acidified 146
dissolved samples were determined with an inductively coupled plasma quadrupole mass spectrometer (ICP-QMS, 147
X-Series, CCT II & Thermoelectron, France). The control of ICP-QMS precision was done using a standard of 148
river water (SRM 1640a, NIST, USA), and the correction of instrumental drift was based on internal standards 149
deviation (Re, Rh and In). Collision Cell Technology mode using gas input (H2 (7%) and He (93%)) was used to
150
avoid interferences for elements such as Cr, Fe, Ni, Zn, and As. The standard error for TE concentrations measured 151
in the reference materials (NIST 1940a and SL1 AIEA) was less than 10%. The quantification limits for TE in the 152
dissolved phase were 0.07 µg L-1 for Cu, 0.01 µg L-1 for Zn, 0.02 µg L-1 for Sb and 0.06 µg L-1 for Pb.
153 154
2.4. Flux calculations
155
2.4.1. Daily fluxes for each subcatchment and contribution of the downstream subcatchment Virysub
156
The fluxes of trace elements exported by the Orge River were calculated based on Eqn 1 and 2. 157 Φ𝑝𝑎𝑟𝑡.,𝐼,𝑆 = [𝑇𝐸]𝑝𝑎𝑟𝑡.𝐼,𝑆× [𝑆𝑃𝑀]𝐼,𝑆 × 𝑄𝑟𝑖𝑣𝑒𝑟,𝐼𝑆 (1) 158 1 2 3 4 5 6 7 8 9 10 11 12 13 14 15 16 17 18 19 20 21 22 23 24 25 26 27 28 29 30 31 32 33 34 35 36 37 38 39 40 41 42 43 44 45 46 47 48 49 50 51 52 53 54 55 56 57 58 59 60 61
Φ𝑑𝑖𝑠𝑠.𝐼,𝑆 = [𝑇𝐸]𝑑𝑖𝑠𝑠,𝐼,𝑆 × 𝑄𝑟𝑖𝑣𝑒𝑟,𝐼𝑆 (2) 159
where Φpart,I,S and Φdiss,I,S are the daily exports of the particulate and dissolved phases respectively for campaign I
160
in g d-1 at site S, [TE]part.I,S is the concentration of TE in g t-1 in the suspended solids measured during campaign I
161
for site S, [TE]diss,I,S is the TE concentration in the dissolved phase in g m-3 measured during campaign I for site S,
162
[SPM]I,S is the total concentration of suspended solids in t m-3 measured during campaign I for site S, and Qriver,I,S
163
is the mean water flow rate for site S during campaign I in m-3 d-1. The fluxes were estimated using the median
164
values of [TE]part,I,S (n = 3), [SPM]I,S (n = 4) and [TE]diss,I,S (n = 2). The uncertainties of the TE fluxes were estimated
165
using the standard deviation of [TE]part,I,S and [TE]diss,I,S (i.e., SDET,part,I,S and SDET,diss,I,S (in %)) applied respectively
166
to Φpart,I,S and Φdiss,I,S.
167 168
The fluxes calculated at the Egly and Yvette sites corresponded to the exports from the upper portions of the Orge 169
River catchment. By calculation of the difference with the TE exported at the outlet of the entire catchment (i.e., 170
Viry site), we were able to calculate the contribution of the Virysub subcatchment (i.e., ContribViry sub in %; Eqn 3
171
and 4) to the total export of the Orge catchment for the particulate and dissolved phases in each campaign I: 172 Contrib𝑝𝑎𝑟𝑡.,𝐼,𝑉𝑖𝑟𝑦 𝑠𝑢𝑏= Φ𝑝𝑎𝑟𝑡.,𝐼,𝑉𝑖𝑟𝑦−(Φ𝑝𝑎𝑟𝑡.,𝐼,𝐸𝑔𝑙𝑦+ Φ𝑝𝑎𝑟𝑡.,𝐼,𝑌𝑣𝑒𝑡𝑡𝑒) Φ𝑝𝑎𝑟𝑡.,𝐼,𝑉𝑖𝑟𝑦 (3) 173 Contrib𝑑𝑖𝑠𝑠.,𝐼,𝑉𝑖𝑟𝑦 𝑠𝑢𝑏= Φ𝑑𝑖𝑠𝑠.,𝐼,𝑉𝑖𝑟𝑦−(Φ𝑑𝑖𝑠𝑠.,𝐼,𝐸𝑔𝑙𝑦+ Φ𝑑𝑖𝑠𝑠.,𝐼,𝑌𝑣𝑒𝑡𝑡𝑒) Φ𝑑𝑖𝑠𝑠.,𝐼,𝑉𝑖𝑟𝑦 (4) 174 175
2.4.2. Annual riverine exports of trace element and sediments
176
The mean annual exports of particulate and dissolved TE were calculated using the following equations (Eqn 6 177
and 7) based on data for each type of hydrological conditions (i.e., low, average, high water flow periods and the 178
extreme flood of June 2016), as described above (Section 2.2). 179 Φ𝑝𝑎𝑟𝑡,𝑆 = ∑365𝑖=1([𝑇𝐸]𝑝𝑎𝑟𝑡,𝑐,𝑆 × [𝑆𝑃𝑀]𝑐,𝑆 × 𝑄𝑖,𝑐,𝑆) (6) 180 Φ𝑑𝑖𝑠𝑠,𝑆 = ∑365𝑖=1([𝑇𝐸]𝑑𝑖𝑠𝑠,𝑐,𝑆 × 𝑄𝑖,𝑐,𝑆) (7) 181 182
The annual TE fluxes exported with the particulate phase (i.e. Φpart,S) and the dissolved phase (i.e. Φdiss,S) in g year
-183
1 at each site S were estimated as the sum of the daily fluxes calculated for each iday in g d-1. Those daily fluxes
184 1 2 3 4 5 6 7 8 9 10 11 12 13 14 15 16 17 18 19 20 21 22 23 24 25 26 27 28 29 30 31 32 33 34 35 36 37 38 39 40 41 42 43 44 45 46 47 48 49 50 51 52 53 54 55 56 57 58 59 60
were estimated using the median values of [TE]part,c,S in g t-1, [SPM]c,S in t m-3 and [TE]diss,c,S in g m-3 measured
185
during the campaigns associated with each water flow class c (defined in Section 2.2). The daily water flow Qi,c,S
186
in m3 d-1 was continuously recorded by automatic flowmeters located near each sampling site. Trace element
187
exports during the flood of June 2016 (from 05/29/2016 to 06/10/2016), were calculated using [SPM], [TE]diss and
188
[TE]part measured at each site on 06/06/2016.
189
The uncertainties of the TE annual fluxes were estimated using the standard deviations (SDTE,part,c,S and SDTE,diss,c,S
190
in %) of [TE]part,c,S and [TE]diss,c,S for each water flow class c and site S. These standard deviations were applied to
191
the daily TE fluxes Φpart,i,S and Φpart,i,S (in g d-1) to finally estimate the annual flux uncertainties SDΦpart,S and
192
SDΦdiss,S in kg y-1 (Eqn 5 and 6).
193
SD𝛷𝑝𝑎𝑟𝑡,𝑆 = ∑365𝑖=1(𝑆𝐷𝑇𝐸,𝑝𝑎𝑟𝑡,𝑐,𝑆 × 𝛷𝑝𝑎𝑟𝑡,𝑖,𝑆) (8) 194
SD𝛷𝑑𝑖𝑠𝑠,𝑆 = ∑365𝑖=1(𝑆𝐷𝑇𝐸,𝑑𝑖𝑠𝑠,𝑐,𝑆 × 𝛷𝑑𝑖𝑠𝑠,𝑖,𝑆) (9) 195
The sediment fluxes at each site S, ΦSY,S in t y-1 were estimated using Eqn 5:
196
Φ𝑆𝑌,𝑆 = ∑365𝑖=1([𝑆𝑃𝑀]𝑐,𝑆 × 𝑄𝑖,𝑐,𝑆) (10) 197
where [SPM]c,S is the concentration of SPM in t m-3 at each site S for each water flow class c, and Qi,c,S is the daily
198
water flow in m3 d-1. The uncertainties were estimated based on the standard deviation of [SPM]c,S using equation
199 11: 200 SD𝛷𝑆𝑌,𝑆 = ∑365𝑖=1(𝑆𝐷𝑆𝑃𝑀,𝑐,𝑆 × 𝛷𝑆𝑌,𝑖,𝑆) (11) 201 202 2.4.3. Specific fluxes 203
From the annual particulate TE fluxes calculated using Eqn 6 and the sediment yields using Eqn 10, the specific 204
fluxes of TE (FSTE,S) and the specific sediment yield (FSSPM,S) were estimated using the drainage area for each
205
subcatchment and used in the following equations (Eqn 12 and 13): 206 FS𝑇𝐸,𝑆= (Φ𝑇𝐸 𝑝𝑎𝑟𝑡,𝑆) 𝑆𝐷𝐶,𝑆 (12) 207 FS𝑆𝑃𝑀,𝑆=(Φ𝑆𝑆𝑌,𝑆) 𝐷𝐶,𝑆 (13) 208 1 2 3 4 5 6 7 8 9 10 11 12 13 14 15 16 17 18 19 20 21 22 23 24 25 26 27 28 29 30 31 32 33 34 35 36 37 38 39 40 41 42 43 44 45 46 47 48 49 50 51 52 53 54 55 56 57 58 59 60 61
Therefore, at each site S, the specific particulate TE flux in g km-2 y-1 and the specific sediment fluxes in t km-2 y
-209
1 were calculated using the respective annual particulate TE export (ΦTE,part,S) in g y-1 and the sediment fluxes
210
(ΦSY,S) in t y-1 with the surface area drained at site S SDC,S in km2. The calculations for the Viry site were considered
211
to correspond to the total of particulate TE exported by the entire catchment. The uncertainties of FSTE,S and FSSPM,S
212
were calculated using equations 12 and 13, with SDΦpart,S and SDΦSY,S respectively replacing FSTE,S and FSSPM,S.
213 214
3. Results and discussion
2153.1. Trace element variations in the water column in response to hydrological
216
changes under urban pressure
217
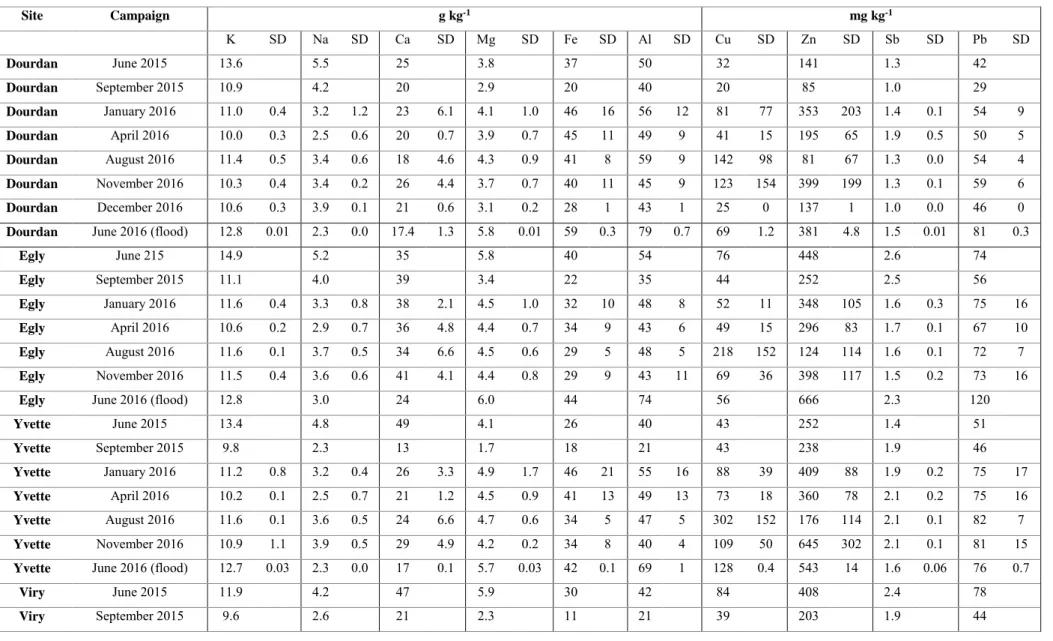
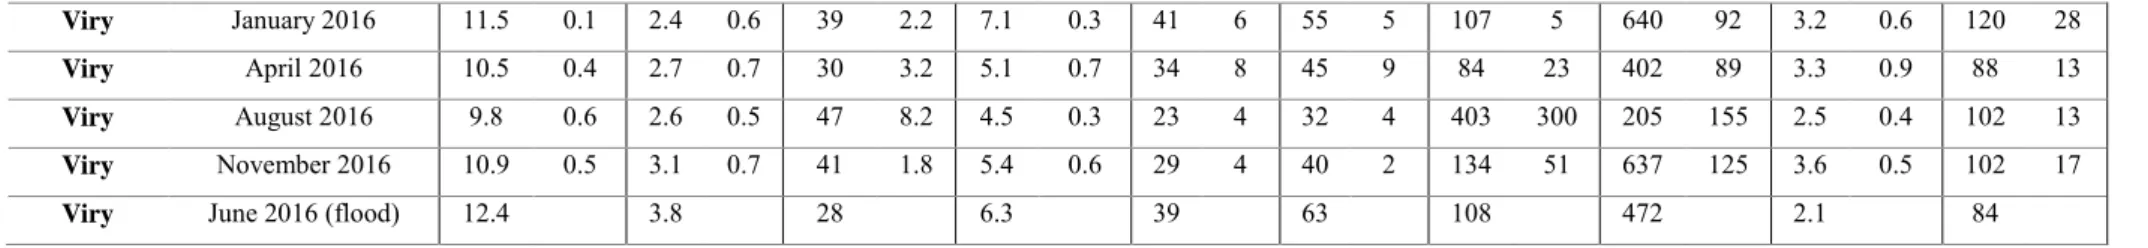
Identifying the sources of trace element contamination of the Orge River suspended particulate matter was the 218
objective of a previous study (Froger et al. 2018). In brief, concentrations ranged from 20 to 661 mg kg-1 for Cu,
219
from 34 to 980 mg kg-1 for Zn, from 0.98 to 4.36 mg kg-1 for Sb and from 29 to 151 mg kg-1 for Pb, with those
220
concentrations similar to the values found in the Seine River sediments (Le Pape et al. 2012). In this first study, 221
the clear increase in TE enrichment factors in SPM from Dourdan to Viry (Fig 1, Table S2) demonstrated trace 222
element contamination increasing with the densification of urban areas. In addition, lead stable isotopes 223
composition demonstrated the role of road deposited sediments as an important source of particulate TE to the 224
river system. 225
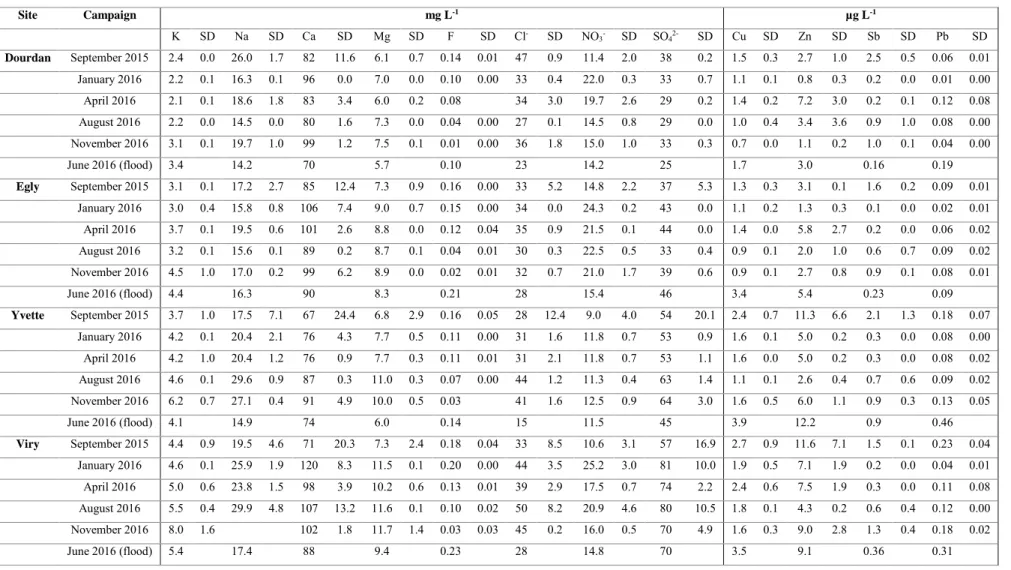
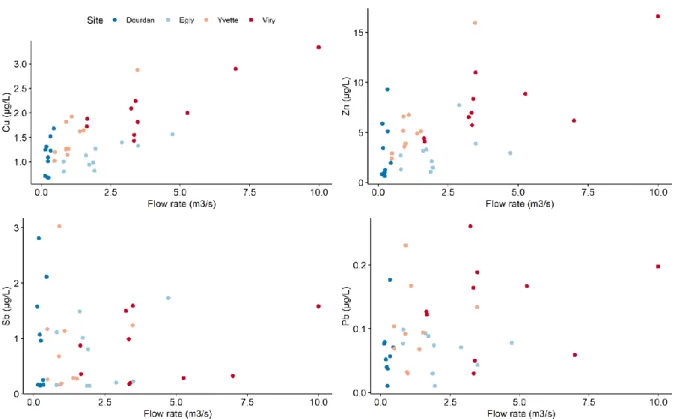
The dissolved trace elements concentrations shown in Fig 2 ranged from 0.7 to 4.8 µg L-1 for Cu, from 0.6 to 38.5
226
µg L-1 for Zn, from 0.1 to 3 µg L-1 for Sb and from 0.01 to 0.54 µg L-1 for Pb. The ranges of TE concentrations in
227
the dissolved compartment was similar to those found in previous measurements in the Orge River (Le Pape et al. 228
2012), and they remained below the target values of European guidelines (The European Parliament and the 229
Council of the European Union, 2013). Similar ranges of TE concentrations in dissolved form were observed in 230
other rivers draining urban areas such as the Elbe River (Weigold and Baborowski 2009), or industrialized rivers 231
such as the Lot River (Audry et al. 2004) or the Humber catchment in the UK (Neal et al. 1996). Slightly lower 232
concentrations were measured in the Seine River downstream of Paris City (Priadi et al. 2011), which demonstrates 233
that the Orge River contamination in the dissolved phase is particularly high. 234 1 2 3 4 5 6 7 8 9 10 11 12 13 14 15 16 17 18 19 20 21 22 23 24 25 26 27 28 29 30 31 32 33 34 35 36 37 38 39 40 41 42 43 44 45 46 47 48 49 50 51 52 53 54 55 56 57 58 59 60
The concentration of dissolved Cu, Zn and Pb increased significantly with the urbanization gradient in the 235
downstream direction (Fig 2, Kruskal-Wallis test, α = 0.05). The rise in those dissolved TE concentrations could 236
not be explained by physico-chemical parameters considering the absence of variations in pH and ionic strength 237
between sites (see Fig S3 in the SI). Consequently, anthropogenic activities were considered as a significant source 238
of dissolved TE in the Orge River. and this finding is supported by Le Pape et al. (2014) study that identified point-239
based urban releases as a significant source of Zn in the Orge River. This was also observed at Egly, by the high 240
Zn concentrations measured in the discharge of untreated wastewater (i.e., Edischarge; Fig 2). Significant Cu
241
concentrations in the Edischarge samples also suggest untreated wastewater releases as a potential source of Cu in the
242
river, as also observed in the Garonne River, where wastewater treatment plants were responsible for 20% of the 243
dissolved Cu inputs (Petit et al. 2013). Those hypotheses of untreated wastewater and runoff water origin for Cu 244
and Zn were supported by the correlation of Cu and Zn dissolved concentrations with the flow rate only for the 245
downstream sites Egly, Yvette and Viry impacted by urbanization (Fig S4 in the supp mat) and not for the upstream 246
site Dourdan. Given the homogeneous geology across the entire catchment in downstream direction (Fig S5), a 247
natural origin of those TE in the river could be ruled out. 248
With respect to the increase of dissolved Pb with the urbanization gradient, the lower concentrations measured in 249
Edischarge led us to rule out the hypothesis that untreated wastewaters might be a major source of Pb. Two hypotheses
250
could explain this increase of Pb in the dissolved compartment: i) the presence of contaminated colloids under 251
0.45 µm (i.e., porosity of the filter), and ii) desorption of anthropogenic Pb from contaminated particles as 252
anthropogenic lead was identified as more mobile (Kumar et al. 2013). In contrast to the trends observed for Cu, 253
Zn and Pb, the Sb concentrations remained stable across the entire catchment and indicated the absence of 254
significant inputs of dissolved Sb from urban areas therefore suggesting a natural origin of dissolved Sb. 255
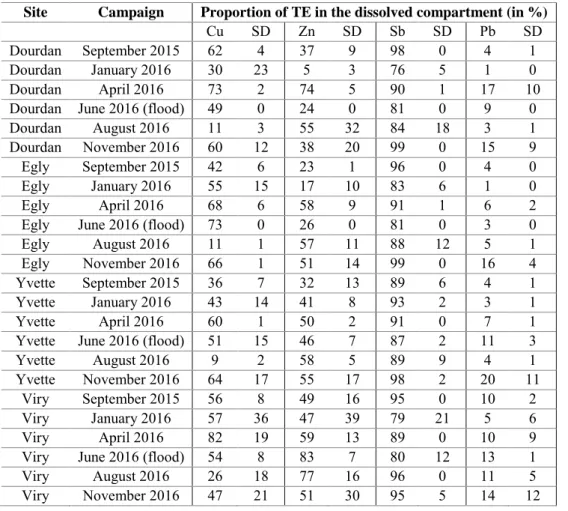
Trace element partitioning (see Table S4 in the SI) between dissolved and particulate phases showed variations 256
between campaigns depending on TE with no specific trend in downstream direction. Dissolved Cu accounted for 257
52 ± 22% with variations from 9 to 82% (min-max), and dissolved Zn for 49 ± 22% varying from 5 to 83 %, . 258
Most of the Sb was carried by the dissolved phase with a median value of 91 ± 9% of dissolved Sb and variations 259
from 0.3 to 24% of particulate Sb. In contrast, 80 to 99.5% of the Pb was carried by particles with a median value 260
of 94%. These observations are in agreement with those reported in the literature for major rivers (Davide et al. 261
2003; Rouxel et al. 2003; Audry et al. 2004) and for the Orge River (Le Pape et al. 2012). Differences of 262
partitioning between campaigns were statistically verified (i.e. Kruskal-Wallis test, p-value < 0.05), with similar 263
trends for Cu, Pb showing their highest proportion in the particulate phase during the campaigns conducted in 264 1 2 3 4 5 6 7 8 9 10 11 12 13 14 15 16 17 18 19 20 21 22 23 24 25 26 27 28 29 30 31 32 33 34 35 36 37 38 39 40 41 42 43 44 45 46 47 48 49 50 51 52 53 54 55 56 57 58 59 60 61
September 2015, January 2016 and August 2016. The proportion of particulate Zn and Sb reached their respective 265
highest values in September 2015 and January 2016 for Zn and in January and June 2016 for Sb. Those trends 266
could be explained by higher SPM concentrations at all sites in September 2015, June 2016, August 2016 and 267
January 2016, with respectively 45.5 mg L-1, 28.2 mg L-1, 26.1 mg L-1 and 17.1 mg L-1 compared to the
268
concentrations measured in April and November 2016 amounting to 11.5 mg L-1 and 6.3 mg L-1. Those results
269
suggest SPM concentration providing the main driver of TE partition in the water column. 270
271
3.2. Temporal variations of trace element fluxes
272
3.2.1. Daily fluxes of dissolved trace elements
273
The daily fluxes of dissolved trace elements are shown in Fig 3. The highest exports were found during the high 274
water levels of September 2015, with Cu, Zn, Sb and Pb fluxes respectively reaching 1700, 8000, 900 and 120 g 275
d-1 (Fig 3). However, exports of dissolved Sb and Pb during the high water levels that occurred in April 2016 were
276
lower than those observed in September 2015 despite similar river discharges. The major difference between those 277
two campaigns was the timing selected because samples from September 2015 were collected during the peak 278
flow with higher SPM concentrations in the river (42 mg L-1, 144 mg L-1 and 49 mg L-1 at the Egly, Yvette and
279
Viry sites, respectively) compared with the sampling of April 2016 conducted during the decreasing period of the 280
flood with lower SPM concentrations (12 mg L-1, 14 mg L-1 and 10 mg L-1, respectively, at the same sites). Higher
281
TE exports during the September 2015 sampling conducted during the peak flow might be explained by a 282
significant load of urban runoff contaminants at the beginning of the flood, also referred to as the “first flush effect” 283
(Lee et al. 2005; Barco et al. 2008). As the April 2016 sampling campaign was conducted after the peak flow, 284
those urban contaminants would have already been exported explaining the lower TE exports during this high 285
waters campaign. Despite the fact that the catchment surface drained at Egly site is about 3 times the surface 286
drained at Yvette site (i.e. 480 km2 for Egly and 180 km2 for Yvette), dissolved TE fluxes were similar. Those
287
similar fluxes could not be explained by water flow rates as Egly water flow was twice the rate at Yvette site 288
during all campaigns. Consequently, the Yvette River appears to be under higher anthropogenic pressure than the 289
Orge River at Egly with larger releases of dissolved TE contaminants given the resulting fluxes, which corresponds 290
to the higher proportion of urban areas, found at this particular site. 291
In addition, variations of daily fluxes at the outlet between the different hydrological periods (i.e. high flow, 292
average flow and low flow periods) appeared not to be directly proportional to the increase of the water flow rates. 293 1 2 3 4 5 6 7 8 9 10 11 12 13 14 15 16 17 18 19 20 21 22 23 24 25 26 27 28 29 30 31 32 33 34 35 36 37 38 39 40 41 42 43 44 45 46 47 48 49 50 51 52 53 54 55 56 57 58 59 60
Between low and high flow periods, water flow rates were multiplied by 4 whereas the daily fluxes of Cu, Zn Sb 294
and Pb were multiplied respectively by 6, 10, 6 and 5. Conversely, the difference between average and low flow 295
periods remained in the same range as water flow rate differences. Therefore, drastic increases of water flow rates 296
in the Orge catchment result in higher contamination levels across the water column, especially in dissolved Zn. 297
The results of inputs from Virysub (Table 1) showed that the downstream urban subcatchment of Virysub contributed
298
50% of the total dissolved Cu and Pb fluxes exported by the catchment and up to 75% of the total dissolved Zn 299
flux. The fluxes of dissolved TE from Viry subcatchment were much higher than its respective contribution to the 300
water discharge at the outlet, ranging from 15 to 23% (Table 1). Virysub supplied the majority of dissolved Cu, Zn
301
and Pb fluxes transiting the Orge River during all campaigns, the main hypothesis being the discharge of untreated 302
wastewaters and runoff into the river, supplying dissolved TE as well as highly contaminated particles with more 303
reactive TE-bearing phases. The stability of the mean Virysub contributions to the dissolved Cu and Pb exports,
304
regardless of hydrological conditions, suggests a continuous supply of diffuse TE pollutions from urban areas 305
(Estebe et al. 1998; Sabin et al. 2005). In contrast, the larger variations of the Virysub contribution to dissolved Zn
306
exports were likely explained by the occurrence of point-based sources such as untreated wastewater inputs 307
specifically enriched in this chemical element (Fig 2; Chen et al. (2009); Le Pape et al. (2012)). 308
Antimony showed a different behavior than Zn, Cu and Pb. The Virysub contributions to the total dissolved Sb
309
export were 15% during the September 2015 and August 2016 campaigns, i.e., during high and low flows, 310
respectively, equivalent to its contribution to the river water flow at the outlet (Table 1). In contrast, the 311
contribution of Virysub to the total dissolved Sb exported reached up to 31%, 42% and 42% in the January, April
312
and November 2016 campaigns, respectively, presenting different hydrological conditions (Table 1). During those 313
three campaigns, continuous urban runoff resulting from frequent rainfall events was identified as the main source 314
of particulate TE delivered to the Orge River SPM (Froger et al. 2018). Consequently, urban runoff might act as a 315
source of dissolved Sb, and possible desorption of Sb from contaminated particles could also contribute to the 316
increasing concentrations in the dissolved phase because road traffic is an important source of this element (Filella 317
2011; Fujiwara et al. 2011). 318
319
3.2.2. Daily fluxes of particulate trace elements
320
Particulate TE fluxes at the outlet ranged from 111 to 1065 g d-1 for Cu, from 248 to 5583 g d-1 for Zn, from 3 to
321
51 g d-1 for Sb and from 103 to 1202 g d-1 for Pb (Fig 4). The highest fluxes were observed during the September
322 1 2 3 4 5 6 7 8 9 10 11 12 13 14 15 16 17 18 19 20 21 22 23 24 25 26 27 28 29 30 31 32 33 34 35 36 37 38 39 40 41 42 43 44 45 46 47 48 49 50 51 52 53 54 55 56 57 58 59 60 61
2015 flood with the highest water flow rate (Fig 4) associated with high SPM concentrations. The lowest fluxes 323
were found during the low flow periods corresponding to the June 2015 campaign for Cu and Pb and to the August 324
2016 campaign for Zn and Sb. Those results differed from those of Poulier et al. (2019) who calculated the fluxes 325
in the Rhône River catchment showing lower concentrations of Hg and PCB in SPM during flood conditions. 326
Consequently, the behavior of particulate TE in the Orge River catchment likely reflects the widespread 327
contamination of soil and sediments in this early-industrialized catchment. 328
The contribution of the Virysub subcatchment to the total TE exported by SPM reached 70% (Table 2) during the
329
average flow periods (i.e., January and November 2016) and the high waters of April 2016. These higher 330
contributions could be attributed to diffuse urban inputs such as urban runoff, in line with the report by Froger et 331
al. (2018) that radionuclide chronometers and lead isotopic compositions identified road deposited sediments as a 332
major source of particulate TE to the river, especially during average flow periods. 333
3.3. Case of the exceptional flood of June 2016
334
3.3.1. Fluxes of dissolved and particulate trace elements
335
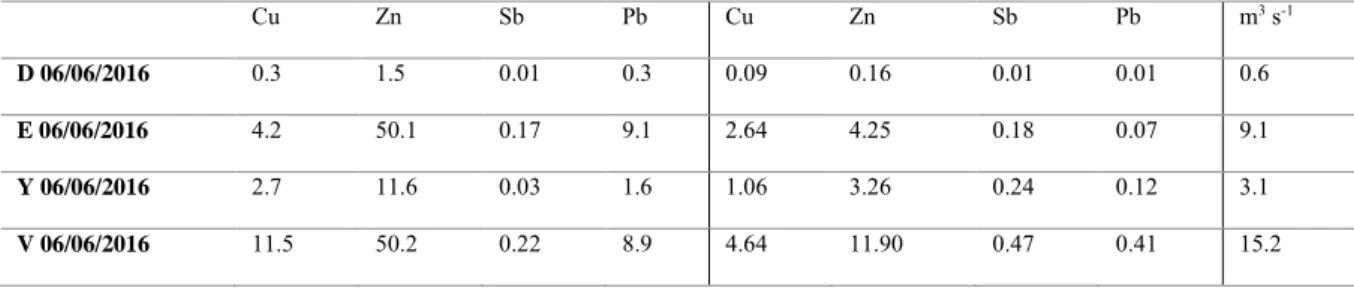
The fluxes of particulate and dissolved Cu, Zn, Sb and Pb exported at each sampling site for this flood were 336
calculated and are reported in Table 3. The particulate exports of Cu, Zn, Sb and Pb reached 12, 50, 0.22 and 9 kg 337
d-1 and were 10, 10, 4 and 7.5 times higher, respectively, than those fluxes measured during the high water flow
338
period of September 2015 (Table 3). Zinc, Sb and Pb exports from the Egly subcatchment were in the same range 339
as the fluxes estimated for the entire catchment (i.e., calculated at the Viry site) (Table 3). This observation could 340
be explained by the high TE concentrations measured in Egly SPM during this event, which reached 666 mg kg-1
341
for Zn and 120 mg kg-1 for Pb when the maximum concentrations for the other campaigns were 645 and 74 mg
342
kg-1, respectively (Table S1). Therefore, this extreme event resulted in a drastic increase in the export of particulate
343
TE at the Egly site, which could be considered as the outlet of the main agricultural area in the upstream portion 344
of the Orge River catchment. During the time of the flood, the cumulative effect of highly contaminated particles 345
and high SPM content in the water column resulted in a maximum TE export at the Egly site (Ollivier et al. 2011). 346
The fluxes of dissolved TE reached 4.6 kg d-1 for Cu, 11.9 kg d-1 for Zn, 0.47 kg d-1 for Sb and 0.41 kg d-1 for Pb
347
on the 6th of June 2016. Those exports were 3, 3.5 and 1.5 times higher than the respective fluxes of Cu, Pb and
348
Zn exported during the high waters of September 2015 (Fig 3). In contrast, Sb exports during the flood of June 349
2016 were lower than those during the high water flow period of September 2015, suggesting a dilution of 350
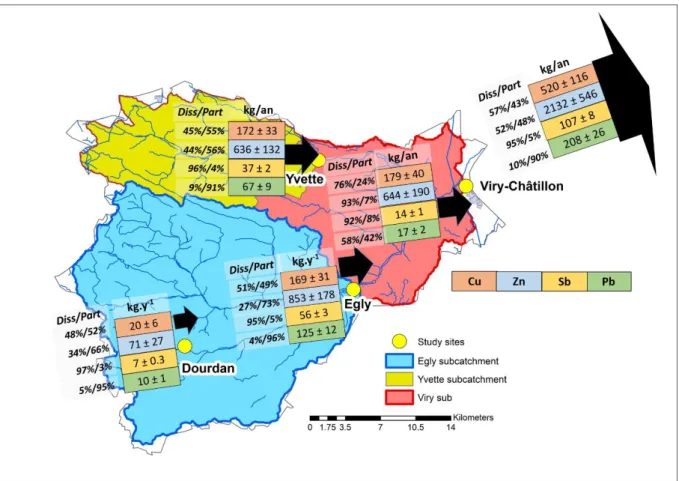
dissolved Sb during the exceptional June 2016 flood. From the different dissolved TE fluxes at the outlet (Viry) 351 1 2 3 4 5 6 7 8 9 10 11 12 13 14 15 16 17 18 19 20 21 22 23 24 25 26 27 28 29 30 31 32 33 34 35 36 37 38 39 40 41 42 43 44 45 46 47 48 49 50 51 52 53 54 55 56 57 58 59 60
and the sampling sites of Yvette and Egly, the contributions of each subcatchment (i.e., Egly, Yvette and Virysub)
352
were estimated (Fig 5). The contributions of the three subcatchments differed depending on the TE considered. 353
Dissolved Cu exported by each subcatchment was equivalent to its respective contribution to the total export of 354
water (i.e., waterflow distribution, Fig 5). This result could be explained by the homogeneous concentrations of 355
dissolved Cu over the catchment, indicating the absence of additional inputs from one specific subcatchment. In 356
contrast, the contribution of the Virysub subcatchment to the outlet daily fluxes of dissolved Zn and Pb reached
357
40% and 50%, respectively, underlining the supply of additional inputs, such as building siding, which has been 358
identified as the highest source of Pb and Zn in urban runoff (Davis et al. 2001). Finally, the higher contribution 359
of Sb from the Yvette subcatchment (Fig 5) could be explained by the presence of gypsum marls in the Yvette 360
riverbed (Vernoux et al. 1999), which could contain Sb because it is a widely diffused element in geological 361
material containing sulfates (Boyle and Jonasson 1984). During the flood, this material might have been drained 362
by groundwater releasing Sb in the river. Isotopic tools (i.e., δ66Zn, δ123Sb, 206Pb/207Pb) could be of help in
363
estimating the contribution of each source to the dissolved fluxes of Zn, Pb and Sb (Kumar et al. 2009; Chen et al. 364
2009; Resongles et al. 2015). 365
3.3.2. Contribution of June 2016 flood to the yearly export of trace elements
366
The total exports of TE during the June 2016 flood (from the 29th of May to the 10th of June 2016) were calculated
367
and reported in Table 4. The estimated fluxes were subsequently compared with the TE exported during the entire 368
year in 2016 (see Section 2.4.2.1 for detailed calculations) and are reported in Table 4. 369
Fifty to sixty percent of the annual particulate TE loads of 2016 was exported during the flood of June 2016, which 370
is lower than the amount estimated in previous studies showing that up to 90% of the annual fluxes could be 371
exported during flood events (Coynel et al. 2009; Ollivier et al. 2011). 372
During the flood of June 2016, higher TE concentrations in SPM were observed only at the Egly site (Section 373
3.3.1). In contrast, SPM collected at the Orge catchment outlet (i.e., the Viry site) showed TE concentrations of 374
108, 472, 2.1 and 84 mg kg-1 for Cu, Zn, Sb and Pb, respectively. These concentrations were similar to the median
375
values obtained in the Viry SPM during all other campaigns with 85 mg kg-1 for Cu, 408 mg kg-1 for Zn, 3.2 mg
376
kg-1 for Sb and 88 mg kg-1 for Pb. Those results explain the correspondence of the contribution of the flood to the
377
annual particulate TE exports (50-60%) with its contribution to the annual SPM export (56%) (Table 4 Le Gall et 378
al. (2018) analysed the flood sediments deposited during the exceptional June 2016 flood in the Seine River basin 379
and showed that sediment remobilization was the major source of particles transported during the flood in the Orge 380 1 2 3 4 5 6 7 8 9 10 11 12 13 14 15 16 17 18 19 20 21 22 23 24 25 26 27 28 29 30 31 32 33 34 35 36 37 38 39 40 41 42 43 44 45 46 47 48 49 50 51 52 53 54 55 56 57 58 59 60 61
catchment. However, conversely to the downstream part of the Seine River catchment showing enrichment factors 381
in flood sediment deposits lower than values reported during the last several decades (Le Gall et al. 2018), 382
enrichment factors in the Orge River SPM during the flood were equivalent to EF observed during the other 383
campaigns (see Table S2). Those results demonstrated the widespread contamination of the Orge catchment as a 384
result of long-term pollution from human activities in the area (Thévenot et al. 2007; Le Cloarec et al. 2011). In 385
addition to TE originating from sediment remobilization, anthropogenic TE deposited on urban surfaces such as 386
roads, roofs and sewer networks (Percot et al. 2016) could also contribute to the load of contaminated SPM 387
delivered to the river during the flood of June 2016. 388
The contribution of the flood of June 2016 to the annual dissolved TE fluxes reached up to 21% and 27% for Cu 389
and Pb, respectively, and 15% and 7% for Zn and Sb. Fourteen percent of the annual water flow was exported 390
during the flood, indicating that additional inputs of Cu and Pb were observed during this event. These inputs could 391
be due to runoff on surfaces that are usually not washed off during less intensive rainfall events, thus supplying 392
contaminated particles to the river. Moreover, a higher concentration of contaminated colloids under 0.45 µm 393
could increase TE concentrations in the dissolved fraction of the water column. In contrast to Cu and Pb, a dilution 394
effect was observed for Sb supporting a geogenic origin for dissolved Sb. Finally, concentrations of Zn in the 395
dissolved phase were not affected by June 2016 flood because its contribution of 15% to the annual Zn fluxes 396
matched its contribution to the annual water flow of 14%. Overall, the contribution of the June 2016 flood to the 397
export of dissolved TE followed the affinity to the particulate phase in the order Pb>Cu>Zn>Sb. 398
Finally, the major flood event that occurred in June 2016 contributed to 9, 37, 40 and 53% of the total annual 399
exports for Sb, Zn, Cu and Pb, respectively. These results underlined the specific behavior of such catchments 400
with highly urbanized surfaces downstream, where the export of TE is significant during regular hydrological 401
conditions and not only during flood events (Froger et al. 2018). These results also underline that Sb behaves quite 402
differently than other urban elements probably because Sb sources are both natural for dissolved Sb and 403
anthropogenic for particulate Sb. 404
3.4. Annual fluxes
405
The previous results demonstrated the homogenous release of all four contaminants (Cu, Zn, Sb and Pb) associated 406
with the particulate phase from urban areas in the Orge catchment. Conversely, heterogeneous dissolved TE inputs 407
from urban areas were shown, depending on the TE considered, with wide variations in TE concentrations between 408
campaigns (Fig 2). Consequently, particulate TE was identified as a reliable indicator to represent global TE 409 1 2 3 4 5 6 7 8 9 10 11 12 13 14 15 16 17 18 19 20 21 22 23 24 25 26 27 28 29 30 31 32 33 34 35 36 37 38 39 40 41 42 43 44 45 46 47 48 49 50 51 52 53 54 55 56 57 58 59 60
contamination of the catchment. Fluxes of particulate trace elements were estimated for the years 2015 and 2016, 410
and the interannual mean value was calculated. Specific TE fluxes and specific sediment yields were estimated for 411
a compilation of studies selected based on the catchment characteristics (i.e., urban/rural) and the available data 412
that allowed specific flux calculations (Table 5). 413
The annual specific loads of Cu, Zn, Sb and Pb found in the current research were 232, 1070, 5.7 and 197 g km
-414
2y-1, respectively, and these values are lower than most of the fluxes reported in the literature except for the Thames
415
River and the Colorado River (Table 5). The lower fluxes found in the Orge, Thames and Colorado River 416
catchments could be attributed to their specific sediment yields of respectively 2.3, 5.6 and 1 t km-2 y-1, values that
417
are 10 to 100 times lower than those reported in the other catchments. 418
We developed a new tool based on the ratio of specific particulate TE fluxes (i.e., FSTE) and specific sediment
419
yield (i.e., FSSPM) to evaluate and compare the level of anthropogenic pressure undergone by catchments having
420
different geographical and geological features (e.g., propensity to erosion) presented in Table 5. Consequently, the 421
FSTE/FSSPM ratio integrates the catchment parameters such as the solid fluxes and the drained surface which
site-422
to-site variation may precludes the observation of particulate contaminant flux variations. 423
In the Orge River catchment, the FSTE/FSSPM ratio increased in the downstream direction following the
424
urbanization gradient. The trace element specific fluxes of Virysub appeared to be similar to the fluxes estimated
425
for the entire catchment (i.e., at Viry station) despite the lower specific sediment yield calculated for the Virysub
426
subcatchment (i.e., FSSPM of 0.2 t km-2 y-1 for Virysub compared with 2.3 t km-2 y-1 for the entire catchment) (Table
427
4). This result indicates a lower amount of particles supplied by urban areas compared with rural areas and resulted 428
in high FSTE/FSSPM ratios for the most urban subcatchments, especially for Cu, Zn and Sb, which respectively
429
reached 707, 747 and 18 g t-1, values that are 7, 1.6 and 9 times the ratios of 101, 465 and 2.5 g t-1 found for the
430
entire catchment. Conversely, the Pb ratios of 114 g t-1 found for Virysub appeared to fall in the same range as the
431
entire catchment FSTE/FSSPM ratios. Therefore, the urban areas in the Orge River catchment were a significant
432
source of particulate Cu and Sb to the river. 433
In comparing with other catchments, catchments that drain large urban areas such as the Seine River (France), and 434
the Atlanta and San Francisco (USA) catchments, regardless of their drainage area, showed FSTE/FSSPM ratios for
435
Cu, Zn, and Pb of approximately 100, 500 and 100 g t-1, respectively (Table 5). The highest values were found in
436
the Seine River catchment, which is known for its long-term history of sediment contamination by TE (Meybeck 437
et al. 2007). The similar values of the FSET/FSSPM ratios for the Orge River catchment and the urban catchments
438 1 2 3 4 5 6 7 8 9 10 11 12 13 14 15 16 17 18 19 20 21 22 23 24 25 26 27 28 29 30 31 32 33 34 35 36 37 38 39 40 41 42 43 44 45 46 47 48 49 50 51 52 53 54 55 56 57 58 59 60 61
of Atlanta and San Francisco underlined the homogeneity of contamination in catchments that present a high 439
proportion of urban surfaces despite their various characteristics and sediment dynamics. Despite its lower urban 440
cover, the Garonne River catchment showed FSTE/FSSPM ratios similar to those found in the urban catchments of
441
Atlanta and San Francisco. These results can be explained by the drainage of Bordeaux city at the outlet and the 442
contamination of the Lot sub-catchment by mining and industrial activities (Audry et al. 2004). In catchments with 443
less urban cover, the Cu, Zn and Pb FSTE/FSSPM ratios are under 50, 300 and 60, respectively, with the Rhône River
444
presenting the highest values of the ratio, which reflects the presence of anthropogenic releases from cities such 445
as Lyon, Valence of Arles in the catchment (Ollivier et al. 2011). Finally, these findings confirm that similar to 446
the PAH case, the FSTE/FSSPM ratio is (Froger et al. 2019a) an effective tool that can be used to compare the
447
contamination level of catchments affected by anthropogenic activities. 448
449
4. Conclusions
450To conclude, management of contaminants at the catchment scale must be based on a deep knowledge of both the 451
sources and the behavior of contaminants in the river across the catchments. However, few studies have quantified 452
the fluxes of contaminants linked to an increase in urban areas at the catchment scale and the response of those 453
urban inputs to hydrological variations. In the current study, the fluxes of particulate Cu, Zn, Sb and Pb were 454
quantified. The contribution of the urban area in the downstream portion of the catchment to the total annual export 455
of particulate trace elements reached 70% during average water flow periods. Dissolved urban inputs remained 456
stable over the different hydrological conditions, with a contribution greater than 50% for Cu, Zn and Pb and 457
between 15 and 40% for Sb, suggesting that urban sources continuously supplied contaminants. The exceptional 458
flood of June 2016 exported 50 to 60% of the annual particulate TE load, and the particles transported were 459
identified as remobilized sediments, underlining the long-term contamination of the catchment. This observation 460
suggests the need to conduct longitudinal studies that integrate all hydrological conditions when assessing river 461
contamination, especially in an urban context. Finally, the ratios of specific fluxes underlined the similarities in 462
the contaminant exports of catchments that drain mostly urban areas and might be used to compare the levels of 463
anthropogenic pressure between urbanized catchments around the world. An assessment of the catchment state of 464
contamination using the ratio of specific fluxes could be performed to support policy implementations and local 465
actions to reduce contaminant releases. 466 467 1 2 3 4 5 6 7 8 9 10 11 12 13 14 15 16 17 18 19 20 21 22 23 24 25 26 27 28 29 30 31 32 33 34 35 36 37 38 39 40 41 42 43 44 45 46 47 48 49 50 51 52 53 54 55 56 57 58 59 60
Acknowledgements
468
This research was financially supported by Paris-Sud University (PhD grant), the ”Initiative de Recherche 469
Stratégique” ACE-ICSEN funded by the University Paris-Saclay and the Seine River research program PIREN-470
Seine. 471
472
Compliance with Ethical Standards
473
We declare that the current research respects the ethical standards of the journal, with no potential conflicts of 474
interest. and did not involve neither Human Participants nor animals. 475 1 2 3 4 5 6 7 8 9 10 11 12 13 14 15 16 17 18 19 20 21 22 23 24 25 26 27 28 29 30 31 32 33 34 35 36 37 38 39 40 41 42 43 44 45 46 47 48 49 50 51 52 53 54 55 56 57 58 59 60 61
References
Adachi K, Tainosho Y (2004) Characterization of heavy metal particles embedded in tire dust. Environ Int 30:1009–1017. https://doi.org/10.1016/j.envint.2004.04.004
Adamiec E, Jarosz-Krzemińska E, Wieszała R (2016) Heavy metals from non-exhaust vehicle emissions in urban and motorway road dusts. Environ Monit Assess 188:1–11. https://doi.org/10.1007/s10661-016-5377-1 Audry S, Schafer J, Blanc G, et al (2004) Anthropogenic components of heavy metal (Cd, Zn, Cu, Pb) budgets in
the Lot-Garonne fluvial system (France). Appl Geochemistry 19:769–786. https://doi.org/10.1016/j.apgeochem.2003.10.002
Ayrault S, Priadi CR, Pape P Le, Bonté P (2013) Occurrence, sources and pathways of antimony and silver in an urban catchment. In: Rauch S, Morrison G, Norra S, Schleicher N (eds) Urban Environment. Springer Netherlands, Dordrecht, pp 425–435
Ayrault S, Roy-Barman M, Le Cloarec MF, et al (2012) Lead contamination of the Seine River, France: Geochemical implications of a historical perspective. Chemosphere 87:902–910. https://doi.org/10.1016/j.chemosphere.2012.01.043
Barco J, Papiri S, Stenstrom MK (2008) First flush in a combined sewer system. Chemosphere 71:827–833. https://doi.org/10.1016/j.chemosphere.2007.11.049
Becouze-Lareure C, Dembélé A, Coquery M, et al (2016) Source characterisation and loads of metals and pesticides in urban wet weather discharges. Urban Water J 13:600–617. https://doi.org/10.1080/1573062X.2015.1011670
Boyle RW, Jonasson IR (1984) The geochemistry of antimony and its use as an indicator element in geochemical prospecting. J Geochemical Explor 20:223–302. https://doi.org/10.1016/0375-6742(84)90071-2
Brown JN, Peake BM (2006) Sources of heavy metals and polycyclic aromatic hydrocarbons in urban stormwater runoff. Sci Total Environ 359:145–155. https://doi.org/10.1016/j.scitotenv.2005.05.016
Charters FJ, Cochrane TA, O’Sullivan AD (2016) Untreated runoff quality from roof and road surfaces in a low intensity rainfall climate. Sci Total Environ 550:265–272. https://doi.org/10.1016/j.scitotenv.2016.01.093
1 2 3 4 5 6 7 8 9 10 11 12 13 14 15 16 17 18 19 20 21 22 23 24 25 26 27 28 29 30 31 32 33 34 35 36 37 38 39 40 41 42 43 44 45 46 47 48 49 50 51 52 53 54 55 56 57 58 59 60
Chen J, Gaillardet J, Louvat P, Huon S (2009) Zn isotopes in the suspended load of the Seine River, France: Isotopic variations and source determination. Geochim Cosmochim Acta 73:4060–4076. https://doi.org/10.1016/J.GCA.2009.04.017
Coynel A, Blanc G, Marache A, et al (2009) Assessment of metal contamination in a small mining- and smelting-affected watershed: high resolution monitoring coupled with spatial analysis by GIS. J Environ Monit 11:962–976. https://doi.org/10.1039/b818671e
Davide V, Pardos M, Diserens J, et al (2003) Characterisation of bed sediments and suspension of the river Po (Italy) during normal and high flow conditions. Water Res 37:2847–2864. https://doi.org/10.1016/S0043-1354(03)00133-7
Davis AP, Shokouhian M, Ni S (2001) Loading estimates of lead, copper, cadmium, and zinc in urban runoff from specific sources. Chemosphere 44:997–1009. https://doi.org/10.1016/S0045-6535(00)00561-0
Estebe A, Mouchel JM, Thevenot DR (1998) Urban runoff impacts on particulate metal concentrations. Water Air Soil Pollut 108:83–50. https://doi.org/10.1023/A:1005064307862
Filella M (2011) Antimony interactions with heterogeneous complexants in waters, sediments and soils: A review of data obtained in bulk samples. https://doi.org/10.1016/j.earscirev.2011.04.002
Froger C, Ayrault S, Evrard O, et al (2018) Tracing the sources of suspended sediment and particle-bound trace metal elements in an urban catchment coupling elemental and isotopic geochemistry, and fallout radionuclides. Environ Sci Pollut Res 25:28667–28681. https://doi.org/10.1007/s11356-018-2892-3 Froger C, Ayrault S, Gasperi J, et al (2019a) Innovative combination of tracing methods to differentiate between
legacy and contemporary PAH sources in the atmosphere-soil-river continuum in an urban catchment (Orge River, France). Sci Total Environ 669:448–458. https://doi.org/10.1016/j.scitotenv.2019.03.150
Froger C, Quantin C, Gasperi J, et al (2019b) Impact of urban pressure on the spatial and temporal dynamics of PAH fluxes in an urban tributary of the Seine River (France). Chemosphere 219:1002–1013. https://doi.org/10.1016/j.chemosphere.2018.12.088
Fujiwara F, Rebagliati RJ, Marrero J, et al (2011) Antimony as a traffic-related element in size-fractionated road
dust samples collected in Buenos Aires. Microchem J 97:62–67.
https://doi.org/10.1016/j.microc.2010.05.006 1 2 3 4 5 6 7 8 9 10 11 12 13 14 15 16 17 18 19 20 21 22 23 24 25 26 27 28 29 30 31 32 33 34 35 36 37 38 39 40 41 42 43 44 45 46 47 48 49 50 51 52 53 54 55 56 57 58 59 60 61
Gateuille D, Evrard O, Lefevre I, et al (2014) Mass balance and decontamination times of Polycyclic Aromatic Hydrocarbons in rural nested catchments of an early industrialized region (Seine River basin, France). Sci Total Environ 470–471:608–617. https://doi.org/10.1016/j.scitotenv.2013.10.009
Hasenmueller EA, Criss RE, Winston WE, Shaughnessy AR (2017) Stream hydrology and geochemistry along a
rural to urban land use gradient. Appl Geochemistry 83:136–149.
https://doi.org/10.1016/j.apgeochem.2016.12.010
Horowitz AJ (2009) Monitoring suspended sediments and associated chemical constituents in urban environments: Lessons from the city of Atlanta, Georgia, USA water quality monitoring program. J Soils Sediments 9:342– 363. https://doi.org/10.1007/s11368-009-0092-y
Horowitz AJ, Elrick KA, Smith JJ (2001) Annual suspended sediment and trace element fluxes in the Mississippi, Columbia, Colorado, and Rio Grande drainage basins. Hydrol Process 15:1169–1207. https://doi.org/10.1002/hyp.209
Hu B, Li J, Bi N, et al (2015) Seasonal variability and flux of particulate trace elements from the Yellow River:
Impacts of the anthropogenic flood event. Mar Pollut Bull 91:35–44.
https://doi.org/10.1016/j.marpolbul.2014.12.030
Kumar M, Furumai H, Kurisu F, Kasuga I (2013) Tracing source and distribution of heavy metals in road dust, soil and soakaway sediment through speciation and isotopic fingerprinting. Geoderma 211–212:8–17. https://doi.org/10.1016/j.geoderma.2013.07.004
Kumar M, Furumai H, Kurisu F, Kasuga I (2009) Understanding the partitioning processes of mobile lead in soakaway sediments using sequential extraction and isotope analysis. Water Sci Technol 60:2085–2091. https://doi.org/10.2166/wst.2009.512
Lamprea K, Ruban V (2011) Pollutant concentrations and fluxes in both stormwater and wastewater at the outlet of two urban watersheds in Nantes (France). Urban Water J 8:219–231. https://doi.org/10.1080/1573062X.2011.596211
Le Cloarec MF, Bonte PH, Lestel L, et al (2011) Sedimentary record of metal contamination in the Seine River during the last century. Phys Chem Earth 36:515–529. https://doi.org/10.1016/j.pce.2009.02.003
Le Gall M, Ayrault S, Evrard O, et al (2018) Investigating the metal contamination of sediment transported by the
1 2 3 4 5 6 7 8 9 10 11 12 13 14 15 16 17 18 19 20 21 22 23 24 25 26 27 28 29 30 31 32 33 34 35 36 37 38 39 40 41 42 43 44 45 46 47 48 49 50 51 52 53 54 55 56 57 58 59 60
2016 Seine River flood (Paris, France). Environ Pollut 240:125–139. https://doi.org/10.1016/j.envpol.2018.04.082
Le Pape P, Ayrault S, Michelot J-L, et al (2013) Building an isotopic hydrogeochemical indicator of anthropogenic pressure on urban rivers. Chem Geol 344:63–72. https://doi.org/10.1016/j.chemgeo.2013.02.018
Le Pape P, Ayrault S, Quantin C (2012) Trace element behavior and partition versus urbanization gradient in an urban river (Orge River, France). J Hydrol 472–473:99–110. https://doi.org/10.1016/j.jhydrol.2012.09.042 Le Pape P, Quantin C, Morin G, et al (2014) Zinc speciation in the suspended particulate matter of an urban river
(Orge, France): influence of seasonality and urbanization gradient. Environ Sci Technol 48:11901–11909. https://doi.org/10.1021/es500680x
Lee BC, Matsui S, Shimizu Y, Matsuda T (2005) Characterizations of the first flush in storm water runoff from an urban roadway. Environ Technol 26:773–782. https://doi.org/10.1080/09593332608618508
McKee LJ, Gilbreath AN (2015) Concentrations and loads of suspended sediment and trace element pollutants in a small semi-arid urban tributary, San Francisco Bay, California. Environ Monit Assess 187:. https://doi.org/10.1007/s10661-015-4710-4
Meybeck M, Lestel L, Bonté P, et al (2007) Historical perspective of heavy metals contamination (Cd, Cr, Cu, Hg, Pb, Zn) in the Seine River basin (France) following a DPSIR approach (1950-2005). Sci Total Environ 375:204–231. https://doi.org/10.1016/j.scitotenv.2006.12.017
Navratil O, Evrard O, Esteves M, et al (2012) Core-derived historical records of suspended sediment origin in a mesoscale mountainous catchment: the River Bléone, French Alps. J Soils Sediments 12:1463–1478. https://doi.org/10.1007/s11368-012-0565-2
Neal C, Davies H (2003) Water quality fluxes for eastern UK rivers entering the North Sea: a summary of information from the Land Ocean Interaction Study (LOIS). Sci Total Environ 314–316:821–882. https://doi.org/10.1016/S0048-9697(03)00086-X
Neal C, Smith CJ, Jeffery HA, et al (1996) Trace element concentrations in the major rivers entering the Humber estuary, NE England. J Hydrol 182:37–64. https://doi.org/10.1016/0022-1694(95)02940-0
Némery J, Mano V, Coynel A, et al (2013) Carbon and suspended sediment transport in an impounded alpine river (Isère, France). Hydrol Process 27:2498–2508. https://doi.org/10.1002/hyp.9387
1 2 3 4 5 6 7 8 9 10 11 12 13 14 15 16 17 18 19 20 21 22 23 24 25 26 27 28 29 30 31 32 33 34 35 36 37 38 39 40 41 42 43 44 45 46 47 48 49 50 51 52 53 54 55 56 57 58 59 60 61
Nriagu JO (1996) A History of Global Metal Pollution. Science (80- ) 272:223–0. https://doi.org/10.1126/science.272.5259.223
Ollivier P, Radakovitch O, Hamelin B (2011) Major and trace element partition and fluxes in the Rhône River. Chem Geol 285:15–31. https://doi.org/10.1016/j.chemgeo.2011.02.011
Percot S, Ruban V, Roupsard P, et al (2016) A new method for assessing the contribution of atmospheric deposition to the stormwater runoff metal load in a small urban catchment. Water Air Soil Pollut 227:1–13. https://doi.org/10.1007/s11270-016-2794-2
Petit JCJ, Schäfer J, Coynel A, et al (2013) Anthropogenic sources and biogeochemical reactivity of particulate and dissolved Cu isotopes in the turbidity gradient of the Garonne River (France). Chem Geol 359:125–135. https://doi.org/10.1016/j.chemgeo.2013.09.019
Pistocchi A, Dorati C, Aloe A, et al (2019) River pollution by priority chemical substances under the Water Framework Directive: A provisional pan-European assessment. Sci Total Environ 662:434–445. https://doi.org/10.1016/j.scitotenv.2018.12.354
Poulier G, Launay M, Le Bescond C, et al (2019) Combining flux monitoring and data reconstruction to establish annual budgets of suspended particulate matter, mercury and PCB in the Rhône River from Lake Geneva to the Mediterranean Sea. Sci Total Environ 658:457–473. https://doi.org/10.1016/j.scitotenv.2018.12.075 Priadi C, Bourgeault A, Ayrault S, et al (2011) Spatio-temporal variability of solid, total dissolved and labile metal:
passive vs. discrete sampling evaluation in river metal monitoring. J Environ Monit 13:1470. https://doi.org/10.1039/c0em00713g
Resongles E, Freydier R, Casiot C, et al (2015) Antimony isotopic composition in river waters affected by ancient mining activity. Talanta 144:851–861. https://doi.org/10.1016/j.talanta.2015.07.013
Revitt DM, Ellis JB (2016) Urban surface water pollution problems arising from misconnections. Sci Total Environ 551–552:163–174. https://doi.org/10.1016/j.scitotenv.2016.01.198
Rouxel O, Ludden J, Fouquet Y (2003) Antimony isotope variations in natural systems and implications for their use as geochemical tracers. Chem Geol 200:25–40. https://doi.org/10.1016/S0009-2541(03)00121-9 Sabin LD, Jeong HL, Stolzenbach KD, Schiff KC (2005) Contribution of trace metals from atmospheric deposition
to stormwater runoff in a small impervious urban catchment. Water Res 39:3929–3937.
1 2 3 4 5 6 7 8 9 10 11 12 13 14 15 16 17 18 19 20 21 22 23 24 25 26 27 28 29 30 31 32 33 34 35 36 37 38 39 40 41 42 43 44 45 46 47 48 49 50 51 52 53 54 55 56 57 58 59 60
https://doi.org/10.1016/j.watres.2005.07.003
SAGE Orge-Yvette (2011) Actualisation de l’état des lieux et du diagnostic
Schneider V (2005) Apports de l’hydrodynamique et de la géochimie à la caractérisation des nappes de l’Oligocène et de l’Eocène et à la reconnaissance de leurs relations actuelles et passées: origine de la dégradation de la nappe de l’Oligocène (sud-ouest du bassin de Paris. PhD Thesis. Paris-Sud University
The European Parlament and the Council of the European Union (2013) Directives of 12 August 2013 amending Directives 2000/60/EC and 2008/105/EC as regards priority substances in the field of water policy. Off. J. Eur. Union 2013:1–17
Thévenot DR, Moilleron R, Lestel L, et al (2007) Critical budget of metal sources and pathways in the Seine River basin (1994-2003) for Cd, Cr, Cu, Hg, Ni, Pb and Zn. Sci Total Environ 375:180–203. https://doi.org/10.1016/j.scitotenv.2006.12.008
Van Metre P., Mahler B. (2003) The contribution of particles washed from rooftops to contaminant loading to urban streams. Chemosphere 52:1727–1741. https://doi.org/10.1016/S0045-6535(03)00454-5
Van Metre PC, Mesnage V, Laignel B, et al (2008) Origins of sediment-associated contaminants to the Marais Vernier, the Seine Estuary, France. Water Air Soil Pollut 191:331–344. https://doi.org/10.1007/s11270-008-9628-9
Vernoux J, Barbier J, Donsimoni M, et al (1999) Etude hydrogéologique du plateau de Saclay (Essonne), rapport BRGM SGR/IDF R 40840
Weigold F, Baborowski M (2009) Consequences of delayed mixing for quality assessment of river water: Example Mulde-Saale-Elbe. J Hydrol 369:296–304. https://doi.org/10.1016/j.jhydrol.2009.02.039
Zachmann DW, van der Veen A, Friese K (2013) Floodplain lakes as an archive for the metal pollution in the River Elbe (Germany) during the 20th century. Appl Geochemistry 35:14–27. https://doi.org/10.1016/j.apgeochem.2013.05.009 1 2 3 4 5 6 7 8 9 10 11 12 13 14 15 16 17 18 19 20 21 22 23 24 25 26 27 28 29 30 31 32 33 34 35 36 37 38 39 40 41 42 43 44 45 46 47 48 49 50 51 52 53 54 55 56 57 58 59 60 61