Decentralized Economic Dispatch for
Radial Electric Distribution Systems
by
Sruthi Davuluri
B.S. Mechanical Engineering
University of California,
Berkeley (2017)Submitted to the Institute for Data, Systems, and Society
in partial fulfillment of the requirements for the degree of
Master of Science in Technology and Policy
at the
MASSACHUSETTS INSTITUTE OF TECHNOLOGY
June 2019
C Massachusetts Institute of Technology
2019.All rights reserved.
Signature redacted
Author
Technology and Policy Program
Signature redacted
May10,2019
Certified by
Christopher Knittel
George P. Shultz Professor of Applied Economics, Sloan School of Management
Director of the Center for Energy and Environmental Policy Research
Thesis Supervisor
Certifiedby
_Signature
redacted
Marija Ilic
Senior Research Scientist, Laboratory for Information and Decision Systems
Professor Emerita of Electrical & Computer Engineering, Carnegie Mellon University
Thesis Supervisor
Accepted by
Signature redacted
MASSACHUSETTS INSTITUTE
Noelle Eckley Selin
OF TECHNOLOGY
Director, Technology and Policy Program
Associate Professor, Institute for Data, Systems, and Society
JUN
0
4 2019
Department of Earth, Atmospheric and Planetary Sciences
LIBRARIES
ARCHIVES
Decentralized Economic Dispatch for
Radial Electric Distribution Systems
by
Sruthi Davuluri
Submitted to the Institute for Data, Systems, and Society on May 10, 2019, in partial fulfillment of the
requirements for the degree of Master of Science in Technology and Policy
Abstract
Electricity power systems, typically a very slow-moving and traditional industry, is in a state of flux as technological innovations, such as rooftop solar, home energy management systems, and electric vehicles, are being rapidly integrated into electric distribution systems. As the need to decarbonize the electricity sector becomes increasingly important, a distribution system operator could serve a useful purpose by operating distribution systems and acting as the market operator at a sufficiently granular level to potentially improve resiliency, decrease delivery losses, and send appropriate price signals to its customers. Currently, this latter functionality is assumed to be done using centralized economic dispatch. Given a very large number of small customers and their diverse preferences, it would be computationally expensive to implement centralized economic dispatch at the distribution level with perfect information.
In this thesis, an alternative algorithm, referred to as decentralized economic dispatch, is introduced which dispatches power for radial electric distribution systems while accounting for heterogeneous demand functions across customers, demonstrating computationally feasibility, and respecting the physical limits of the system. Unlike other approaches proposed in literature, which often take many iterations or do not converge, the algorithm introduced here converges to the same solution as a centralized operator with perfect information, and does so with only two sweeps across the system. A proof-of-concept example on a 46-bus system demonstrates the physical and economic benefits of the distributed algorithm with varying levels of distributed energy resources.
Thesis Supervisor: Christopher Knittel
Title: George P. Shultz Professor of Applied Economics, Sloan School of Management Director of the Center for Energy and Environmental Policy Research
Thesis Supervisor: Marija Ilic
Title: Senior Research Scientist, Laboratory for Information and Decision Systems Professor Emerita of Electrical & Computer Engineering, Carnegie Mellon University
Acknowledgments
I would like to express my gratitude to the multitude of people who made my time in Cambridge so
warm and full of love, who helped me through the highest highs and lowest lows over the past two years, and are now making it so terribly difficult to say goodbye to New England.
Professor Chris Knittel, thank you for believing in me since day one, for teaching me how to critically question energy policies, and how to strategically articulate contentious claims in the energy field without stepping on anyone's toes. I gained so much experience in your research group by recognizing that I could quickly learn even the most difficult topics, such as machine learning, and how to collaborate with startups, utility companies, energy companies, and other academics. Most of all, thank you for letting me go down this winding path and get lost in the complex, open questions that our industry faces today.
Professor Marija Ilic, who found me lost on this winding path, helped bridge the gap between my curiosity and the technical expertise I was looking for. I learned so much by iterating through our algorithm and working on your white board for hours on end. I am so grateful for the technical and emotional support that you have given me over the past year, along with your time. Rupa, thank you so much for your time formalizing the algorithm and for helping me with the implementation all of those late nights in Stata.
Furthermore, thank you to my loving mother who is always ready to pick up the phone, send me flowers on a rainy day, and was the first person to read my thesis as I was writing. Thank you to my father for igniting my curiosity and excitement in the energy field about a decade ago, which remains far from being extinguished. Abhinav, thanks for helping me keep things in perspective, for always having the most fitting Spotify playlists, and for being someone I have always looked up to! Suppy Atha, thanks for consistently checking on me and making me smile. Thank you to Srikar for watching over me, as a big brother, during my time in both the Bay and in Boston. Bhargavi, you have been encouraging my energy-focused career ever since I was in high school and I cannot thank you enough for your advice over the years.
Additionally, thank you to my colleagues and mentors in Santiago de Chile, who inspired my interest in this specific topic last summer. Finally, thank you to all of my friends in Cambridge, Ghana, Chile, and around the world, who made this such an unforgettable experience. During every single difficult moment; including the late nights, all of the debugging, and my knee injury, I have been surrounded
by my unshakable support system who has made me a stronger person and prepared me for my next
steps. More importantly, I would not have enjoyed these two years as much as I did without destressing on the Charles, on fny (Wenjia's) bike, on the courts, in the pool, on the ice, on the tables, and on the dancefloor. Thank you to my MIT community for teaching me these diverse skills but also reframing my way of thinking through invigorating conversations. In the name of the Golden Bears and evolving power systems -Fiat Lux!
6
Contents
List of Figures 9
List of Tables 11
1 Background 13
1.1 Basics of Power Systems . . . . 14
1.2 Electricity Regulation . . . . 16
1.2.1 Electricity Regulators . . . . 16
1.3 Restructuring of the Electricity Industry . . . . 17
1.3.1 Electricity Industry prior to Restructuring . . . . 18
1.3.2 Electricity Restructuring in Chile . . . . 19
1.3.3 Restructuring of the Electricity Industry in the United States . . . . 20
1.4 Tariff Design . . . . 23
2 Role of a Distribution System Operator 27 2.1 Advantages of a Distribution System Operator . . . . 28
2.1.1 Resiliency . . . . 29
2.1.2 Encourage the Integration of Distributed Energy Resources . . . . 29
2.1.3 Reliability . . . . 30
2.1.4 Impact on Infrastructure Costs . . . . 30
2.1.5 Decrease Transportation Losses . . . . 31
2.1.6 Bidirectional Power Flow . . . . 32
2.1.7 Inefficient Electricity Tariffs . . . . 32
2.2 Regulatory Intervention regarding Microgrids . . . . 33
2.2.1 United States . . . . 33
2.2.2 Puerto Rico . . . . 35
2.2.3 Canada . . . . 36
CONTENTS
2.2.4 Chile ... ... 37
2.3 Additional Barriers for DSOs and Urban Microgrids . . . . 37
2.3.1 Pushback from Utilities . . . . 38
2.3.2 Lack of Strong Consumer Incentive . . . .. 38
2.3.3 Economic Concerns . . . . 39
2.4 Current Implementations of Urban Microgrids in the United States . . . . 39
2.4.1 California . . . . 40
2.4.2 M idw est . . . . 41
3 Facilitating Energy Transactions at the Distribution Level 43 3.1 Motivation Behind Energy Transactions . . . . 45
3.1.1 Distribution-Level Locational Marginal Price . . . . 45
3.1.2 Heterogeneous Demand Functions . . . . 46
3.2 Literature Review on Alternative Energy Trading Approaches . . . . 49
3.3 Proposed Energy Trading Platforms . . . . . . . ... .. 52
3.4 Markets Allowing for Energy Transactions: Implementations in Practice . . . . 55
4 Dispatching at the Distribution Level 57 4.1 Optimal Power Flow . . . . 57
4.2 Decentralized Economic Dispatch . . . . 59
4.3 8-Bus Proof of Concept... ... 62
4.4 Implementation on the System in Flores . . . . 65
4.5 Estimating Electricity Demand Functions . . . . 68
4.5.1 Power Dispatching and Nodal Prices under Varying Levels of DERs . . . . 70
4.5.2 Advantages of Decentralized Algorithm . . . . 76
5 Economic Implications 77 5.1 Theoretical Economic Benefits of Energy Transactions . . . . 77
5.2 Analyzing the Change in Welfare . . . . 79
5.3 Total Cost Under All of the Cases . . . . 81
6 Conclusion 83 6.1 Future W ork . . . . 84
6.2 Relevance . . . . 84
List of Figures
1-1 Power Systems Schematic (Csanyi, 2017) . . . . 15
1-2 Radial and Meshed Networks . . . . 16
1-3 Economic Inefficiencies Caused by Fixed Retail Rates (Newell et al., 2009) . . . . 23
2-1 Global Investments in the Power Sector by Technology (Fatih Birol, 2018) . . . .. 31
3-1 Potential Platform Market Structure Proposed by Ed Cazalet (Cazalet et al., 2016) . . . 53
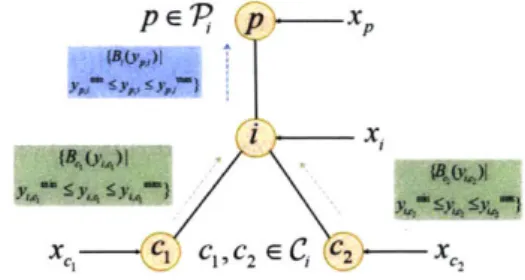
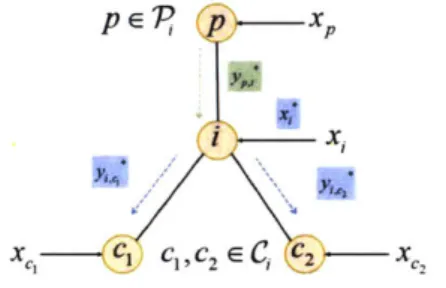
3-2 Potential Platform Market Structure Proposed by TCR to NYSERDA (Tabors et al., 2016) 54 4-1 Information exchange during the phase of forward sweep: The communicated informa-tion from the children nodes is shown in green and the one computed to be sent to the parent node is shown in blue (Jaddivada et al., 2019). . . . . . . . . 60
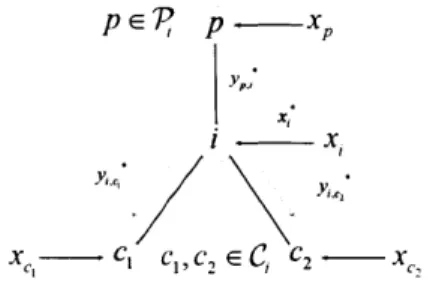
4-2 Information exchange during the phase of Backward sweep: The information from the parent node is shown in green and the information computed at node i, intended to be sent to children nodes is shown in blue . . . . 62
4-3 Eight-Node Network . . . . 63
4-4 Electrical Network of Flores Island Ilic, Xie, et al., 2013 . . . . 66
4-5 Topography of 46-Bus Radial Distribution System . . . . 66
4-6 Economic Intuition Behind Cost Functions with (a) Positive Q implying consumption and (b) Negative
Q implying
consumption (Hug et al., 2015) . . . . 694-7 Power dispatched and nodal prices under the case where all of the customers are purely consumers and have an Ed = -0.1 . . . . 71
4-8 Power dispatched and nodal prices under the case where all of the customers are purely consumers and have an Ed = -0.3 . . . . 72
4-9 Power dispatched and nodal prices under the case where half of the randomly selected residents have solar PV . . . .
. 73
10 LIST OF FIGURES
4-10 Power dispatched and nodal prices under the case where half of the randomly selected
residents have solar PV and half were randomly selected to have EVs . . . . 74
4-11 Power dispatched and nodal prices under the case where half of the randomly selected
residents have both solar PV and EVs . . . . 75 4-12 Power dispatched and nodal prices under the case where All Residential Customers have
Rooftop PV . . . . 75 4-13 Power dispatched and nodal prices under the case where All Residential Customers have
Rooftop PV and Electric Vehicles . . . . 76
List of Tables
4.1 Cost Functions of Eight Buses and System Parameters . . . . 64
4.2 Bid Functions and Flow Constraints of Eight Buses . . . . 64 4.3 Optimal Power Injections of an 8-Bus System . . . . 65
5.1 Total Cost of Producing Energy when using Centralized and Decentralized Methods . . 82
12 LIST OF TABLES
Chapter
1
Background
Electricity has certain characteristics which make it a unique product to purchase and sell. Along with other forms of energy, electricity has a very inelastic demand function, meaning that the quantity demanded does not fall much when prices are high. Everybody in the developed world consumes electricity, yet customers typically do not have a clear estimate of how much electricity they consume per day, the price per unit of electricity, or the proper units used to measure electricity Another way in which electricity varies from other products is that the time between generation and consumption is very short, which will remain imperative until energy storage technologies become more affordable and accessible. This is becoming increasingly relevant with variable renewable energy generation, such as wind and solar energy, which provides a level of intermittency that adds uncertainty to the system.
Presently, electricity service to small urban customers is done by providing sufficient generation through the transmission/sub-transmission networks to the points of contacts (feeders) which further distribute power to the customers via a distribution grid. The distribution grid is sized to support peak historic electricity use. Currently, power is not dispatched individually to the small end users. Instead, whatever is consumed gets provided according to basic physical power flow laws. Recently, distribution companies are considering the implementation of distribution control centers so that power is dispatched in a more granular way to the customers. The potential role of a distribution system operator in the future is discussed in Chapter 2, followed by a discussion surrounding energy transactions in Chapter 3.
Dispatching power could be implemented using centralized economic dispatch, much the same way as it is done in the control centers of transmission/sub-transmission systems at present. An alternative approach to centralized economic dispatch is proposed and it is described in Chapter 4. This algorithm is fundamentally decentralized, and it requires only minimal communications among the end users. It
CHAPTER 1. BACKGROUND
is shown to converge to the same solution as the centralized economic dispatch which requires perfect information and would be complex to implement in urban areas with very large number of customers. The economic implications of said algorithm are then explored further in Chapter
S.
The concluding remarks include the open questions for future work and the relevance of the proposed concepts inChapter 6.
1.1
Basics of Power Systems
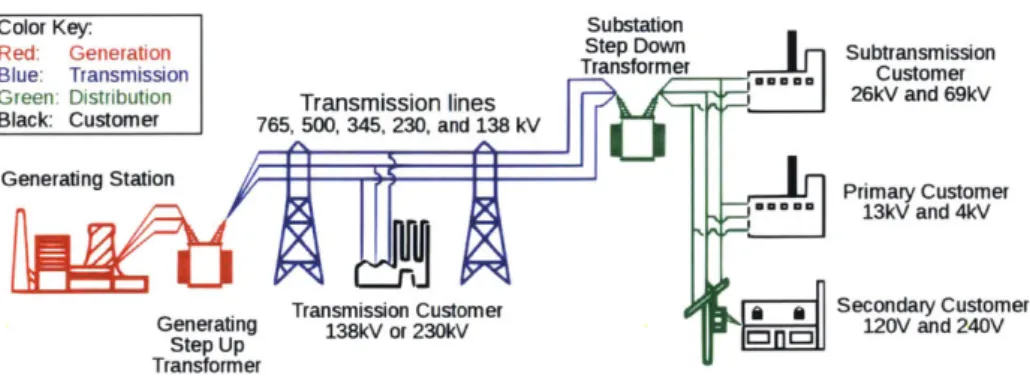
There are four relevant stages of power systems between the point where electricity is generated and the point where a light switch is turned on: electricity generation, transmission, distribution, and retailing.
Generation The first stage, energy generation, was traditionally provided by a centralized energy
producer, such as a power plant. While centralized generators used to be the main contributor to the energy generated for the electricity grid, there has been a heightened appearance of Independent Power Producers (IPPs). They either sell the electricity to the utilities, or directly to consumers. Both centralized generators and IPPs have a substation nearby to perform a voltage transformation of raising the voltage before the energy is transported across the transmission system.
Transmission Systems The next stages of the electricity sector, electric power transmission and electric power distribution, make up the traditional 'electric grid.'
Power is transmitted across large distances in high voltage in order to prevent losses. Low-voltage lines lose more energy across distances than high-voltage lines. The transmission system has High-Voltage (HV), between 11o kV and 230 kV, and Extra High-Voltage (EHV) lines, which transmit energy from
the generator to a centralized substation or switching station, or a location closer to the consumer (Beaty, 1998). After transmitting power across long distances, typically with overhead transmission lines, it reaches another substation where the voltage is lowered before the energy is transmitted to the distribution lines. These substations are typically located closer to where the energy is consumed, such as in cities, towns, or large industrial sites. When the system expands or the existing infrastructure is insufficient, the industry typically builds new transmission lines with higher voltage rather than upgrading the existing infrastructure, which is why multiple transmission lines can be seen next to one another in the countryside. A very basic rendition of the different stages of power systems is displayed in Figure 1-i.
1.1. BASICS OF POWER SYSTEMS
Color Key. Substation
Red: Generation Step Down Subtransmission
Blue: Transmission Transformer Customer
Green: Distribution Transmission lines 26kV and 69kV Black: Customer 765, 500, 345, 230, and 138 kV
Generating Station Primary Customer
13kV and 4kV
Transmission Customer * * Secondary Customer Generating 138kV or 230kV 120V and 240V
Step Up Transformer
Figure 1-1: Power Systems Schematic (Csanyi, 2017)
Distribution Systems Distribution systems include the rest of the components which bring the elec-tricity from the transmission lines to the end user. The bulk power substation receives elecelec-tricity from the transmission system as it lowers the voltage, and transmits the power to the sub-transmission sys-tems, which bring power to the distribution substations (Beaty, 1998). The distribution substations are strategically located closer to residential, commercial, and industrial customers, and step the voltage down to a lower level. From the distribution substation, the electricity goes across the wires of primary feeders until it reaches the distribution transformer, which performs the final voltage transformation down to levels that the consumer will receive. The secondary circuits include the wires that connect the distribution transformer with the end customer, such as the three phase feeder connecting the sub-station to houses. The process described here is typical for residential customers, but some industrial customers may build their own substations so that they can obtain the electricity at a higher voltage thus with less losses, and at a better rate (Beaty, 1998).
There are several different geometries of how distribution systems could be designed. For residential purposes, the distribution system often has a radial, or tree-like, structure, as displayed on the left side of Figure 1-2. While radial structures are not as reliable as a meshed grid geometry, it is of considerably lower cost and typically used in suburban neighborhoods. Meshed grids are used in dense, urban centers, and the wires are often underground, which increase the upfront costs. However, if something goes wrong in between the substation and the first three-phase switch of a meshed grid, it will likely lead to a power outage for all of the customers that are connected to that portion of the distribution circuit (Beaty, 1998).
Overall, electricity distribution systems are very important; almost 90% of power outages in the United States are caused by problems with the distribution system equipment. These issues could be caused
by natural disasters or more commonly: car crashes, trees, animals, or aging infrastructure.
CHAPTER 1. BACKGROUND
Radial N Meshed Network
Figure 1-2: Radial and Meshed Networks
Retailing The fourth and final stage of electricity delivery is electricity retailing, which involves all the front-end interaction with the customers such as billing, customer acquisition, etc. This stage has drastically changed over the past few decades, as described in Section 1.3. While a centralized utility company used to handle the electricity transmission, distribution, and retailing, essentially making up a vertically integrated monopoly, the system has undergone a large transformation. Ideally, the restructured energy industry invites news actors to enter the market and the competition would improve efficiency and encourage innovation in the industry, though this is rarely seen in practice.
1.2
Electricity Regulation
The technical aspects, economic constraints, and regulatory structure are all very important and interre-lated when analyzing power systems. When proposing an alternative way of operating power systems, it is important to understand which regulator has the authority over which respective jurisdiction, and could potentially implement an innovative approach or a new policy.
1.2.1 Electricity Regulators
Energy policies of the United States vary regionally; there are many different regulatory agencies at the national, state, and local levels, which makes it difficult to pass innovative policies that remain consistent with one another. It is important to understand which regulatory bodies have jurisdiction in different regions, and how decision makers collaborate with one another in order to make a sustainable difference in the infrastructure, the market structure, and energy policy. Here, we will mostly focus on the United States, with a few comments on the electricity regulation of other countries.
1.3. RESTRUCTURING OF THE ELECTRICITY INDUSTRY
At the US federal level, the Department of Energy oversees policies, research, and writes legislation on a variety of areas related to energy; from energy conservation policies to energy-related research to the nuclear weapons program. Federal Energy Regulatory Commission (FERC) is the federal agency that regulates electricity transmission and the wholesale electricity markets. FERC's role is more important for interstate commerce and for setting federal regulations regarding wholesale competition. In theory, FERC should be able to help with the improvement of the interstate infrastructure, and monitor the electricity sales in order to prevent predatory pricing and other anti-competitive behavior. Another important role that FERC plays is regulating Power Purchase Agreements (PPA's), which are essentially contracts between an energy producer and buyer. These contracts are increasingly important for the sale of renewable energy such as solar, wind, fuel cells, and other power sources produced by IPPS. At the state level, the Public Utilities Commission (PUC), also known as a utility regulatory commission, is responsible for the regulation of public utilities including water, gas, and electricity. The PUC's duties include regulating and monitoring the service and prices announced by the utilities companies. Some towns or cities have a similar regulatory figure for their own municipality.
Who sets the standards? In addition to the regulatory bodies, the important industry-specific
orga-nizations include the American National Standards Institute (ANSI) and the Institute of Electrical and Electronics Engineers (IEEE).
ANSI is a private non-profit organization that sets US standards such that products of the United
States are compatible with international products. ANSI determines the voluntary consensus standards for most products, processes, and systems across the United States, including electricity and power systems. IEEE is a professional association of experienced and expert electrical engineers across the world. They post publications, give awards and medals, organize conferences, and have technical societies, technical councils and technical committees. One of the organizations within IEEE, the IEEE Standards Association, set global standards for various areas including power systems, information technologies, and microgrids.
1.3
Restructuring of the Electricity Industry
Electricity was typically supplied by a vertically integrated energy company up until the industry was re-structured in the late 2 0th century. The following sections include a description of the electricity industry both before and after their restructuring, and the benefits and disadvantages of both models.
CHAPTER 1. BACKGROUND
1.3.1
Electricity Industry prior to Restructuring
Initially, all four stages of the electricity system were operated by a vertically-integrated utility company. Thus, regulatory agencies had to ensure that the natural monopolies were providing affordable access to these goods. Electric power distributors were considered natural monopolies because it was more cost-effective for a single producer to provide these public goods to the consumers rather than having a competitive market, due to the high startup costs, scale effects, and other barriers for market-entry (Viscusi, 2009). Some utilities were state-owned, while others were owned by investors. If the utilities
company was privately owned, then a third-party regulator had to protect the consumer's welfare, by monitoring product quality and limiting producer profit (Perez-Arriaga, 2016).
There are several benefits and disadvantages associated with regulated electricity markets. For example, delegating the responsibility of building and maintaining the transmission and distribution lines to a single entity is advantageous due to the economies of scale of the infrastructure. Essentially, it does not make sense to have multiple transmission lines delivering electricity to the same neighborhood because it is both economically and technologically inefficient. This scale effect prevents other actors from easily entering the electricity sector. In addition to economic efficiency, there are technical advantages associated with centralized coordination of the system. If there are many energy generators supplying to the grid without coordination, this could lead to congestion along the transmission system, which would place strain on the grid and could ultimately lead to blackouts.
From an economic perspective, the vertically-integrated monopolies could contribute to economic effi-ciency within the four different parts of the electricity sector. In theory, if the generation, transmission, distribution, and retail was done by four separate parties, then the transaction costs to compromise an efficient outcome could be financially expensive and could require a lot of time for negotiations. The obvious fear with a monopoly, even a regulated natural monopoly, is that the single producer can raise prices, especially for such an inelastic good. According to the Federal Power Act of 1935, FERC was responsible for assuring that the price paid by the consumer was fair, and that the natural monopoly is not obtaining an outrageous margin of profits with the sale of a basic necessity.
The regulatory agencies used rate-of-return regulation to limit the profits made by the monopolies.
1.1 was used to implement rate-of-return regulation, where n is the number of services, s represents
the "fair" rate of return, B is the rate base, and the expenses refer to operating costs and other costs subjected to the energy provider (Viscusi, 2009).
piqi = Expenses + sB (1.1)
i=1
In theory, the regulating agency is trying to set the price of electricity to correspond to the price of
1.3. RESTRUCTURING OF THE ELECTRICITY INDUSTRY
electricity if the industry was a fully competitive market. However, this process was subjected to several difficulties, namely asymmetric information for the regulators. There are many unknown variables in this equation; the regulators must estimate the total expenses that are inflicted upon the utilities companies, the quantity of energy used is highly variable, and it is difficult to decide upon a fair amount of profit for the utility company. If the rate of returns is too low, then the utility company would not be able to invest in upgrading the system or address necessary repairs. However, if the 'sB' term of the equation is too high, and the monopolists are obtaining a high rate of return, then they have no incentive to invest in long-term innovation that could lead to efficient solutions of the future. Additionally, each firm producing and delivering energy had a unique production function. Thus, it is nearly impossible for the regulator to determine the correct price to perfectly satisfy Equation 1.1. Overall, the regulation of electricity markets has its economic and technical validity: it makes sense that there is some type of centralization of the US electric grid to promote technical efficiency. There could be strong economic and technical arguments supporting a regulated market, but they make false assumptions such as perfect information.
1.3.2
Electricity Restructuring in Chile
Chile was the first country to completely unbundle electricity generation, transmission, and distribution with the Electricity Act of 1982 (or Ley General de Servicios Electricos, or LGSE), which inspired similar
movements across the world. The LGSE, in addition to its relevant amendments, regulates the rates and terms for electricity distribution(Acunia et al., 2017). The legislation mandates that the distribution companies must secure adequate power supply to all of their customers in a non-discriminatory manner. In order to do so, the distribution companies enter into long-term power purchase agreements, as described in Article 184 of the LGSE. The distribution tariffs consider the nodal price at the point of interconnection, in addition to the distribution aggregated value, which accounts for the "fixed costs per user, average losses of energy and capacity, standard costs of investment, maintenance and operation associated with distribution per unit of power supplied and the unique charge" (Mackenna et al., 2017).
Chile uses a centralized scheduling market based on audited costs, under the responsibility of the independent system operator, also known as a mandatory pool. Instead of using bids, the generators will inform the variable cost and expected availability to the system operator. Then, the system operator, known as the Independent Coordinator of the National Electricity System (CISEN) considers the network restrictions, congestion, variability in demand, hydrology, wind forecasts, and ultimately schedules a dispatch which is optimized to minimize the total operating cost of the system while maintaining the quality of service. The system operator also calculates the locational marginal price, which is used to settle contracts and provide data for future analysis. While there has always been
CHAPTER 1. BACKGROUND
a geographic and temporal component to electricity prices, the integration of variable energy sources and other intermittent energy sources further complicate the variability of energy prices.
There are centralized energy auctions for long-term contracts in order to ensure adequate energy supply, to promote competition in the market, and to reduce the risk associated with price volatility. While the contracts are intended to increase competition across distribution companies, the fact that the tenders are locked in long-term contracts with distribution companies actually "deter competition for a long period, excludes consumer choice and hinders the competition for additional services by retailers" (Faith Birol, 2018). While the distribution sector is intended to be competitive in theory, there are only two main distribution companies who deliver to the majority of the customers in Chile. The purchase of long-term contracts helps these large distribution companies maintain their market power. This impacts the customer directly, since the distribution companies play the role of both the distributor and retailer.
During the time of restructuring, some states and nations completely unbundled the roles of generation, transmission, distribution, and retailing. While the responsibilities of electricity distribution are tech-nically liberated and left to private parties, Chile only has two main electricity distribution companies. One of which, Enel Distribuci6n, also plays a large role in energy generation as well. Theoretically, competition among retailers should lead to more selection and variety in services and tariffs, that the customers could choose from. However, without a certain sense of customer awareness and compre-hension, the competition among retailers would eventually be boiled down to competition between different advertising tactics, as seen with cellular phone providers.
1.3.3 Restructuring of the Electricity Industry in the United States
Under President Jimmy Carter's administration, the National Energy Act was passed in 1978 as a response to the oil crisis of 1973. The act included several important statutes, including the Public Utility Regulatory Policies Act (PURPA), the Energy Tax Act, National Energy Conservation Policy Act, Power Plant and Industrial Fuel Use Act, and Natural Gas Policy Act. PURPA was written with the intention of promoting energy conservation and inviting new energy producers to provide generation. PURPA also allowed an easier way for renewable energy technologies to supply electricity into the electric grid. Another important component of the act was to disassemble the traditional 'rate structures' used
by utilities companies. Essentially, utility commissions were previously using a pricing mechanism
that would decrease the cost of electricity as consumption increased. While this is a strong economic theory, it is counter-intuitive from an environmental perspective, and ultimately increased electricity demand.
More energy producers, IPPs, were welcome to join the electricity sector through the passing of PURPA. One important point, which still holds true today, is that utilities companies are required by law to
1.3. RESTRUCTURING OF THE ELECTRICITY INDUSTRY
purchase energy from IPPs at the market price. Thus, if an IPP produces energy in a more cost-efficient manner, then they can ultimately create a profit under this policy. In addition to this economic impact, PURPA also has technological effects on the grid. Some IPPs generate renewable energy, such as wind or solar energy, which could be quite unpredictable. However, the utility companies must meet the aggregated consumer's demands at every point of time in the day without resulting in a shortage or congestion. Therefore, the system operator must take into account the intermittency associated with the energy supplied by renewable IPPs. PURPA also helped spur an exponential increase in innovation in alternative energy technologies and allowed the industry to challenge the traditional vertically integrated utility company, essentially opening up the barrier to entry for IPPs. With this shift, people began to question whether a natural monopoly was the most technically and economically efficient strategy of the electricity industry.
Between the 1970's and 1990's, a number of industries which had been operated by a natural monopoly went through a series of deregulation and restructuring. Congress passed the Energy Policy Act of 1992
which encouraged energy efficiency, energy conservation of buildings, along with providing subsidies for clean energy. At this time, the end-user could not purchase electricity directly from IPPs, but this act allowed IPPS and utilities to connect alternative generation sources directly into the regional wholesale transmission system. This act helped further invite non-utility energy generators to enter the industry, and it is considered the foundation of electricity restructuring in the United States, by promising mandatory wholesale transmission. In 1995, FERC passed Order Number 888 which promotes wholesale competition through open access, ensures non-discriminatory transmission services by public utilities, and covers how public utilities will recover stranded assets during the restructuring.
In the late 1990's, various regions across the United States created Independent System Operators (ISOs) or Regional Transmission Organization (RTOs) and set up the wholesale electricity markets, day-ahead, ancillary, and capacity markets that we have today. The seven main electricity power markets across the United States include California ISO, Midcontinent ISO, Southwest Power Pool, Electric Reliability Council of Texas, Pennsylvania New Jersey Maryland (PJM), New York ISO, New England ISO. The ISO/RTOs operate the wholesale electricity markets and coordinate electricity transmission across the system. All of the ISO/RTOs are regulated by FERC, due to the interstate commerce, apart from ERCOT, which operates solely in Texas. The power pools have restructured in different ways, while some have completely competitive retail markets (ERCOT), and others retained a model similar to the natural monopoly of the utility.
While the restructuring encourages competition amongst generators, it remains fairly unopposed that the transmission and distribution system should remain regulated and centralized, though it would be helpful to have a policy instrument to incentivize upgrades to aging power systems infrastructure. This transition from vertically-integrated natural monopolies to the fragmentation of the market is known as vertical unbundling. With the increase of distributed generation technologies, this may lead to energy
CHAPTER 1. BACKGROUND
being consumed closer to where it is being produced.
There are several economic benefits of electricity restructuring. Ideally, one additional benefit of deregulated electricity market is having heterogeneous pricing schemes for different consumers. The increased competition among retailers should theoretically drive the price that the customer pays down to the marginal cost of electricity The outcome of this expectation is further discussed in Section
1.4. While the utility companies were not incentivized to improve their efficiency with cost of service
regulation, the increased competition should incentivize the generators to decrease the production cost of electricity generation through learning effects and other operating decisions. In the long run, the competition should lead to more efficient long-term investments, as well (Chris Knittel, n.d.), which will allow the market players to reduce the risk of volatile prices in the short-run. The long-term contracts also reduce the incentive for market players to exercise market power.
If implemented correctly, these claims should lead to an increase in economic welfare for both the
producer and the consumer of the electricity market. This provides an exciting opportunity for retailers to experiment with retail services, design efficient pricing schemes, and strategize in order to meet various consumer demands, and to incorporate technical innovations, such as connected devices. The role and responsibility of regulatory agencies will shift as the markets will inevitably shift, as well. In addition to their initial responsibilities, the regulating agencies are also responsible for making sure that everyone has access to reliable and affordable electricity. Additionally, the regulators must think about price stability through long term contracts. Finally, the regulating agents have allowed the customers the option of selecting a new retailer, rather than being assigned one (Eakin et al., 2002,
70). For context, the practice of forced reassignment was used with telephone companies, and did not
receive positive feedback from the community
However, there are some challenges associated with the electricity restructuring. For example, the information asymmetry between the generator and system operator still exists. If there are enough parties with market power, or if some generators choose to collude, this could still lead to economic inefficiencies. For example, the incumbent electricity providers must reassess the cost of their existing plants and recalculate how much demand they will be supplying with additional players on the market. This may include merges, acquisitions, the creation of new departments in existing companies, and the creation of new firms themselves. One of the largest concerns that arises with these transitions is the problem of "stranded assets." Some utilities were forced to shut down their power plants because they were no longer economically competitive after the restructuring. Thus, this would affect the long-term financing that the utility had planned for, leading to stranded assets, and a loss of social welfare overall.
Other utilities were forced to sell their assets as a result of the change in regulation.
1.4. TARIFF DESIGN
FIgure 2: EconomIc Ineffcicencls Caused by Fbcod Reai Rats
P Dennd,,
Supply
Fixed Rate
Q.Q.
Figure 1-3: Economic Inefficiencies Caused by Fixed Retail Rates (Newell et al., 2009)
1.4
Tariff Design
The debate on electricity tariff design is as old as the industry itself (Greene, 1896). All over the world, electricity tariff design has a number of flaws which lead to a loss of total social welfare for end-consumers. In fact, academics and practitioners have been highlighting poorly designed electricity tariffs and recommending improvements for decades. However, the economic inefficiency due to misleading electricity tariffs are further exacerbated with distributed energy resources such as rooftop solar and electric vehicles.
Most residential customers have faced flat rate electricity pricing for decades, both before and after the restructuring of the electricity markets. Flat rates create economic inefficiencies, such as the over-and under- consumption of electricity during off over-and on peak periods respectively. Figure 1-3 highlights this economic inefficiency, known as the dead-weight loss (Newell et al., 2009). Dynamic pricing is an
alternative that provides many benefits such as sending proper economic signals, decreasing the peak loads of the system, and improving long-term social welfare. The term dynamic pricing categorizes time-of-use pricing, critical peak pricing, peak time rebate, real time pricing (RTP), and several other variations that reach different levels of economic efficiency. Unlike time-of-use (TOU) rates, real-time pricing provides more specific incentives for customers to align their behavior with the marginal cost of electricity This is primarily because TOU rates generalize over predefined blocks of time and the price difference is typically too small to encourage a change in consumer behavior (F.C.Schweppe et al., 1988). Despite this argument, TOU rates are more common for residential, commercial, and industrial customers than other approaches of dynamic pricing in the United States, due to their relative simplicity for consumer interpretability and utility implementation.
CHAPTER 1. BACKGROUND
The issue of inefficient electricity pricing is certainly not a new problem. Prior to electricity market restructuring and before smart electricity meters with two-way 15-minute communications capabilities were used, James Bonbright described the importance of "time of day" and "time of season" energy rates which would eventually be more relevant with increasingly electrified houses (Bonbright, 1961). Even sixty years ago, Bonbright stressed the importance of promoting efficient resource use, interpretability of the tariffs, undue discrimination, and economic inefficiencies and unfairness associated with uniform rates (Bonbright, 1961). Several other economists related similar sentiments regarding the vulnerability of the consumer to the prices set by the utilities, which may be too high or too low to reach economic equilibrium (Kahn, 1988). Alfred Kahn was a strong advocate of peak-load pricing, which would reduce peak load, thus decreasing fixed costs for the system, and improving overall economic welfare in the long term (Joskow and Wolfram, 2012). Looking to global examples, Acton et. al wrote about best practices of time-varying energy charges, which reflect peak-load demand, that were implemented across Europe in the 1970's (Acton et al., 1978).
After the restructuring of the electricity markets, the conversation surrounding tariff design and time varying prices became more relevant and more prominent across the industry. In theory, competition among retailers should have invited more innovative and diverse set of tariffs offered to the customers. Unfortunately, apart from Texas, there has been limited competition among retailers in the United States. Thus, there has been less innovation among tariff design than necessary to keep up with changing market circumstances. For instance, while the fluctuation of wholesale electricity prices increased in recent years, retail prices have been adjusted gradually (Borenstein, 2005). This failure to target economic inefficiencies leads to higher risk of investment inadequacy when the retail rates do not properly reflect the wholesale electricity costs.
Practitioners highlighted the need to move towards more cost reflective electricity tariffs in order to promote economic efficiency, and help reduce greenhouse gas emissions through demand reduction. Proper price signals may save capital costs in the long-run. In particular, flat rate pricing bears the risk of providing worse incentives from a welfare perspective than time-varying pricing as demonstrated in pilots around the world (Faruqui, 2015).
Additionally, due to spatial diversity, there are some retail tariffs that may be more appropriate for certain geographical regions than others. For example, the marginal cost of electricity, consumer preferences, and demand curves vary across each utility's territory. Thus, it may not be appropriate to widely apply one tariff design across a large geographical region. In a similar vein, during the transition to RTP, the heterogeneity across customers can create inefficiencies and hurt the total social welfare. For example, if all of the customers of a community have RTP, then the allocation of costs are efficient. As highlighted by Borenstein, customers are not receiving equitable marginal surplus if some customers of the community have RTP, others have flat rate pricing, and other customers are still in the process of switching (Borenstein and Holland, 2005).
1.4. TARIFF DESIGN
The question of economic efficiency of retail tariffs and sending proper economic signals is often exacerbated with the penetration of increased distributed energy resources. Fundamentally, the act of rate making will have to evolve with increased penetration of DER. For example, the rates were traditionally defined in a two-step process which involved calculating the total revenue that the utility must be reimbursed for its capital costs and services, with an additional "reasonable" rate of returned, followed by another step named rate design, where several parameters such as customer type, voltage level, and more come into play (Faruqui and George, 2006). However, this entire procedure will be disrupted and must be redesigned with additional customer-owned distributed energy resources and independent power producers.
Across the United States, Australia, Canada, and parts of the European Union, net metering is the incumbent policy for end-users who have distributed generation such as rooftop solar. Under net metering, the consumer is charged for the net amount of electricity drawn from the main grid, in kWh, after accounting for any surplus electricity injected back into the grid. While reducing this customer's electricity bill, this also places increased stress on the customers without distributed generation, who will be responsible for paying a larger share of the infrastructure costs. The net metering policies also do not send any signals to the customer based on the time of day to inject surplus energy back into the grid in order to balance the load, or reduce stress during high-peak periods. Finally, traditional business models do not provide an option for the household with distributed generation to sell surplus energy to its neighbors or promote local distribution.
Similarly, customers with electric vehicles can recharge their car with a meter at home, typically with no additional cost or installation (Charging Plug-In Electric Vehicles at Home 2019). Customers
typically use the same electricity tariff to charge their electric vehicle as the one that supplies their electricity for the home. The utility gained from charging one's electric vehicle will be inherently different from the utility gained from other household appliances. Therefore, if the customer with an EV is withdrawing increased load during a peak demand period, and placing more congestion on the system, he is essentially placing more strain on the system. If the utility or distribution operator accrues additional network costs due to the increased load, the existing tariffs would allocate these network costs across all customers of the community, both those with and without EV's, creating a free rider problem.
CHAPTER 1. BACKGROUND
THIS PAGE INTENTIONALLY LEFT BLANK 26
Chapter
2
Role of a Distribution System
Operator
Across the world, power grid infrastructure is aging, electricity demand is growing, and the urgent need to address climate change is motivating an ongoing energy transition (Nguyen et al., 2007). In order to adapt with this industry-wide transition, more innovative ways of operating distribution systems are being explored, such as with an agent that operates similar to an ISO but at a more granular level, known as a distribution system operator, or a DSO (Perez-Arriaga et al., 2016). A distribution system operator is a completely independent entity that could be responsible for optimizing DERs, promoting energy efficiency, demand response, distributed generation, incorporating electric mobility, microgrids, and energy storage. A DSO could be the appropriate agent to manage a traditional distribution system, and they could potentially operatoe similar to an urban microgrid.
The United States Department of Energy has defined a microgrid as a:
"a group of interconnected loads and distributed energy resources within clearly defined electrical bound-aries that acts as a single controllable entity with respect to the grid. A microgrid can connect and disconnect from the grid to enable it to operate in both grid-connected or island-mode" (Ton et al., 2012).
The electricity generation of a microgrid could be supplied by any combination of multiple distributed energy resources, or by a single generator, depending on the location and nearby resources. As shown
by the definition above, there is no predefined combination of Distributed Energy Resources (DER) or
size requirements that a microgrid must meet in order to be qualified as an urban microgrid. However, the IEEE recommends that microgrids have a generating capacity of lo MVA at a maximum. One of the
CHAPTER 2. SHORT
main goals of traditional power systems operators is to balance the total electricity supply and the total electricity demand for its entire system at all times. The role of the distribution system operator is very similar: the DSO is responsible for balancing load and generation, monitoring frequency regulation and voltage control, along with most of the responsibilities of a power system operator, in addition to being responsible for the interface with the appropriate transmission system. There is generally one interconnection between the microgrid and the larger network; therefore the system operator of the transmission level views the microgrid as one individual node.
The microgrid could be connected to the larger electricity grid infrastructure, with or without the ability to go on island mode, or be completely detached from the main grid. The latter makes more sense for communities or commercial/industrial customers that are located in a more isolated location. Here, the main focus is on urban microgrids which are connected to the main infrastructure but may have the option to go on island mode for power quality and resiliency purposes during special circumstances. The term urban microgrid is sometimes referred to as community microgrid. The word urban, does not imply that is must be located in a city, but simply creates a distinction from rural microgrids, which are typically in isolated, underdeveloped locations without access to a grid.
Regardless of whether the community moves forward with a distribution system operator with or with-out an urban microgrid, the community energy provider would require a certain degree of community coordination and formal representation that could be carried out with a business model similar to an electricity cooperative. Electricity cooperatives have proved successful across the Midwest United States, and supply about 11% of the total kilowatt-hours delivered in the United States. These cooper-atives are typically not-for-profit and act in the interest of the community members. However, many of the electric cooperatives are run and led by people on a voluntary basis without sufficient exper-tise in running a successful distribution system for many communities. Electricity cooperatives that would run and operate urban microgrids would most likely have a close relationship with the larger investor-owned utility. Therefore, it would be beneficial if a relationship between the urban microgrid operator and incumbent utility could form a relationship in the early pilot stages, if they are not the same party
The following sections will introduce a number of advantages associated with a separate DSO, provide examples of federal and state research on urban microgrids, and list some of the associated economic challenges facing the implementation of a DSO.
2.1
Advantages of a Distribution System Operator
The legacy electricity infrastructure is quite dated, assumes unidirectional power flow, experiences losses along the transmission and distribution system, and requires upgrades to the infrastructure.
2.1. ADVANTAGES OF A DISTRIBUTION SYSTEM OPERATOR
Instead of replacing the existing infrastructure with the same technology, there are multiple reasons why urban microgrids could prove to be a strong alternative. The advantages of an urban microgrids with a DSO are discussed in this section.
2.1.1
Resiliency
Water, electricity, and gas are often the first resources that must be recovered following a natural disaster, or supplied during dire circumstances. Thus, the distribution of these products must be reliable during times of high demand, unexpected weather circumstances, or product malfunction. For example, after Hurricane Sandy hit Northeast North America in November of 2012, more than 8 million customers
were reported to have a power outage. By January of 2013, there were still thousands of customers without access to gas and electricity due to the storm (Nessen, 2013). After Hurricane Maria hit Puerto Rico in September of 2017, the average Puerto Rican household did not have access to electricity for approximately 85 days (Sweet, 2018). Not only did these power outages cost a lot to repair, but they also infringed a high economic cost to the city's productivity, such as shutting down the New York Stock Exchange for the first time in decades. Between 2003 and 2012, the cost of power outages due
to extreme weather events was in the range of $ 18 -$ 33 Billion USD per year, including the cost
of damaged power systems infrastructure, loss of productivity, and loss of output and wages (Hirscha et al., 2018).
With climate change, natural disasters are expected to become more severe and more frequent (Banwell et al., 2018). Instead of having a reactive approach, of rebuilding the same infrastructure after an extreme event, there must be a proactive approach in planning and rebuilding electricity distribution systems with more innovative and resilient systems.
2.1.2
Encourage the Integration of Distributed Energy Resources
A DSO would encourage and facilitate the increased integration of distributed energy resources across
the system. There exists a lot of literature on the benefits provided by DER, which include the locational value, reliability and electricity services to the grid, economic incentives, employment op-portunities, environmental benefits, and public health benefits (CleanCoalition, 2013; Burger, Jenkins, et al., 2019).
With increased DERs on the system, there is a challenge of operating the system with higher levels of intermittent energy and energy resources that are more difficult to predict. Thus, a distribution system operator could help address this challenge.
CHAPTER 2. SHORT
2.1.3
Reliability
While a power outage for residential customers may simply lead to an inconvenient evening, the cost of non-served energy is higher for customers that have very inelastic demand functions. For example, some commercial & industrial customers, including hospitals, military sites, financial facilities and research centers, have higher interruption costs and startup costs than other residential customers. Thus, these customers may have a higher willingness to pay for electricity service that can provide higher reliability. The Consortium for Electric Reliability Technology Solutions (CERTS), researchers are Lawrence Berkeley National Lab, and other research institutions have been doing rigorous research in designing the software such that a DSO could control distributed generation and ensure system-level reliability, which is one of the main drivers for implementing a DSO (Feng et al., 2018).
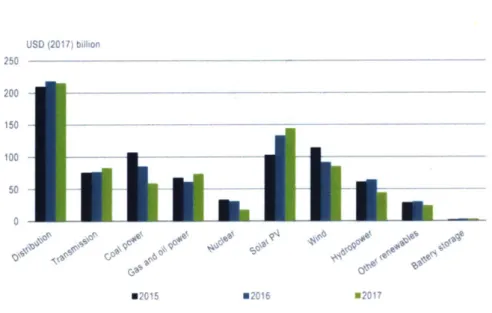
2.1.4 Impact on Infrastructure Costs
While energy discussions generally surround the investment in energy generation, Figure 2-1 displays the sheer magnitude of investments in distribution costs relative to other technologies of the power sector. The United States is currently in the process of replacing its electric grid as opposed to expanding it, as developing countries are in the process of doing. Given the asset lifetime and cost of replacing and upgrading existing transmission and distribution systems, efforts should be made to incorporate recent innovations where appropriate. Urban microgrids, along with other investments in updating distribution systems would have a great impact on infrastructure costs. Distributed energy resources could be strategically placed as to minimize the cost during peak demand periods through peak shaving. In addition to the impact on power systems infrastructure through peak shaving, urban microgrids could also replace or defer centralized network upgrade investments. The impact of distributed generation, and namely urban microgrids, on infrastructure costs varies greatly depending on the location, the respective utility's business model, size of the region, and feeder type. Literature on this topic has quantified the fiscal benefits of distributed generation deferring network upgrade investments range between 265 $/kVA up to 1200 $/kVA (Price, 2005; Gil et al., 2006).
2.1. ADVANTAGES OF A DISTRIBUTION SYSTEM OPERATOR USD (2017) billion 250 200 150 100 50 *2015 *2016
.-Total powrInvestment slumnped by 6% In 2017, mainly due to a 10% fal In spendIng on generatIng
capacity-despite record Investment In solar PV and more spending on electritynetwori.
Notes: Gas and oil-fired generation investment Includes utilIty-scale plants as well as small-scale generating sets and engines. Hydropower includes pumped hydro storage.
Source: Costs for solar PV, wind and hydropower based on IRENA (2018).
Figure 2-1: Global Investments in the Power Sector by Technology (Fatih Birol, 2018)
2.1.5 Decrease Transportation Losses
In the United States and European Union, the total losses along the transmission and distribution systems average roughly 7% of total power flow (Burger, Jenkins, et al., 2019) When current flows through transmission and distribution lines, there is inevitably electrical line losses (Beaty, 1998). The magnitude of the line loss depends on the amount of current flowing across the line and the resistance of the wire. With distributed generation, less electricity is being supplied from a centralized generator. Thus, less current is flowing across the transmission and distribution infrastructure, which therefore results in a reduction of losses. The literature supports that one of the strong benefits of local, distributed energy resources, is that it leads to line loss reduction (Mendez et al., 1993). The reduction of transportation loss varies depending on the system parameters and distance traveled. As expected, the further the centralized generator, the more benefits attributed to local distributed generation (Mendez et al., 1993). Although the amount of line loss reduction varies according to the type of generation, location, and system parameters, literature has calculated that DERs can reduce line losses in the range
of 5 - 20 % (Burger, Jenkins, et al., 2019).