HAL Id: hal-02103998
https://hal.inria.fr/hal-02103998
Submitted on 19 Apr 2019
HAL is a multi-disciplinary open access
archive for the deposit and dissemination of
sci-entific research documents, whether they are
pub-lished or not. The documents may come from
teaching and research institutions in France or
abroad, or from public or private research centers.
L’archive ouverte pluridisciplinaire HAL, est
destinée au dépôt et à la diffusion de documents
scientifiques de niveau recherche, publiés ou non,
émanant des établissements d’enseignement et de
recherche français ou étrangers, des laboratoires
publics ou privés.
Progressive Similarity Search on Time Series Data
Anna Gogolou, Theophanis Tsandilas, Themis Palpanas, Anastasia Bezerianos
To cite this version:
Anna Gogolou, Theophanis Tsandilas, Themis Palpanas, Anastasia Bezerianos. Progressive Similarity
Search on Time Series Data. BigVis 2019 - 2nd International Workshop on Big Data Visual Exploration
and Analytics, Mar 2019, Lisbon, Portugal. �hal-02103998�
Progressive Similarity Search on Time Series Data
[Vision Paper]
Anna Gogolou
1Theophanis Tsandilas
1Themis Palpanas
3Anastasia Bezerianos
2 1Inria, Univ. Paris-Sud & CNRS, and Univ. Paris-Saclay, France
2Univ. Paris-Sud & CNRS, Inria and Univ. Paris-Saclay, France 3Univ. Paris-Descartes, France
1{
first.last
}@inria.fr
2{first.last
}@lri.fr
3{first
}@mi.parisdescartes.fr
ABSTRACT
Time series data are increasing at a dramatic rate, yet their analysis remains highly relevant in a wide range of human ac-tivities. Due to their volume, existing systems dealing with time series data cannot guarantee interactive response times, even for fundamental tasks such as similarity search. There-fore, in this paper, we present our vision to develop analytic approaches that support exploration and decision making by providing progressive results, before the final and exact ones have been computed. We demonstrate through exper-iments that providing first approximate and then progres-sive answers is useful (and necessary) for similarity search queries on very large time series data. Our findings indi-cate that there is a gap between the time the most similar answer is found and the time when the search algorithm terminates, resulting in inflated waiting times without any improvement. We present preliminary ideas on computing probabilistic estimates of the final results that could help users decide when to stop the search process, i.e., decid-ing when improvement in the final answer is unlikely, thus eliminating waiting time. Finally, we discuss two additional challenges: how to compute efficiently these probabilistic estimates, and how to communicate them to users.
Keywords
time series, progressive similarity search; progressive visual analytics; progressive error
1.
INTRODUCTION
Time series (TS) are sequences of value measurements derived from a wide range of human activities or natural processes, such as temperatures per hour, blood oxygen sat-uration per day, or electroencephalography (EEG) signals. These sequences are becoming ubiquitous in modern life, requiring their analysis that is becoming increasingly chal-lenging given their sizes [21].
Time series analysis involves tasks such as pattern match-ing, anomaly detection, frequent pattern identification, and time series clustering or classification. These tasks rely on the notion of time series similarity. The data-mining com-munity has proposed several techniques, including many sim-ilarity measures (or distance measure algorithms), for calcu-lating the distance between two time series [9], as well as
c
2019 Copyright held by the author(s). Published in the Workshop Proceedings of the EDBT/ICDT 2019 Joint Conference (March 26, 2019, Lisbon, Portugal) on CEUR-WS.org.
corresponding indexing techniques and algorithms [10], in order to address the scalability challenges.
Nevertheless, we observe that time series similarity can be domain- and visualization-dependent [2, 14], and in many situations, analysts depend on time-consuming manual anal-ysis processes. For example, neuroscientists manually in-spect the EEG data of their patients, using visual analysis tools, so as to identify patterns of interest [15, 14]. In such cases, it is of paramount importance to have techniques that can operate within interactive response times [20], in order to enable analysts to complete their tasks easily and quickly. In the past years, several visual analysis tools have com-bined visualizations with advanced data management and analytics techniques (e.g., [22, 16]), albeit not targeted to time series similarity search. The focus of the data manage-ment community is on the scalability issues related to the processing and analysis of very large datasets. However, the state-of-the-art methods on time series processing are still far from achieving interactive response times [10].
To allow for interactive response times when users ana-lyze large time series collections, progressive and iterative visual analytics approaches need to be considered [1, 28, 26]. These approaches provide progressive answers to users’ requests [12, 24, 19], sometimes based on algorithms that return quick approximate answers [5, 8, 11]. They support exploration and decision making by providing progressive results, before the final and exact ones have been computed. Most of these techniques consider approximations of aggre-gate queries on relational databases, with the exception of Ciaccia and Patella [5], who examine progressive similar-ity search in multi-dimensional metric spaces. Nevertheless, none of these works has considered time series data, which have the additional characteristic of being high-dimensional, i.e., they are hundreds to thousands of points long.
Contributions. We demonstrate the importance of pro-viding progressive whole-matching [10] similarity search re-sults on large time series collections. Our preliminary ex-periments show that there is a gap between the time the 1st Nearest Neighbour (1-NN) is found and the time when the search algorithm terminates. In other words, users often wait without any improvement in their answers. We fur-ther show that high-quality approximate answers are found very early, e.g., in less than one second, so they can support highly interactive visual analysis tasks. For our benchmarks we utilize the state-of-the-art Adaptive Data Series (ADS) index [29], which is among the fastest techniques for answer-ing k-Nearest Neighbor (k-NN) queries on time series data. Finally, we lay out our vision for developing progressive
ap-proaches for time series exploration and analytics tasks. We discuss promising directions (and our ongoing work) on how to estimate probabilistic distance bounds, and how to help users evaluate the quality of progressive results.
2.
STATE OF THE ART
Similarity Measures: Ding et al. [9] discuss measures that compute similarity between time series. Euclidean Dis-tance (ED) is the most popular, performing point-by-point value comparison between two time series. ED can be com-bined with data normalization, often z-normalization, con-sidering as similar patterns that may vary in amplitude or value offset. Based on their analysis, Ding et al. [9] con-cluded that there is no superior measure. In our work, we focus on ED because [9, 10]: (i) it is an effective and the most commonly used measure in the visualization and data-mining literature; (ii) it leads to efficient solutions for large datasets. (We plan to examine other measures, e.g., Dy-namic Time Warping (DTW) in our future work.)
Similarity Search and Interactive Querying: The data-base community has optimized similarity search methods by using index structures [6, 27, 4, 29], or by directly optimizing sequential scans [23]. Recently, Echihabi et al. [10] compared these methods in terms of efficiency under a single, unified experimental framework. Her work indicates that there is no single best method that outperforms all the rest. In our work, we use the state-of-the-art ADS index [29], which pro-vides high-quality approximate answers almost immediately, and then updates that converge fast to the exact answer.
The human-computer interaction community focuses on the interactive visual exploration and querying of time series. In particular, they are interested in how to form interactive similarity search queries. Existing querying approaches on top of line chart visualizations [25] rely either on the inter-active selection of part of an existing time series [3], or on sketching of patterns to search for [7, 18]. Although we do not study mechanisms of querying in this paper, this line of work is orthogonal to our approach, that considers ap-proximate and progressive results from these queries when interactive search-times are not possible.
Progressive Visual Analytics: A recent research direc-tion studies the problem of how we can support interactive, real-time visual analytics when back-end computations can-not be performed instantaneously, as is the case of our work. To this effect we can use progressive and iterative methods in order to produce fast, but approximate, computational results and visualizations, that are refined over time with increasing precision. Fekete and Primet [11] provide a sum-mary of the features of a progressive system, where here we focus on how to provide: (i) progressively improved answers; (ii) feedback about the state and costs of the computation; and (iii) guarantees of time and error bounds for progressive and final results. We address these features in Sec. 3 and 4. The state-of-the-art in big data exploration takes advan-tage of the power of distributed systems, indexing, and sam-pling methods, and different works utilize one or more of these methods in order to provide progressive results for dif-ferent kinds of queries and data. Moritz et al. [19] used an existing algorithm [8] which exploits sampling methods and approximate query processing for incremental, approximate aggregate database queries. On the other hand, Ciaccia and
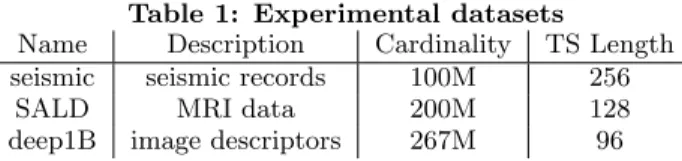
Table 1: Experimental datasets
Name Description Cardinality TS Length seismic seismic records 100M 256
SALD MRI data 200M 128
deep1B image descriptors 267M 96 Patella [5] studied progressive similarity search queries over multi-dimensional spaces and proposed a probabilistic ap-proach for computing the uncertainty of partial similarity search results. However, their approach does not scale to the dataset sizes and number of dimensions that we target. We focus on very large collections (i.e., in the order of TBs) of data series (where the dimensionality of each series is in the order of hundreds to thousands), and how we can develop approaches to support progressive visual analysis in a fully interactive system. Our ultimate goal is to study how users decide to terminate a search that is progressive in nature (and thus reduce waiting times) when they are provided with approximate answers and information about their uncertainty. In particular, we are interested in the quality of approximate answers and how to communicate to users when no improvement is expected to be obtained even if the search algorithm is still running.
3.
PRELIMINARY OBSERVATIONS
We first investigate whether progressive time series simi-larity search in large datasets is feasible. We examine how early we can provide approximate answers, and how good these answers are compared to the exact answers. To this end, we conducted similarity search experiments on three real datasets with the state-of-the-art ADS index [29], which can quickly provide good initial approximate answers and can potentially support progressive similarity search within interactive time thresholds.
Scope. We examine an important class of queries, i.e., ap-proximate and exact 1-NN whole-matching1similarity search queries [10]. (We expect that similar results will hold for k-NN and r-range queries, as well as subsequence match-ing [17]; we will cover these cases in our future work.) Environment. We ran all experiments on a Dell T630 Rack Server with two Intel Xeon E5-2643 v4 3.4Ghz CPUs, 512GB of RAM, and 3.6TB (2 x 1.8TB) HDD in RAID0. The search algorithm is a single-core implementation. Datasets. We tested real datasets that have also been used in previous studies [29, 10]. They include a different number of series and a different number of points (Table 1) but have the same overall dataset size of 100GB. The IRIS seismic dataset2 consists of seismic instrument recordings from sev-eral stations worldwide and contains 100 million series with a length of 256 points. The neuroscience dataset, SALD3,
consists of MRI data and contains 200 million series of 128 points. The image processing dataset, deep1B4, consists of vectors extracted from the last layers of a convolutional neu-ral network and contains 267 million series of size 96.
1Whole-matching refers to the situation where the query and
all candidate answers (series) in the dataset have the same length. 2 http://ds.iris.edu/data/access/ 3http://fcon 1000.projects.nitrc.org/indi/retro/sald.html 4 http://sites.skoltech.ru/compvision/noimi/
Table 2: Summary of experimental results 1-NN Time (sec) Total Time (sec)
Dataset Avg Min Max Avg Min Max
seismic 8.5 0.017 48.5 92 21.3 111 SALD 0.4 0.003 5.2 49 0.24 183 deep1B 0.2 0.001 2.8 76 0.05 189
Queries. All our query workloads include 100 query series. We generated the query datasets by extracting random data series from the raw data. For the deep1B dataset, we used a real query workload that came with the original dataset. Measures. For each similarity query, we recorded its overall completion time, the time for each approximate answer, as well as the time passed until the algorithm finds the exact answer to the query, i.e., the 1-NN. For each approximate and exact answer, we also recorded its Euclidean distance from the query.
Results. Table 2 summarizes our results. For each dataset, we present the average, minimum, and maximum time (in seconds) for the 1-NN query answering algorithm to first en-counter the 1-NN answer (marked as 1-NN Time in Table 2), and the corresponding times for the same algorithm to fin-ish execution (marked as Total Time). We observe that the total time waiting for a single query to finish can be long, e.g., up to three minutes, which is beyond acceptable thresh-olds for interactive data-analysis tasks [11]. Moreover, these delays are orders of magnitude longer than the actual time needed to find the best answer (i.e., first encounter of 1-NN). This means that for most queries, the greatest cost is not locating the 1-NN, but rather confirming that there is no better answer: this is why the query answering algo-rithm finishes execution long after having retrieved the 1-NN value. This finding is consistent with results by Ciaccia and Patella [5], who report that most of the time spent in an exact NN search is ”wasted time, during which no improve-ment is obtained.”
The time needed to locate the 1-NN was especially fast for the SALD and deep1B datasets, where average times were below 1 sec. However, times varied greatly on the seismic dataset, ranging from a few milliseconds to 48.5 sec. For 28% of the queries, the delay was greater than 10 sec, which is considered as a limit for keeping a user’s attention focused on a dialog [11]. We expect that such delays will further increase in larger datasets, and for k-NN exact search. In these cases, providing early approximate answers will also be crucial.
Fig. 1 presents the progressive results for five example queries on the seismic data. For these queries, the time to locate the 1-NN (right-most point in each curve) is relatively long (> 20 sec), while approximate answers (intermediate points in each curve) appear with various frequencies and trends. For example, for queries q1 and q65, results con-verge quickly (in the order of hundreds of milliseconds), and then only slightly improve. For other queries, such as q57, convergence is more progressive. In all cases, however, the first approximate answer (left-most point in each curve) be-comes available very early (< 50 msec), and approximate results very close to the final answer appear within interac-tion times (< 1 sec).
Overall, our results indicate that (i) supporting interactive similarity search over large datasets is feasible, and (ii)
pro-14 15 16 17 18 0.001 0.01 0.1 1 10 100
Time (sec) in log-scale
Euclidean Distance Query average q1 q50 q53 q57 q65
Figure 1: Examples of progressive search for 5 queries (seismic dataset). Right-most points in each curve represent the true 1-NN, while intermediate points represent early approximate results. Thick grey line represents average trend over 100 queries. viding early progressive answers to users could drastically reduce waiting times. The challenge is how to help users to assess the quality of such progressive answers and decide whether to trust these answers, or wait for a better one.
4.
VISION AND CHALLENGES
Previous work on progressive or optimistic visual analyt-ics [12, 24, 19] has focused on the estimation of aggregated functions, such as the mean, over random or carefully se-lected samples of the data. In this case, providing feed-back to users about the uncertainty of progressive results can rely on common statistical methods, e.g., confidence in-tervals [12, 19], or coarse-grain visualizations of aggregated data [13]. However, such approaches cannot apply to our problem. Although k-NN distances converge over time (see Fig. 1), providing bounds for their error requires a different set of statistical tools.
Our vision is to develop methods for progressive time se-ries similarity search, coupled with appropriate bounds on the errors of the intermediate results. We are inspired by the probabilistic approach of Ciaccia and Patella [5] on approx-imate search in multi-dimensional spaces. According to this approach, a dataset is considered as a random sample (or instance) drawn from a large multidimensional space. If the distribution of k-NN distances in this space is known for any given query, then we can derive an estimate of the k-NN dis-tance for the sample. Unfortunately, such distributions are unknown, so the challenge is how to approximate them from a given dataset. Ciaccia and Patella [5] use this framework to determine a mix of probability and distance error bounds as stopping conditions for an approximate similarity search. Our goal instead is to provide live estimates of probabilistic distance bounds to users, and let users decide whether to trust the current results and stop, wait for a better answer, or keep the process executing in the background while they continue with a new search.
We briefly discuss promising measures that could help users evaluate the progressive results of a similarity search. Let T be a space of time series data. For a given query Q ∈ T , we define the cumulative distribution function FQ(x) =
P r{dQ ≤ x} that gives the probability that its distance
From this function, we can derive the probability distribu-tion of k-NN distances dkQ, and from this, we can estimate
the expected k-NN distance and assess the uncertainty of this value. Furthermore, we can infer probabilistic distance bounds for dkQ. For example, we can estimate a distance
bound d+ such that P r{dkQ> d
+} ≤ 5%. The F
Qfunction
can be also used to derive a probability distribution for the number k of answers whose distance is better than a given distance dQ. Investigating additional probabilistic measures
about expected CPU and I/O costs [6] can also be useful. We note that the above directions pose two main chal-lenges. First, the FQ(x) function can be only approximated
based on a specific instance of the space, i.e., the given time series dataset. Ciaccia and Patella [5] argue that for high-dimensional spaces, this function is close to the cumulative distribution function F (x) of all pairwise distances, and can be approximated from a sample of distances that are ran-domly drawn from a given dataset. Unfortunately, reliably estimating the probability distribution of k-NN distances re-quires large samples of distances. Our early tests have shown that their precomputation can be prohibitively expensive for large datasets, such as the ones in Table 1, or larger. We are currently working on solutions that reduce such compu-tation costs.
The second challenge is how to communicate to users probabilistic distance bounds and errors, given that similar-ity distance values do not have a clear interpretation. Our goal is to integrate these distance bounds and errors into the visual representation of a time series, by either using the query itself, or its progressive k-NN answers. Finally, we are interested in experimentally assessing how users per-ceive and understand such probabilistic measures. We plan to measure whether, and to what extent, the visualization of these probabilistic measures helps them to effectively com-plete their visual analysis tasks.
5.
CONCLUSIONS
In this work, we presented preliminary experiments that demonstrate the usefulness (and need) of progressive answer-ing of similarity search queries on very large time series data. Our findings show that the greatest cost is not locating the 1-NN, but rather waiting for the algorithm to confirm that there is no better answer and finish execution.
We argue that providing progressive answers and esti-mates of probabilistic distance bounds to users, and letting them decide when to stop the search process, are important research questions. This would eliminate wasted time and reduce user waiting times, in cases where improvement in the final answer is not possible. We have identified two main challenges: (i) how to compute efficiently distance probabil-ity distributions for large data series collections; and (ii) how to communicate to users probabilistic distance bounds and errors. Given the increasing popularity of data series anal-ysis tasks, these research directions are both relevant and important, offering exciting research opportunities.
6.
REFERENCES
[1] S. K. Badam, N. Elmqvist, and J.-D. Fekete. Steering the craft: Ui elements and visualizations for supporting progressive visual analytics. Comput. Graph. Forum, 36(3), 2017. [2] G. E. Batista, E. J. Keogh, O. M. Tataw, and V. M. Souza.
Cid: An efficient complexity-invariant distance for time series. Data Min. Knowl. Discov., 28(3), 2014.
[3] P. Buono and A. L. Simeone. Interactive shape specification for pattern search in time series. In AVI, 2008.
[4] A. Camerra, T. Palpanas, J. Shieh, and E. Keogh. isax 2.0: Indexing and mining one billion time series. In ICDM, 2010. [5] P. Ciaccia and M. Patella. Pac nearest neighbor queries:
Approximate and controlled search in high-dimensional and metric spaces. In ICDE, 2000.
[6] P. Ciaccia, M. Patella, and P. Zezula. A cost model for similarity queries in metric spaces. In PODS, 1998. [7] M. Correll and M. Gleicher. The semantics of sketch:
Flexibility in visual query systems for time series data. In VAST, 2016.
[8] B. Ding, S. Huang, S. Chaudhuri, K. Chakrabarti, and C. Wang. Sample + seek: Approximating aggregates with distribution precision guarantee. In SIGMOD, 2016. [9] H. Ding, G. Trajcevski, P. Scheuermann, X. Wang, and
E. Keogh. Querying and mining of time series data: Experimental comparison of representations and distance measures. Proc. VLDB Endow., 1(2), 2008.
[10] K. Echihabi, K. Zoumpatianos, T. Palpanas, and
H. Benbrahim. The lernaean hydra of data series similarity search: An experimental evaluation of the state of the art. The VLDB Journal, 12(2), 2018.
[11] J.-D. Fekete and R. Primet. Progressive analytics: A computation paradigm for exploratory data analysis. CoRR, abs/1607.05162, 2016.
[12] D. Fisher, S. M. Drucker, and A. C. K¨onig. Exploratory visualization involving incremental, approximate database queries and uncertainty. IEEE CG&A, 32, 2012.
[13] M. Glueck, A. Khan, and D. J. Wigdor. Dive in!: Enabling progressive loading for real-time navigation of data visualizations. In CHI, 2014.
[14] A. Gogolou, T. Tsandilas, T. Palpanas, and A. Bezerianos. Comparing similarity perception in time series visualizations. IEEE TVCG, 25, 2018.
[15] J. Jing, J. Dauwels, T. Rakthanmanon, E. Keogh, S. Cash, and M. Westover. Rapid annotation of interictal epileptiform discharges via template matching under dynamic time warping. Journal of Neuroscience Methods, 274, 2016.
[16] T. Kraska. Northstar: An interactive data science system. PVLDB, 11(12):2150–2164, 2018.
[17] M. Linardi and T. Palpanas. Scalable, variable-length similarity search in data series: The ULISSE approach. PVLDB, 11(13), 2018.
[18] M. Mannino and A. Abouzied. Expressive time series querying with hand-drawn scale-free sketches. In CHI, 2018.
[19] D. Moritz, D. Fisher, B. Ding, and C. Wang. Trust, but verify: Optimistic visualizations of approximate queries for exploring big data. In CHI, 2017.
[20] J. Nielsen. Response times: The 3 important limits. https://www.nngroup.com/articles/
response-times-3-important-limits/.
[21] T. Palpanas. Data series management: The road to big sequence analytics. SIGMOD Record, 44(2), 2015. [22] S. Rahman, M. Aliakbarpour, H. Kong, E. Blais,
K. Karahalios, A. G. Parameswaran, and R. Rubinfeld. I’ve seen ”enough”: Incrementally improving visualizations to support rapid decision making. PVLDB, 10(11):1262–1273, 2017.
[23] T. Rakthanmanon, B. Campana, A. Mueen, G. Batista, B. Westover, Q. Zhu, J. Zakaria, and E. Keogh. Searching and mining trillions of time series subsequences under dynamic time warping. In KDD, 2012.
[24] C. D. Stolper, A. Perer, and D. Gotz. Progressive visual analytics: User-driven visual exploration of in-progress analytics. IEEE TVCG, 20, 2014.
[25] E. R. Tufte. The Visual Display of Quantitative Information. 1986.
[26] C. Turkay, E. Kaya, S. Balcisoy, and H. Hauser. Designing progressive and interactive analytics processes for high-dimensional data analysis. IEEE TVCG, 23(1), 2017. [27] Y. Wang, P. Wang, J. Pei, W. Wang, and S. Huang. A
data-adaptive and dynamic segmentation index for whole matching on time series. Proc. VLDB Endow., 6(10), 2013. [28] E. Zgraggen, A. Galakatos, A. Crotty, J.-D. Fekete, and
T. Kraska. How progressive visualizations affect exploratory analysis. IEEE TVCG, 23, 2017.
[29] K. Zoumpatianos, S. Idreos, and T. Palpanas. Ads: The adaptive data series index. The VLDB Journal, 25(6), 2016.