HAL Id: hal-01596279
https://hal.archives-ouvertes.fr/hal-01596279
Submitted on 1 Dec 2017HAL is a multi-disciplinary open access archive for the deposit and dissemination of sci-entific research documents, whether they are pub-lished or not. The documents may come from teaching and research institutions in France or abroad, or from public or private research centers.
L’archive ouverte pluridisciplinaire HAL, est destinée au dépôt et à la diffusion de documents scientifiques de niveau recherche, publiés ou non, émanant des établissements d’enseignement et de recherche français ou étrangers, des laboratoires publics ou privés.
Low-molecular-weight color pI markers to monitor
on-line the peptide focusing process in OFFGEL
fractionation
Sylvie Michelland, Sandrine Bourgoin-Voillard, Valérie Cunin, Axel Tollance,
Pascal Bertolino, Karel Slais, Michel Sève
To cite this version:
Sylvie Michelland, Sandrine Bourgoin-Voillard, Valérie Cunin, Axel Tollance, Pascal Bertolino, et al.. Low-molecular-weight color pI markers to monitor on-line the peptide focusing process in OFFGEL fractionation. Electrophoresis, Wiley-VCH Verlag, 2017, 38 (16), pp.2034-2041. �10.1002/elps.201700075�. �hal-01596279�
A low-molecular-weight color pI markers to monitor on-line the peptide focusing process
in OFFGEL fractionation
Sylvie Michelland1, 2, Sandrine Bourgoin-Voillard1, 2, Valérie Cunin1, 2, Axel Tollance1, 2, Pascal
Bertolino3, Karel Slais4, Michel Seve1, 2
1 Univ. Grenoble Alpes, Inserm, U1055, LBFA and BEeSy, PROMETHEE Proteomic Platform,
Grenoble, France
2 CHU de Grenoble, Institut de Biologie et de Pathologie, PROMETHEE Proteomic Platform,
Grenoble, France
3 Univ. Grenoble Alpes, GIPSA-lab, Grenoble, France
4 Institute of Analytical Chemistry of the Academy of Sciences of the Czech Republic, v.v.i.,
Brno, Czech Republic
Corresponding author: Dr Sylvie Michelland
CHU Grenoble alpes, Institut de Biologie et de Pathologie, PROMETHEE Proteomic Platform,
Boulevard de la Chantourne, 38700 La tronche
Email: SMichelland@chu-grenoble.fr
Fax: +33-4-76-76-87-93
Keywords
iTRAQ labeling/ low-molecular-weight color pI markers/ Peptides OFFGEL fractionation
Abstract
High-throughput mass spectrometry-based proteomic analysis requires peptide fractionation to
simplify complex biological samples and increase proteome coverage. OFFGEL fractionation
technology became a common method to separate peptides or proteins using isoelectric focusing
in an immobilized pH gradient. However, the OFFGEL focusing process may be further
optimized and controlled in terms of separation time and pI resolution. Here, we evaluated
OFFGEL technology to separate peptides from different samples in the presence of
low-molecular-weight (LMW) color pI markers to visualize the focusing process. LMW color pI
markers covering a large pH range were added to the peptide mixture before OFFGEL
fractionation using a 24-wells device encompassing the pH range 3-10. We also explored the
impact of LMW color pI markers on peptide fractionation labeled previously for iTRAQ. Then,
fractionated peptides were separated by RP_HPLC prior to MS analysis using
MALDI-TOF/TOF mass spectrometry in MS and MS/MS modes. Here we report the performance of the
peptide focusing process in the presence of LMW color pI markers as on-line trackers during the
OFFGEL process and the possibility to use them as pI controls for peptide focusing. This method
improves the workflow for peptide fractionation in a bottom-up proteomic approach with or
1 Introduction
In bottom-up proteomic approaches, peptide fractionation is an extremely important step which
reduces sample complexity and consequently improves the identification of low-abundance
proteins by mass spectrometry. OFFGEL Electrophoresis (OGE) technology is well known as a
robust tool to separate peptides and improve protein coverage [1]. For this purpose, OGE is an
efficient separation technique for peptides from complex samples and is informative for pI
peptides. Indeed during OGE, peptides migrate through the immobilized pH gradient (IPG) strip
until they reach the pH corresponding to their pI at a specific well. Then, they can be easily
recovered in solution for further analysis. This pI value can be used as supplementary validation
criteria for peptide identification [2]. During the last decade, OGE was successfully combined
with quantitative proteomic approaches such as iTRAQ labeling, to investigate biological
systems [3-5] and particularly in the discovery of biomarkers. It was demonstrated that iTRAQ
labeling was compatible with OGE for plasma and secretome samples [6], complex eukaryotic
samples [7, 8] and plants extracts [9, 10]. Although the iTRAQ tag induces a small pI shift of
labeled peptides compared to unlabeled peptides, this difference was comparable to the error of
pI calculation [6, 11]. However, OGE remains a manual technique with several steps of handling
and lacks standardization and validation criteria to ensure reproducible separations. In this
context, we propose to greatly improve the quality of experiments by using novel stable pI
markers, either alone or mixed, during OGE. These OGE pI markers are compatible with
biological samples, a quantitative approach, OGE and mass spectrometry.
In this work, we investigated OGE fractionation which is visually monitored by a mixture of
low-molecular-weight (LMW) color pI markers. The chosen LMW color pI markers have to
fulfill several criteria such as an appropriate repartition along the strip pH 3-10, a high color
intensity for different pI values, a good focusing, water solubility and stability during the
complex samples in presence of this LMW color pI marker mixture. We also evaluated the
compatibility to use this LMW color pI marker mixture as a control of the focusing for
LC-MS/MS experiments as well as for iTRAQ-LC-LC-MS/MS experiments.
2 Materials and Methods
2.1 LMW color pI markers and protein samples
LM color pI markers were developed, prepared in K. Slais’s laboratory mainly by diazotation
and/or Mannich reaction [14-16] and adapted to OGE fractionation of peptides. The position of
LMW color pI markers on an IPG strip was used to follow the separation process. We used a
mixture of five LMW color pI markers with an appropriate repartition along the strip pH 3-10.
For each LMW color pI markers, a stock solution was prepared at either 2 µg/µ L or 10 µ L/µ L in
ultrapure water (Sigma, Lyon, France). Then, LMW color pI markers were added to the OGE
buffer at the following quantities: 100 µg for dark orange, pI 3.9; yellow, pI 10.1; orange, pI 8.0
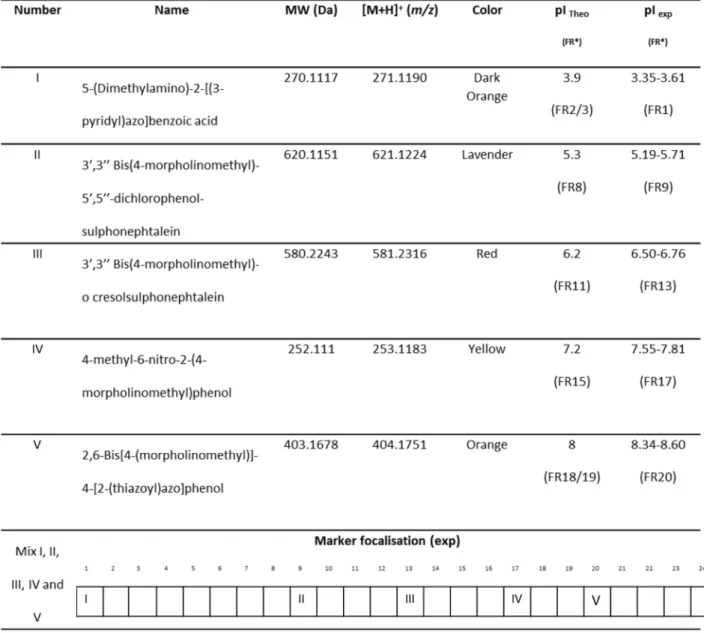
and 50 µg for lavender, pI 5.3; red, pI 6.3. The names of markers are reported in Table 1.
Human Serum Albumin (HSA) from a lyophilized powder, ≥ 96%, was purchased from
Sigma-Aldrich. An MS-compatible Human Proteome (HP) sample was prepared as a whole-cell protein
extract from human K562 cells (Promega, France) according to the supplier data. As the HP
stock solution was solubilized in 6.5M urea/50 mM Tris-HCl (pH 8) at a protein concentration of
10 mg/mL, the solution was diluted 6.5 times in 0.5 M of TEAB (Triethylammonium
Bicarbonate) prior to reduction/ alkylation/digestion processes.
2.2 Protein digestion and iTRAQ labeling
HSA and HP were digested and half of the samples were labeled with iTRAQ reagents in a
4-plex set according to the manufacturer’s instructions (iTRAQ Reagents 4-4-plex Applications kit;
Sciex, Foster City, Cal, U.S.A). Briefly, 400 µg proteins from each sample were reduced in 20
ratio of 1:10 (trypsin: protein) overnight at 37°C. Each peptide solution was labeled at RT for 1 h
with one iTRAQ reagent vial previously reconstituted with 70 µ L of ethanol for 4plex iTRAQ
reagent. Then, the different labeled peptides were pooled in a single vial and dried by
evaporation using a Speed-Vac. Samples digested but not labeled with iTRAQ were directly
dried by evaporation.
2.3 Peptide OFFGEL Isoelectrofocusing
For pI-based peptide separation, we used the 3100 OFFGEL Fractionator with OFFGEL Kit
linear pH 3-10 (Agilent Technologies) in a 24-well setup following the manufacturer’s
instructions. Peptides (from 100 µg to 400 µg) were suspended with 3.6 mL of focusing
OFFGEL buffer in presence or /not of LMW color pI marker mix (120 µL). Then after
rehydration of the 24-cm IPG gel strip (GE Healthcare, Germany), 150 µ L of sample was loaded
in each well. Peptides electrofocusing was performed at 20°C and 50 µA until 50 kVh was
reached. After fractionation was completed, each fraction was transferred in individual tubes.
Then, the wells were washed with 150 µ L of a solution of water/methanol (50:50). After 15 min,
each corresponding peptide fraction was pooled, concentrated by vacuum centrifugation and
desalted using C18 ZipTips (Millipore, MA, USA). The desalted samples were collected, dried
using a vacuum concentrator prior to nanoLC-MS/MS analysis and direct MS/MS analysis.
2.4 Reversed Phase Nanoliquid Chromatography
Fractions obtained by OGE fractionation of HP samples were further fractionated by using an
Ultimate 3000 C18 reversed-phase liquid chromatography system controled by Chromeleon v.
6.80 software (Dionex/ThermoScientific/LC Packings, Amsterdam, The Netherlands) and
coupled to a Probot MALDI spotting device controled by the µCarrier 2.0 software
(Dionex/Thermo Scientific/LC Packings, Amsterdam, The Netherlands). For this step, each OGE
fraction was re-dissolved in 10 µ L buffer A (98% water, 2% ACN and 0.05% TFA). Peptides
using buffer A at a flow rate of 20 µ L/min, and then separated for 60 min by C18-reversed phase
chromatography (Acclaim PepMap100 75 µm id x 15 cm, nano-Viper C18, 3 µm, 100 Å pore
size; Thermo Scientific) with a binary gradient of buffer A (2% ACN and 0.05% TFA) and
buffer B (80% ACN and 0.04% TFA) at a flow rate of 0.3 µ L/min. The nanoLC gradient was set
up as follows: 5-35 min, 8-42% B; 35-40 min, 42-58% B; 40-50 min, 58-90% B and 50-60 min,
100% A. Column effluents were mixed in a ratio of 1:3 with MALDI matrix (HCCA, 2 mg/mL
in 70% ACN and 0.1% TFA). They were collected for 15 s and spotted on an Opti-tof
LC/MALDI Insert 123 x 81 mm plate (Sciex, Les Ulis, France) to produce 200 spots per OGE
fraction.
2.5 MALDI TOF/TOF analysis
MS and MS/MS analyses were performed using the 4800 MALDI-TOF/TOF mass spectrometer
(Sciex, Les Ulis, France) controled by the 4000 Series Explorer software v. 3.5. For LMW color
pI marker analysis, MS spectra were acquired in positive reflector ion mode in an m/z range of
250-650. MS/MS spectra were performed manually for each LMW color pI marker ion by using
collision-induced dissociation (CID) as the activation mode. For peptide analysis, MS spectra
were acquired in positive reflector ion mode in an m/z range of 700-4000. The 30 most intense
ion signals per spot position having an S/N >20 were selected as precursor ions for MS/MS
analysis. MS/MS analyses were performed automatically byusing CID as the activation mode.
2.6 Data analysis
Characterization of LMW color pI markers was performed by analyzing MS and MS/MS spectra
with Data explorer V 4.9 software (Sciex). For protein analysis, MS and MS/MS spectra were
used for identification and relative quantification by using ProteinPilot software v 4.5 with
Mascot or Paragon search engines (Sciex, Les Ulis, France). A bioinformatic analysis was made
for Homo sapiens species in the Uniprot/swissprot database (downloaded January 2016) using
quantitation analysis we added parameters of iTRAQ 4-plex peptide label and processed with a
thorough ID and the False Discovery Rate Analysis (FDR) of 1%. We calculated the pI of
peptides identified with a confidence level higher than 95% in all samples by using the pI/Mw
tool of the ExPASy Proteomic Server (www.expasy.org). It should be noted that deamidation of
N and Q residues induces a non-negligible pI shift since N and Q amino acids become D and E
amino acids, respectively. Thus, using our custom bioinformatics software (“Deamidated”), we
replaced the deamidated N and Q residues with D and E residues respectively, in the sequence of
peptides prior to pI calculation with the pI/Mw tool of the ExPASy Proteomic Server
(www.expasy.org).
3 Results and discussion
OGE electrofocusing is known as a powerful method for an efficient and reproducible separation
of peptides and proteins [2, 17]. Unlike the peptide pI markers used to determine the pI values of
peptides and proteins [18], the mixture of LMW color pI markers that we report may be useful
for direct observation of peptide/ protein focusing without interfering with peptide/ protein
identification. We also explored the impact of LMW color pI markers in the context of a
quantitative proteomic approach based on iTRAQ coupled with OGE peptide fractionation.
3.1 OGE electrofocusing for LMW color pI markers
OGE electrofocusing was performed in 24 wells using a strip covering the pH of 3 to 10 with
3/10 carrier ampholytes in order to create the pH gradient. OGE electrofocusing was processed
with the five individual LMW color pI markers together (mixture) or with each LMW color pI
marker individually. A similar OGE focusing was observed for both conditions. . The list of
LMW color pI markers used in this work and their characteristics were reported in Table 1. For
both individual pI marker focusing and mixture focusing of the five pI markers, each LMW color
pI marker focalized at the same position along the strip for OGE. We observed dark orange
at fraction 13, yellow (marker IV, pI 7.2) at fraction 17 and orange (marker V, pI 8.0) at fraction
20. Expected pH ranges by fraction were calculated according to the IPG strip supplier data and
the OGE fraction size, as reported in our previous study [6]. For all pI markers, we observed a
slight difference between theoretical focusing fractions and experimental focusing fractions. This
difference was ±0.3 pH units for four of the five pI markers, which is a shift that is within the
expected variability of OGE technique [17]. Thus, regarding the focusing observed for the
mixture of the five pI markers and individual pI markers, OGE seems a suitable technique to
focalize efficiently the mixture of LMW color pI markers (I, II, III, IV and V) as well as
individual LMW color pI markers.
3.2. Mass spectrometry characterization of LMW color pI markers
Since the LMW color pI markers used in this study were never characterized by mass
spectrometry, we used a MALDI-TOF/TOF mass spectrometer operating in a positive reflector
mode to establish both MS and MS/MS spectra of each LMW color pI marker (Fig. 1). MS
spectra showed ions of the HCCA matrix (m/z 306.1644, m/z 330.1158, m/z 379.0818, m/z
416.1640 and m/z 463.2935) and the molecular ion [M+H] +of each individual LMW color pI
marker which matches with their expected m/z values. MS spectra of LMW color pI markers I,
II, III, IV and V yielded ions at m/z 271.0900, 623.0820, 581.1700, 253.1193 and 404.1405
corresponding to their molecular ion [M+H]+, respectively. Although several ions was observed in
the MS spectrum of marker V, the base peak was observed at m/z 404.1405 corresponding to the
molecular ion of marker V [Mv+H]+ . All MS/MS spectra showed product ions with high
abundance with a different fingerprint for each LMW color pI marker, which suggested that they
may be useful for marker identification. In addition to precursor ions, a loss of 87 u (C4H9NO)
was observed in MS/MS analysis for markers II, III, IV and V. For pI marker I, we observed a
loss of H2O and a loss of CO2. Moreover, the low m/z range of precursor ions from m/z 250 to
peptides were recorded within the mass range of 700-3500 m/z. Other different LMW color pI
markers were previously used [19] for the successful determination of protein pI values in gel
electrofocusing (not including OGE) and mass spectrometry analysis, especially in complex
mixtures. But,theirmass spectra were more complex in terms of number of peaks and required a
dual mass spectrometry analysis in positive and negative ion modes. In contrast, our color LMW
color pI markers showed specific and simple MS and MS/MS mass spectra, which allowed an
unambiguous characterization in positive mode.
3.3 Identification of HSA with or without low molecular weight color pI marker
The HSA digest was fractionated using OGE in presence or absence of the LMW color pI
marker mixture before C18 desalting and mass spectrometry analysis. In combination with HSA
protein, we observed a good focusing of LMW color pI markers along the strip on fractions 1, 9,
13, 17 and 20 in good agreement with OGE experiments for LMW color pI markers without
protein (part 3.1). Then, HSA peptides were identified in all fractions in presence or absence of
the LMW color pI marker mixture (Fig. 2). Although the number of peptides identified in all 24
fractions was slightly lower (143 vs 153) in the presence of LMW color pI markers, the number
of peptides identified in each fraction remained similar whether or not LMW color pI markers
were used (Fig. 2A). Furthermore, LMW color pI markers had no effect on HSA identification.
HSA was identified in all fractions in both experiments with a coverage from 6% (fractions with
not many peptides e.g. fractions 7, 14) to 22% (fractions 1, 2, 9) (Table S1)). Many unique
peptides were found in one or two fractions in both experiments (Fig. 2B) in the presence or
absence of LMW color pI markers. Thus, this spreading was not due to LMW color pI markers
but mainly to isoelectric focusing of a noncomplex sample (see theoretical OGE isoelectric
focusing of HSA digest in Fig. S1).
In order to ensure that LMW color pI markers did not form any adduct ions that may mask
specific peptide signals and hence interfere in protein identification, we compared MS spectra of
colored fractions (1, 9, 13, 17 and 20) obtained after OGE fractionation of HSA with LMW color
pI markers and MS spectra obtained from the same OGE fractions of HSA in the absence of
LMW color pI markers, (Fig. 3). For markers II, III, IV and V, no additional ions were observed
in the presence of LMW color pI markers compared to the ones observed in the absence of LMW
color pI markers. This suggests that markers II, III, IV and V did not form any adduct in the
mass range of m/z 700-3500. For pI marker I, we observed two supplemental ions in high
abundance at m/z 1629 and 2049 when HSA was in combination with LMW color pI markers.
The ion at m/z 1629 corresponds to a loss of H2O (18 u) from the ion at m/z 1647. Further
investigations could be done to identify exactly the sequence of the ion at m/z 2049 for the case
of in pI marker I. For markers II, III, IV and V, no adducts have been highlighted using our
approach.
3.5 iTRAQ Quantification of HSA with or without LMW color pI markers
In this section, we evaluated the impact of LMW color pI markers on fractionation of HSA
peptides previously labeled with iTRAQ. HSA peptides were unevenly distributed along the strip
in both labeled and unlabeled HSA (Fig. 2A and 2C). Most of labeled HSA peptides were found
in 1, 2 or 3 successive fractions and were less spread compared to HSA that was unlabeled (Fig.
2D). Moreover, we identified a larger number of peptides in labeled HSA (Table S2). This
benefits of iTRAQ labeling on peptide identification is in agreement with other studies [2, 6]. It
was shown that iTRAQ reagents improve MALDI ionization due to the tertiary amines groups of
iTRAQ reporter groups that increase the proton affinity of labeled peptides [20].
On the other part, we observed an expected high resolution focusing of LMW color pI markers
II and IV in fractions 9 and 17, respectively along the strip. We noted a close focusing shift of pI
a shift of pI marker V from fraction 20 to fraction 22. These pI shifts were basic pI shifts in the
OGE fractionation process and could be due to iTRAQ reagents, since no shifts were observed
when HSA was unlabeled and fractionated with LMWcolor pI markers (part 3.3). As previously
reported [6, 9], a non-negligible basic pI shift has already been observed in OGE fractionation of
iTRAQ labeled peptides compared to native peptides using a wide pH-range 3 to 10 while a
slight or negligible pI shift was observed using acidic pH range 3.4 to 4.9 [11].
3.6 iTRAQ quantification of complex sample such as a human proteome (HP)
The bioinformatics iTRAQ-based OFFGEL-nanoLC-MALDI−TOF/TOF analyses for the
complex Human Proteome (HP) sample resulted in the identification and the quantitation of
similar peptide numbers using a local FDR of 1% for experiments with and without LMW color
pI markers. Indeed, we observed a symmetrical shape between both conditions with a slight loss
of peptides in the presence of LMW color pI markers (11350 vs 10878, Fig. 4). With regard to
the LMW color pI marker impact on the pI value, we observed that experimental pI values were
generally similar in both experiments (with or whitout LMW color pI markers) (Fig. S3).
Moreover, the calculation of pI value for each quantified peptide showed that the average
experimental pI value deviated from the theoretical pI value (calculated according to the IPG
strip supplier data) by an average error of +/- 0.5 in both experiments.
Most of the HP unique peptides were found in a single fraction or were distributed in one or two
fractions (Fig. 4B). Those observations are in agreement with the results reported in previous
studies based on the fractionation of complex samples [2, 6, 20]. This was observed in the
presence or absence of LMW color pI markers. It should be also noted that in the presence of
LMW color pI markers, we only observed a slight decrease of identified peptide number.
Regarding LMW color pI marker focusing, LMW color pI marker II, III and IV were found at
fraction 9, 14 and 17 respectively, as reported with single HSA experiment (Fig. 2C). Moreover,
fraction. On the other hand, LMW color pI markers I and V were found in two successive
fractions with one fraction shift compared to the HSA experiment. The most rational explanation
for this observation is that the fractionation time of 40 h for the HP experiment to reach 50 kVh
for the global voltage accumulation was greater than the 10 h for the HSA experiment.These
results suggested that the compromise between OGE focusing efficiency and OGE focusing time
may be optimized by stopping OGE of the HP sample when the LMW color pI markers reach
their specific OGE fraction. Indeed, the OGE process requires a long time to complete the
fractionation (i.e. usually a few days) especially in the presence of a high concentration of
salts [1]. Displaying LMW color pI markers could be a way to decrease OGE separation time by
stopping OGE when LMW color pI markers are focused at their specific OGE fraction. We
could also use LMW color pI markers at lower concentrations to have the color pI markers in a
single OGE fraction. Otherwise, although analysis of nanoHPLC chromatograms of HP peptides
in colored OGE fractions led us to identify peaks with a high UV signal corresponding to LMW
color pI markers from 20 min retention time (Fig. S2), LMW color pI markers have no impact on
column and precolumn pressures during nanoHPLC separation, either for identification or
quantification of the peptides.
4 Concluding remarks
OGE is a suitable technique to focus a mixture of LMW color pI markers (I to V) as well as
individual LMW color pI markers. OGE used in presence of a mixture of LMW color pI markers
enables coverage of the entire pH scale between 3 and 10, so is very useful to follow
peptidefocusing. Moreover, this approach is compatible with both identification and iTRAQ
quantification of proteins in complex samples. Therefore, the use of the five LMW color pI
markers enables control of the OGE focusing of peptides in real time within a large pH range
from 3 to 10. Furthermore, pI marker electrofocusing may help to collect specific fractions at
5 References
[1] Moreda-Piñeiro, A., García-Otero, N., Bermejo-Barrera, P. Anal. Chim. Acta., 2014, 836, 1–
17.
[2] Hörth, P., Miller, C. A., Preckel, T., Wenz, C. Mol. Cell. Proteomics, 2006, 5, 1968–1974.
[3] Ross, P.L., Huang, Y.L.N., Marchese, J.N., Williamson, B., Parker, K., Hattan, S.,
Khainosski, N., Pillai, S., Dey, S., Daniels, S., Purkayastha, S., Juhasz, P., Martin, S.,
Bartlet-Jones, M., He, F., Jacobson, A., Pappin, D. J. Mol. Cell. Proteomics. 2004, 3, 1154–1169.
[4] Bakalarski, C.E., Kirkpatrick, D.S. Mol. Cell. Proteomics. 2016, 15, 1489–1497.
[5] Rauniyar, N., Yates, J.R. J. Proteome Res. 2014, 13, 5293–309.
[6] Chenau, J., Michelland, S., Sidibe, J., Seve, M. Proteome Sci. 2008, 6, 9.
[7] Besson, D., Pavageau, A. H, Valo, I., Bourreau, A., Belanger, A., Eymerit-Morin, C.,
Mouliere, A., Chassevent, A., Boisdron-Celle, M., Morel, A., Solassol, J., Campone, M.,
Gamelin, E., Barre, B., Coqueret, O., Guette, C. Mol. Cell. Proteomics. 2011, 10, M111
009712.
[8] Lukic, N., Visentin, R., Delhaye, M., Frossard, J. L., Lescuyer, P., Dumonceau, J.M., Farina,
A. BBA-Proteins Proteom. 2014, 1844, 1026–1033.
[9] Abdallah, C., Sergeant, K., Guillier, C., Dumas-Gaudot, E., Leclercq, C. C., Renaut, J.
Proteome Sci. 2012, 10, 37.
[10] Fukao, Y., Kobayashi, M., Zargar, S.M., Kurata, R., Fukui, R., Mori, I.C., Ogata, Y.
Proteomes. 2016, 4, 1.
[12] Stastná, M., Trávnícek, M., Slais, K. Electrophoresis. 2005, 26, 53–59.
[13] Duša, F., Šlais, K. Electrophoresis. 2013, 34, 1519–1525.
[14] Slais, K., Friedl, Z. J. Chromatogr. A. 1995, 695, 113-122.
[15] Slais, K., Friedl, Z. J. Chromatogr. A. 1994, 661, 249–256.
[16] Štastná, M., Šlais, K. Anal. Bioanal. Chem. 2005, 382, 65–72.
[17] Michel, P.E., Reymond, F., Arnaud, I.L., Josserand, J., Girault, H.H., Rossier, J.S.
Electrophoresis. 2003, 24, 3–11.
[18] Shimura, K., Zhi, W., Matsumoto, H., Kasai, K. Anal. Chem. 2000, 72, 4747–4757.
[19] Mazanec, K., Slais, K., Chmelík, J. J. Mass. Spectrom. 2006, 41, 1570–1577.
[20] Ernoult, E., Gamelin, E., Guette, C. Proteome Sci. 2008, 6, 27.
Figures Captions
Figure 1. MS (A) and MS/MS (B) spectra of individual LMW color pI markers obtained with
HCCA as matrix after OFFGEL electrophoresis. I, II, III, IV and V are the pI marker’s number.
*ions from matrix HCCA.
Figure 2. Analysis of HSA digest (A) Total number of peptides identified per fraction in HSA
sample digest in the presence or absence of LMW color pI markers (143 and 153 respectively),
(B) Fractionwise distribution of identified peptides in HSA sample digest, (C) Total number of
peptides identified per fraction in HSA sample digest labeled with iTRAQ in the presence or
absence of LMW color pI marker mix, (D) Fractionwise distribution of identified peptides in
Figure 3. MS spectra of HSA digest with (at right) and without (at left) LMW color pI marker
mix for OGE fraction showing marker focusing.
Figure 4. Human Proteome digest study (A) Total number of peptides identified and quantified
per fraction in HP sample digest in the presence or absence of LMW color pI marker mix. Also
reported are the number of individual visible LMW color pI markers. (B) Fractionwise
distribution of identified and quantified peptides.
Figure S1. In silico repartition of all peptides identified for HSA protein.
Figure S2. NanoHPLC chromatograms of HP labeled with iTRAQ with or without mix of dyes.
Figure S3. Average experimental pI values for all peptides identified by fraction. HP iTRAQ
spiked without (A) and with (B) LMW color pI markers. Error bars indicate the standard
deviation of each fraction’s experimental pI. The middle line is the average of theoretical pI
values. The solid lines are based on the theoretical pI values calculated for the IPG strips (pH
Table 1. LMW color pI markers used for peptides OGE electrofocusing.
*conditions: 26h/50kVH, 24-cm IPG gel strip linear pH 3-10