HAL Id: insu-01044656
https://hal-insu.archives-ouvertes.fr/insu-01044656
Submitted on 1 Sep 2014
HAL is a multi-disciplinary open access
archive for the deposit and dissemination of
sci-entific research documents, whether they are
pub-lished or not. The documents may come from
teaching and research institutions in France or
abroad, or from public or private research centers.
L’archive ouverte pluridisciplinaire HAL, est
destinée au dépôt et à la diffusion de documents
scientifiques de niveau recherche, publiés ou non,
émanant des établissements d’enseignement et de
recherche français ou étrangers, des laboratoires
publics ou privés.
headwater catchment as revealed by carbon isotope
fluctuation during storm events
Thibault Lambert, Anne-Catherine Pierson-Wickmann, Gérard Gruau, Anne
Jaffrézic, Patrice Petitjean, Jean-Noel Thibault, Laurent Jeanneau
To cite this version:
Thibault Lambert, Anne-Catherine Pierson-Wickmann, Gérard Gruau, Anne Jaffrézic, Patrice
Petit-jean, et al.. DOC sources and DOC transport pathways in a small headwater catchment as revealed by
carbon isotope fluctuation during storm events. Biogeosciences, European Geosciences Union, 2014,
11 (11), pp.3043-3056. �10.5194/bg-11-3043-2014�. �insu-01044656�
www.biogeosciences.net/11/3043/2014/ doi:10.5194/bg-11-3043-2014
© Author(s) 2014. CC Attribution 3.0 License.
DOC sources and DOC transport pathways in a small headwater
catchment as revealed by carbon isotope fluctuation during storm
events
T. Lambert1,*, A.-C. Pierson-Wickmann1, G. Gruau1, A. Jaffrezic1,2, P. Petitjean1, J. N. Thibault3, and L. Jeanneau1
1Observatoire des Sciences de l’Univers de Rennes, CNRS, UMR 6118 Géosciences Rennes, Université de Rennes 1,
Campus de Beaulieu, 35042 Rennes Cedex, France
2UMR INRA-Agrocampus Ouest Sol, Agrohydrosystème, Spatialisation, Route de Saint-Brieuc, 35042 Rennes Cedex,
France
3Unité Mixte de Recherche INRA – Agrocampus Ouest PEGASE, Domaine de la Prise, 35590 Saint-Gilles, France *now at: University of Liège, Institut de Physique (B5), 4000 Sart Tilman, Belgium
Correspondence to: T. Lambert (tlambert@ulg.ac.be)
Received: 24 October 2013 – Published in Biogeosciences Discuss.: 20 November 2013 Revised: 9 April 2014 – Accepted: 23 April 2014 – Published: 11 June 2014
Abstract. Monitoring the isotopic composition (δ13CDOC) of
dissolved organic carbon (DOC) during flood events can be helpful for locating DOC sources in catchments and quanti-fying their relative contribution to stream DOC flux. High-resolution (< hourly basis) δ13CDOCdata were obtained
dur-ing six successive storm events occurrdur-ing durdur-ing the high-flow period in a small headwater catchment in western France. Intra-storm δ13CDOC values exhibit a marked
tem-poral variability, with some storms showing large variations (> 2 ‰), and others yielding a very restricted range of val-ues (< 1 ‰). Comparison of these results with previously published data shows that the range of intra-storm δ13CDOC
values closely reflects the temporal and spatial variation in
δ13CDOC observed in the riparian soils of this catchment
during the same period. Using δ13CDOCdata in conjunction
with hydrometric monitoring and an end-member mixing ap-proach (EMMA), we show that (i) > 80 % of the stream DOC flux flows through the most superficial soil horizons of the riparian domain and (ii) the riparian soil DOC flux is com-prised of DOC coming ultimately from both riparian and upland domains. Based on its δ13C fingerprint, we find that the upland DOC contribution decreases from ca. 30 % of the stream DOC flux at the beginning of the high-flow period to < 10 % later in this period. Overall, upland domains con-tribute significantly to stream DOC export, but act as a size-limited reservoir, whereas soils in the wetland domains act as a near-infinite reservoir. Through this study, we show that
δ13CDOCprovides a powerful tool for tracing DOC sources
and DOC transport mechanisms in headwater catchments, having a high-resolution assessment of temporal and spatial variability.
1 Introduction
Despite the significant importance of dissolved organic car-bon (DOC) in aquatic ecosystems, the processes controlling DOC delivery to stream waters at the catchment scale are still poorly understood (van Verseveld et al., 2008; Pacific et al., 2010; Laudon et al., 2011). In headwater catchments, stream DOC is mainly controlled by allochthonous inputs (Aitkenhead et al., 1999; Billett et al., 2006), with most of the export occurring during snowmelt or rainfall-induced storm events (Hinton et al., 1997; Laudon et al., 2004; Inamdar et al., 2006; Dalzell et al., 2007; Raymond and Saiers, 2010). In upland snow-dominated catchments, stream DOC concen-trations are commonly found to peak prior to peak discharge, followed by a rapid decrease in concentrations as snowmelt continues (i.e. Hornberger et al., 1994; Boyer et al., 1997). The resulting hysteresis relationship between stream water discharge and stream DOC concentration has been used to suggest that (i) riparian zones close to the stream network are the dominant DOC sources at the catchment scale and
(ii) the DOC transfer mechanism can be regarded as the flushing of a size-limited DOC pool located in these zones (Boyer et al., 1997; Hornberger et al., 1994). Similar hys-teresis has been observed in streams draining rain-dominated catchments (e.g. Hood et al., 2006; Inamdar and Mitchell, 2006; Inamdar et al., 2006) leading to the emergence of an alternative interpretation whereby the DOC flushing process would also affect upland soils, the latter, rather than the ripar-ian soils, being the host of the size-limited DOC pool causing the observed hysteresis (Sanderman et al., 2009; Pacific et al., 2010). To date, however, little direct evidence has been found for the involvement of such a DOC-limited upland reservoir in the stream DOC budget, and this alternative interpretation thus remains a matter of debate.
One way to resolve this issue would be to make use of an absolute tracer to distinguish between riparian-derived DOC and upland-derived DOC, and to monitor it in stream water, along with stream discharge and groundwater level. Among the different potential tracers, the stable carbon iso-topes (δ13C) appear particularly promising because of the dominance of aerobic conditions in the well-drained soils of upland domains. Indeed the aerobic decomposition of the soil organic matter (SOM) results in an enrichment of the heav-ier isotope (13C) of the remaining SOM as the lighter12C is more often involved in decomposition reactions (e.g. Wynn et al., 2006). By contrast, the dominance of anoxic condi-tions in riparian soils limits the decomposition processes and consequently the enrichment in 13C of the riparian SOM. Therefore, the δ13C values of SOM in wetland soils can be expected to be lower than in upland soils. Considering that changes in the δ13CSOMare generally fully transmitted to soil
DOC (Ziegler and Brisco, 2004; Amiotte-Suchet et al., 2007; Sanderman et al., 2009; Lambert et al., 2011), we can infer that the predicted spatial variation of δ13C values for SOM should also apply to DOC, thus allowing the use of δ13C to distinguish between upland and wetland DOC sources.
However, the use of carbon isotopes for this purpose is fraught with difficulties. First, the δ13CSOM values
gener-ally increase with soil depth (Wynn et al., 2006; Boström et al., 2007; Sanderman et al., 2009; Lambert et al., 2011). Thus, the high δ13C values expected to be characteristic of upland DOC may overlap with that of deep wetland DOC. Second, seasonal changes in DOC sources and DOC produc-tion mechanisms can lead to seasonal changes in the isotopic composition of wetland DOC. For example, the release of microbial DOC may explain the DOC peaks observed in wet-land soils after dry summers (Kalbitz et al., 2000). As soil micro-organisms tend to be 13C-enriched by ca. 2 ‰ com-pared to SOM (Potthoff et al., 2003; Schwartz et al., 2007), such a mechanism could temporarily increase the δ13C of the wetland DOC. Finally, to be able to supply the stream, the upland DOC component must be transported through-out the riparian domains, which occupy the interface between streams and upland zones. Consequently, isotopic mixing be-tween wetland-derived and upland-derived DOC is expected
to occur in riparian zones, thus leading to a possible scram-bling of the isotopic signal.
One way to overcome these different pitfalls is to thor-oughly monitor the spatial and temporal variability of the
δ13CDOCvalues in the wetland domain, along with the
sea-sonal changes in the hydrological status of the soil and water table depth. This approach has been carried out with a one-year hydrochemical monitoring in the wetland zone of the Kervidy-Naizin catchment, a lowland, rain-dominated agri-cultural catchment located in western France (Lambert et al., 2013). The results evidenced a strong vertical and temporal variability of the δ13C values of the soil DOC, which could be used to demonstrate the input in this wetland of an upland DOC component. In the present study, we seek to investigate how the spatial and temporal variability of the δ13CDOC
val-ues observed at the scale of the wetland soil profile is trans-posed to the stream. For this purpose, DOC concentrations and δ13CDOCvalues were monitored in the stream during six
successive storm events occurring over the same hydrolog-ical year covered by our first study (Lambert et al., 2013). In parallel, NO3, SO4and DOC concentrations during storm
events are used to deconvolve the contributing water fluxes by the end-member mixing approach (EMMA). Using this database, we want to address three issues:
1. What constraints can be obtained from the monitoring of δ13C variations during storm events relative to the spatial location of DOC sources and to the nature of DOC transport mechanisms in this catchment?
2. What is the proportion of upland DOC in the stream during storm events, and does this proportion vary in relation to the succession of storm events?
3. Can carbon isotopes be used as a robust and universal tool suitable for locating DOC sources in landscapes, and what are the prerequisites for applying such an ap-proach?
2 Materials and methods
2.1 Pedologic and hydrological context
The Kervidy-Naizin catchment is a 4.9 km2 lowland catch-ment located in central Brittany, north-western France (Fig. 1), which belongs to the French network of long-term Environmental Research Observatories (ORE). Numer-ous hydrological and biogeochemical studies have led to an improved knowledge of water pathways during both ”base-flow” and ”storm-”base-flow” periods (Mérot et al., 1995; Durand and Torres, 1996; Dia et al., 2000; Molénat et al., 2008) and of the processes governing the production and transfer of DOC in this catchment (Morel et al., 2009; Lambert et al., 2011; 2013). The climate is temperate oceanic, with mean annual (1993–2011) precipitation, runoff and temperature of
Outlet Le Toullo N 0 m 500 m Contour interval: 5m FRANCE 100 130 120
gauging and sampling staion Mercy wetland stream Soil de p th (cm) 0 -20 -40 Zero-tension lysimeters Organo-mineral horizon (Ah) Albic horizon (E) Redoxic horizon (Bg)
Kerolland transect
Distance from stream (m)
0 50 100 150 200 250 0 -10 10 20 PK1 PK4 PK2 PK3 Ele vaion from stream leve l (m) network piezometers (a) (b) (c)
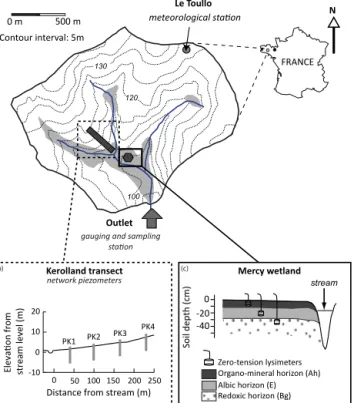
Figure 1. (a) Location and geomorphic map of the Kervidy-Naizin
experimental catchment (Brittany, France). Also shown are the sites where the instruments used in this study are installed. Grey areas located along the stream channel network indicate the maximum extent of the interaction zone between the organo-mineral horizon of the soils and the upper layer of the groundwater. (b) Piezome-ter transect in Kerolland site. (c) Location in the soil profile of the soil water samples previously analysed and discussed by Lambert et al. (2013). Names of soil horizons in bracket refer to the IUSS Working Group WRB (2006) classification.
814 mm, 328 mm and 10.7◦C, respectively. Rainfall events rarely exceed 20 mm per day, and 80 % of rainfall events have an intensity of less than 4 mm per hour. The high-flow pe-riod generally lasts from December to April, with maximum discharges (1000–1200 L s−1) occurring during February– March. Due to the small volume of water stored in the schist bedrock, the stream usually dries out from the end of August to the beginning of November.
The elevation of the catchment area ranges between 93 and 135 m above sea level, with gentle slope gradients of less than 5 %. The bedrock is made up of fissured and frac-tured Brioverian schists, and is covered by an unconsolidated weathered layer whose thickness ranges from a few metres to 30 m depending on the position in the catchment. The soils at Kervidy-Naizin are silty loams, with depths ranging from 0.5 to 1.5 m, and are classified as Luvisols (IUSS Working Group WRB, 2006). Typically, the soil system can be sub-divided into two domains: (i) an upland domain composed of well-drained soils where the water table remains always a few metres below the soil surface and (ii) a riparian
wet-land domain consisting of highly hydromorphic soils where the water table usually reaches the soil surface during the wet season. The extent of the riparian wetland area is highly variable, ranging from 5 to 20 % of the total catchment sur-face area depending of the hydroclimatic conditions (Crave and Gascuel-Odoux, 1997). Soils in the riparian domain con-sists of an upper 10 cm thick Ah horizon overlying a 20 cm thick E horizon, which itself overlies a > 50 cm thick Bg hori-zon (Curmi et al., 1998). The soil organic carbon (SOC) con-tent exhibit two superimposed spatial gradients, including a strong decrease with depth coupled to a progressive decline with increasing distance to the stream (Morel et al., 2009).
Ninety percent of the catchment area is used for intensive agriculture, mainly pasture, maize and cereals for dairy pro-duction and pig breeding. The downward continuous leakage of excess NO3brought about by agriculture has caused heavy
nitrate pollution in groundwater (up to 80 mg L−1), leading
to high NO3concentrations in stream water during base-flow
periods when groundwater dominates stream flow (Molé-nat et al., 2002, 2008). During high-flow periods, however, stream NO3 concentrations decrease as high-NO3
ground-water flux becomes diluted by lower-NO3soil and rain
wa-ters (e.g. Mérot et al., 1995). This specificity of agricultural catchments regarding stream NO3 dynamics greatly differs
from non-agricultural catchments, typically forested catch-ment. In these relatively pristine catchments, no or very lit-tle NO3 is transferred to groundwater and the soils are the
natural main reservoir of NO3at the catchment scale.
Conse-quently, NO3concentrations in streams draining these
catch-ments are typically low during base flow and increase with increasing discharge (e.g. Peterson et al., 2001; Buffam et al., 2001).
The Kervidy-Naizin catchment displays three hydrologi-cal and hydrochemihydrologi-cal periods during the water year (Molé-nat et al., 2008). First, after the dry summer, the water table starts to rise in the riparian zone but remains deep in the up-land domain (period A). Second, as precipitation increases, the water table rises in the upland domain resulting in the establishment of a hydrological connection between ripar-ian and upland domains and the subsequent increase of up-land groundwater flow towards the riparian zone (period B). Third, in late spring and during summer, upland groundwater flow decreases progressively resulting in a gradual air-drying of wetland soils (period C).
Using DOC, NO3, SO4and also Cl, previous studies
iden-tified four types of water contributing to storm flow in the Kervidy-Naizin catchment, namely, (i) rainwater (Rw), (ii) DOC-rich shallow riparian groundwater (SRGw, between 0 and 30 cm depth), (iii) NO3-rich hillslope groundwater
(HGw, between 0.3 and 6 m) and (iv) NO3-poor deep (> 6 m)
groundwater (DGw), the latter two types being the only water types present during base-flow conditions (Mérot et al., 1995; Durand and Torres, 1996; Molénat et al., 2002; Morel et al., 2009). The difference between NO3-rich shallow
Distance from stream (m) Ele va ion fr om s tr eam le vel ( m) PK 4 PK 3 PK 2 PK 1 δ13C (�) W e tland SOC -60 δ13C (�) 0 -20 -40 Dep th ( cm) W e tland SOC -2 0 2 4 6 8 10 12 14 16 18 20 0 50 100 150 200 250 W e tland SOC Mercy
wetland Upland domain
Period A Period B δ13C (�) -60 0 -20 -40 Dep th ( cm) δ13C (�) -60 0 -20 -40 Dep th ( cm) -60 0 -20 -40 Dep th ( cm) Kerolland transect -4 -3 -2 -1 0 1 -30 -29 -28 -27 -26 δ 1 3C ( ‰ ) 0 9 /0 1 /1 0 1 0 /0 1 /1 0 1 1/ 01 /1 0 1 2/ 01/ 1 0 01/ 01/ 1 1 0 2/ 01/ 1 1 0 3 /0 1 /1 1 0 4 /0 1 /1 1 0 5 /0 1 /1 1 0 6/ 01/ 1 1 0 7 /0 1 /1 1 Bg horizon E horizon Ah horizon
Period A Period B Period C
W ater -t able le vel r el aiv e to gr ound surf ace ( m) PK1 PK3 Temporal variaions in soil
soluions sampled in Mercy wetland soils
(a)
(b)
Downward transfer of 13C-enriched upland DOC during period B
Inputs of 13C-enriched upland DOC in
riparian wetland soils during period B -30 -29 -29 -26 -27 -28 -24 -30 -30 -30 -28 -28 -28 -26 -26 -24 -24
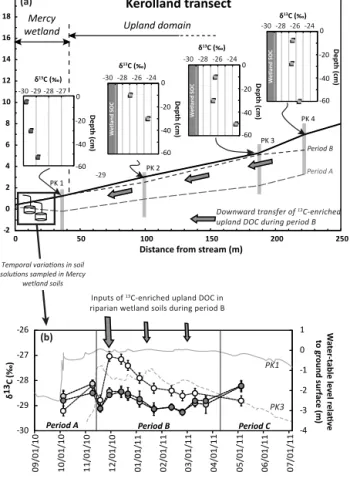
Figure 2. Sketch illustrating: (a) spatial variability of δ13CSOC
val-ues for soil organic carbon from the riparian wetland domain to the hillslope domains of the Kervidy-Naizin catchment. Dashed lines represent the water table level along the upland–wetland transect
during periods A and B. Grey arrows represent the transfer of13
C-enriched DOC from upland soils to wetland soils ; and (b) seasonal
variations of the δ13CDOCvalues in riparian wetland soils in phase
with water table fluctuations. Grey arrows illustrate the mixing be-tween wetland DOC and upland DOC in riparian soils during period B. The gradual decrease in the arrow size symbolises the decrease of upland DOC inputs. Data from Lambert et al. (2011, 2013).
can be explained by the fact that the latter comes from frac-tured unweathered bedrock containing pyrite, thus giving it a distinct low-NO3and high-SO4signature (Dia et al., 2000).
2.2 Previous carbon isotopic data
In addition to a concentration gradient (Morel et al., 2009), the stable carbon isotopic composition of SOC (δ13CSOC)
also exhibits vertical and horizontal gradients (Lambert et al., 2011, 2013; Fig. 2a). Indeed, the δ13CSOC values
de-crease from the uppermost soil layer (0–10 cm) to the deeper horizons (50–60 cm), by 1 ‰ in the wetland zones and by 3.5 ‰ in the upland domain. In addition, the δ13CSOCvalues
are on average lighter in the riparian area (from −29.8 ‰ to
−28.9 ‰) compared to those in the upland domains (from
−27.0 ‰ to −23.5 ‰).
As pointed out in the introduction, the δ13CDOCvalues in
wetland soils display a strong spatial and temporal variation along with seasonal changes in the hydrological regime of the catchment (Lambert et al., 2013; Fig. 2b). During period A, the δ13CDOCvalues shifted to lighter values, ranging from
−29.8 to −28.9 ‰, from the surface to deeper soil horizon in the wetland domain. During the wet period B, a strong iso-topic differentiation of progressively decreasing amplitude was observed between the deeper13C-enriched Bg horizon and the surface Ah and E horizons (Fig. 2b). Finally, dur-ing period C, the δ13CDOCvalues once again became
homo-geneous at the scale of the soil profile. As shown by Lam-bert et al. (2013), the increase and vertical differentiation of
δ13CDOCoccurring during period B in the wetland soils
pro-vides evidence for the input in these soils of an13C-enriched DOC component produced in the upland soils. Moreover, the gradual decreasing amplitude of the δ13CDOCvalues in
ripar-ian soils meanwhile provides evidence for the depletion of the upland DOC pool during the wet period.
2.3 Field instrumentation and water sampling
Water table was continuously monitored (every 15 min) on the Kervidy-Naizin catchment using pressure sensors in piezometers (PK1 to PK4) installed along a 600 m long tran-sect (Kerolland trantran-sect; see Fig. 1). Rainfall amounts were continuously monitored at hourly intervals using a weather station located ca. 1400 m away from the catchment outlet. Stream discharge was recorded every minute with an auto-matic gauge station located at the outlet of the catchment. The beginning and end of a given storm event are determined by an increase and a decrease of the stream discharge of > 1 L s−1in 10 min at the stage recorder, respectively. With this method, the storm flow generally ceases prior to the re-turn to “purely” base-flow conditions regarding DOC con-centrations, implying that some of the data referred to here as base-flow DOC could in fact correspond to storm-flow condi-tions recorded by the receding limb of the storm hydrograph. Six storm events were sampled between 11 November 2010 and 19 February 2011, i.e. during a time interval correspond-ing to the end of hydrological period A and the first half of hydrological period B. Stream water samples were col-lected using a refrigerated (4◦C) automatic sampler (Sigma 900 Max) installed at the outlet of the catchment (Fig. 1). Sampling frequency during the monitored storm events var-ied from one sample every 30 min to one sample every hour, depending on the hydrograph variations. In addition to this high-frequency sampling, a daily sampling of stream wa-ter was performed manually at the outlet of the catchment. All water samples were collected in pre-cleaned acid-washed polyethylene bottles. Daily samples were filtered directly on site whereas storm samples were kept at 4◦C, and then trans-ported in the dark to the laboratory for filtration. Filtration
-4 -3 -2 -1 0 0 10 20 30 40 50 0 200 400 600 800 Ra in fa ll (mm d -1 ) D is ch a rg e (L s -1) Rainfall Discharge
Water table level < 3.5m
Period A Period C 0 9 /0 1 /1 0 1 0 /0 1 /1 0 1 1/ 01 /1 0 1 2/ 01/ 1 0 01/ 01/ 1 1 0 2/ 01/ 1 1 0 3 /0 1 /1 1 0 4 /0 1 /1 1 0 5 /0 1 /1 1 0 6/ 01/ 1 1 0 7 /0 1 /1 1 W at er -t able le vel r ela iv e to gr ound surf ace ( m) Period B 1 3 (a) (b) 2 4 5 6
Wetland water table (PK1) Upland water table (PK4)
Figure 3. (a) Record of hourly discharge and daily rainfall and (b) record of hourly water table levels in the wetland (PK1) and upland (PK4)
domains during the investigated periods. Monitored storm events are indicated by numbers.
was performed successively to a mesh size of < 0.7 µm us-ing GF/F filters, then to < 0.2 µm usus-ing cellulose acetate fil-ters (Millex-GV, EMD Millipore). All filfil-ters (on-site and in-laboratory) were cleaned twice before use: first with 200 mL of deionized water, and then with a few mL of the sample itself.
2.4 Analytical procedures
Dissolved organic carbon concentrations were determined using a Shimadzu TOC-5050A total carbon analyser. Accu-racy of DOC measurements is ±5%, based on repeated mea-surements of standard solutions (K-phthalate). Major anions (Cl−, NO−3 and SO−4)were measured by ion chromatography (Dionex DX-120), with an accuracy of ±2.5 %.
All δ13CDOCvalues were determined at the Stable Isotope
Laboratory of the PEGASE Joint Research Unit of the INRA in Saint-Gilles, France. Up to one litre of raw water was col-lected in-stream and in-soil. After a filtration at 0.2 µm, and an acidification by adding 1 mL of 1N HCl to remove all traces of inorganic carbon, the water samples were frozen and freeze-dried.
The δ13CDOCvalues of the freeze-dried samples were
de-termined using an elemental analyser (EA-CE 1500 NA, Carlo Erba) interfaced with an isotope ratio mass spectrome-ter (IRMS) (VG Isoprime). Tin capsules were used for sam-ple loading. The δ13C values are expressed as the relative de-viations between the measured13C /12C ratio (Rsample)and
the 13C /12C ratio of the international standard Vienna Pee Dee Belemnite (V-PDB) (Rstandard), as follows:
δ13C(‰) = [(Rsample/Rstandard) −1] × 1000, (1)
where R =13C/12C. International standards were also mea-sured: (i) USGS 24 (δ13C = −16.5 ± 0.1 ‰ (n = 36)) and (ii) ANU sucrose (δ13C = −10.5 ± 0.1 ‰ (n = 53)). The accu-racy of measured δ13C values is better than ±0.2 ‰, based on repeated measurements of samples and standards.
2.5 End-member mixing approach (EMMA)
The EMMA is a widely used method in catchment hydrol-ogy studies for estimating the relative proportion of waters of different geographical origins contributing to stream dis-charge (Christophersen et al., 1990; Hinton et al., 1998; Kat-suyama et al., 2001; Inamdar and Mitchell, 2006). This ap-proach is based on a conservative mixing model where the stream water is regarded as a mixture of water components coming from different end-members or water reservoirs with contrasted and stable chemical compositions. This method has been used successfully in the Kervidy-Naizin catchment (Durand and Torres, 1996; Morel et al., 2009). Since four end-members are assumed to contribute to storm flow in this catchment, three chemical tracers are required. As in Morel et al. (2009), we used DOC, SO4and NO3due to the
strong variability of these tracers between the different wa-ter mass bodies. Concentrations used by Morel et al. (2009) were applied for the rainwater and deep groundwater end-members, as their chemical composition is temporally stable in this catchment. For the DOC-rich SRGw and NO3-rich
shallow hillslope groundwater end-members (HGw), tempo-ral variations were taken into account by considering chemi-cal data obtained during the course of the study by Lambert et al. (2013).
0 5 10 15 20 25 0 100 200 300 400 500 600 700 800 DO C (m g L -1 ) Di sc h a rg e (L s -1) 10/01/10 11/01/10 12/01/10 01/01/11 02/01/11 03/01/11 04/01/11 05/01/11 06/01/11
Period A Period B Period C
(a)
(b)
Discharge Daily DOC monitoring Hourly DOC monitoring
1 2 3 4 5 6 0 5 10 15 0 200 400 600 D O C (mg L -1) Discharge (L s-1) 0 5 10 15 0 100 200 D O C (mg L -1) Discharge (L s-1) Event 3 Event 4
Figure 4. (a) Temporal variations in stream discharge and DOC
concentrations at the catchment outlet during the study period and (b) example of DOC concentrations versus discharge showing hysteresis patterns (arrows indicate chronology). Monitored storm events are indicated by numbers in box (a).
3 Results
3.1 Hydrology
The first three months of hydrological year 2010–2011 (i.e. from September to November 2010) were relatively wet, with a total precipitation of 356 mm vs. 251 mm on average for the same period over the last 10 years. The heavy rainfall events at the beginning of October 2010 caused a rise of the water table in the riparian domain (PK1), which marked the beginning of hydrological period A. Hydrological period B started on 13 November 2010, when a 50 mm rainfall event caused a rise of the water table in the upland domains (PK4). This period ended in April 2011, when the water table started to fall in the riparian domain, highlighting the beginning of hydrological period C. As can be seen, the Kervidy-Naizin catchment reacts quickly to rainfall, with most storm water being discharged within a day after the rainfall event. More-over, the water table, both in the riparian and uphill domains, reacts quickly to rainfall in the same way as the stream dis-charge. Note that the hydraulic gradient between riparian and upland domains was constant from storm events no. 2 to 4. The six monitored storm events took place during hydrolog-ical period B, except for storm event no. 1 which occurred
during hydrological period A. Peak discharge values were low to moderate for all events (90 to 170 L s−1), except for
storm event no. 3 whose peak discharge reached 430 L s−1.
3.2 Concentration data
DOC concentrations in the stream varied from 2.5 to 21.5 mg L−1 during the study period (Fig. 4a). Due to a rapid response to rainfall, the maximum DOC concentra-tions are reached during storm events, and mostly captured by hourly sampling, while the minimum DOC concentrations occurred during inter-storm periods, and mostly captured by a daily sampling. During storm events, the DOC concentra-tion vs. discharge relaconcentra-tionships (Fig. 4b) revealed a slight anti-clockwise hysteresis, with higher DOC concentrations on the descending limb of the hydrograph as compared with the ascending limb, a feature that was already apparent in the eight storm events monitored in 2006 by Morel et al. (2009). As pointed out by these authors, this indicates that water en-tering the stream during the early part of the storm has lower DOC concentrations than water entering the stream after the peak discharge.
The in-stream NO3and SO4concentrations were inversely
and positively correlated with discharge, respectively (Sup-plement Fig. S1). In addition, the SO4concentrations
contin-uously decreased from the beginning to the end of the study period during base flow accompanied by a decrease in con-centration variability during storm events. In the case of NO3,
their concentrations were lower during hydrological period A than during hydrological periods B and C. During the lat-ter two periods, NO3concentrations measured after the
ces-sation of rainfall were generally identical to pre-storm con-centrations. The whole data set of stream chemistry during storms can be found in Supplement Table 1.
3.3 Carbon isotopic data
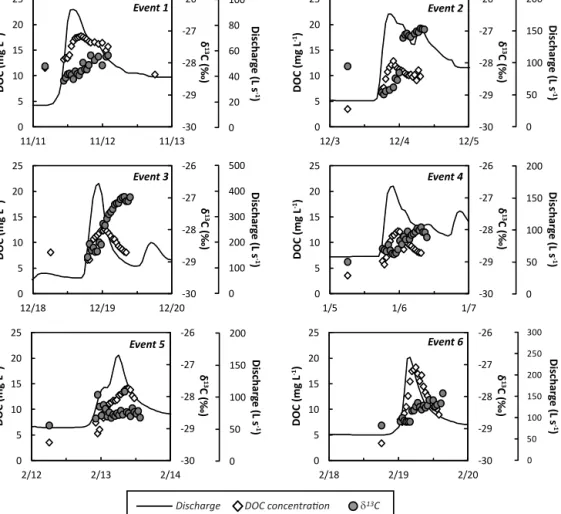
In contrast to DOC concentrations which showed a system-atic increase with increasing discharge, the carbon isotopic composition of DOC displayed a strong intra-storm vari-ability (Fig. 5). More specifically, while δ13CDOC varied by
ca. 2 ‰ (from −29 to −27 ‰) during storm events no. 2 and no. 3, the isotopic variations were reduced to 1 ‰ or less during the four remaining monitored storm events. The min-imum variation was observed during storm event no. 5 with nearly constant intra-storm δ13CDOC. The magnitude of
vari-ations in intra-storm δ13CDOCvalues was not correlated with
the magnitude of variations in intra-storm DOC concentra-tion, or with the magnitude of variations of stream discharge. By contrast, the δ13CDOC values were systematically lower
on the ascending limb of the hydrograph than on the descend-ing limb, the minimum values bedescend-ing observed either durdescend-ing the ascending limb or at the time of maximum discharge.
-30 -29 -28 -27 -26 0 5 10 15 20 25 12/3 12/4 12/5 DOC ( mg L -1) δ 13 C (‰ ) 0 50 100 150 200 Dischar g e (L s -1 ) DOC ( mg L -1) δ 13 C (‰ ) 0 20 40 60 80 100 Dischar g e ( L s -1 ) -30 -29 -28 -27 -26 0 5 10 15 20 25 11/11 11/12 11/13 DOC ( mg L -1) δ 13 C (‰ ) 0 100 200 300 400 500 Dischar g e ( L s -1 ) -30 -29 -28 -27 -26 0 5 10 15 20 25 12/18 12/19 12/20 -30 -29 -28 -27 -26 0 5 10 15 20 25 1/5 1/6 1/7 DOC ( mg L -1) δ 13 C (‰ ) 0 50 100 150 200 Dischar g e (L s -1 ) DOC ( mg L -1) δ 13 C (‰ ) Dischar g e ( L s -1 ) -30 -29 -28 -27 -26 0 5 10 15 20 25 2/12 2/13 2/14 0 50 100 150 200 DOC ( mg L -1) δ 13 C (‰ ) Dischar g e ( L s -1 ) -30 -29 -28 -27 -26 0 5 10 15 20 25 2/18 2/19 2/20 0 50 100 150 200 250 300 Event 1 Event 2 Event 3 Event 4 Event 5 Event 6
Discharge DOC concentraion δ13C
Figure 5. Changes in stream DOC concentrations, stream δ13CDOCvalues and stream discharge during the six investigated storm events.
3.4 Hydrograph separation results
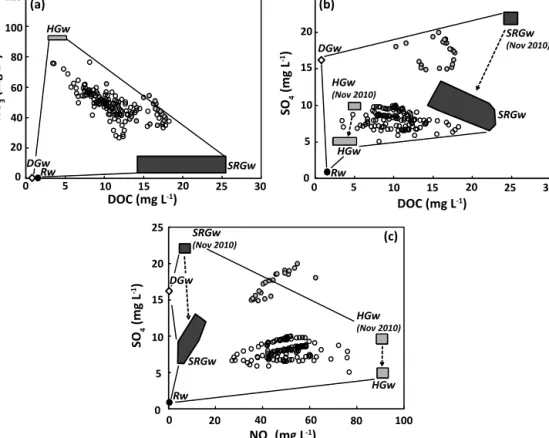
The mixing diagrams (Fig. 6) show that the stream chem-istry was generally within the field defined by the four iden-tified end-members. The results from storm event no. 1 were difficult to interpret, because some of the data points fell outside the end-member field in the SO4vs. NO3diagram.
This feature is most likely due to high-frequency variations of NO3concentration in the riparian wetland soils during the
rewetting period (Molénat et al.,2008), variability which is probably not captured satisfactorily by the bi-weekly sam-pling frequency used in the study of Lambert et al. (2013). Such a hypothesis is consistent with the stream NO3
chemo-graph showing that hydrological period A was characterized by a strong temporal variability of in-stream nitrate concen-trations (Fig. S1).
The results of the hydrograph separations (Fig. 7) show that (i) the contribution of DGw and HGw was fairly constant during the six newly investigated storm events and (ii) the major contribution during the peak discharge came from the SRGw. Furthermore, the proportional contribution of SRGw seems to increase with the magnitude of storm events
4 Discussion
4.1 Linking soil and stream DOC
Data from this study provide evidence for a strong tempo-ral change in the variability of intra-storm δ13CDOC values,
with a much larger range of values for storm events occur-ring soon after the transition between hydrological periods A and B (events no. 2 to 4) than those occurring before (event no. 1) or long after (events no. 5 and 6) (Fig. 5). Figure 8 shows that this temporal variability is similar, both in terms of amplitude and absolute values, to the temporal variation of δ13CDOCtaking place in soils of the Mercy wetland zone
during the same period. This feature is consistent with what is known about storm-flow generation at this site. Previous studies (e.g. Durand and Torres, 1996; Morel et al., 2009; Lambert et al., 2011) have indeed established that storm-flow generation is dominated successively by (i) an overland flow above the saturated wetland soil horizons; (ii) a subsurface flow through the uppermost Ah horizon of wetland soils; (iii) a subsurface return flow from shallow hillslope groundwa-ter flowing through deeper Bg horizon of wetland soils; and
SO 4 (mg L -1) DOC (mg L-1) 0 5 10 15 20 25 30 0 5 10 15 20 25 Rw SRGw (Nov 2010) SRGw HGw HGw (Nov 2010) DGw NO 3 (mg L -1) DOC (mg L-1) 0 5 10 15 20 25 30 0 20 40 60 80 100 120 Rw SRGw DGw HGw NO3 (mg L-1) SO 4 (mg L -1) 0 5 10 15 20 25 0 20 40 60 80 100 Rw SRGw (Nov 2010) SRGw HGw HGw (Nov 2010) DGw (a) (b) (c)
Figure 6. End-member mixing diagrams for the six investigated storm events: (a) NO3versus DOC; (b) SO4versus DOC; (c) SO4versus
NO3. Data from event no. 1 on 11 November 2010 shown as solid grey circles. Rw: rain water; DGw: deep groundwater; SRGw: shallow
riparian groundwater; HGw: hillslope groundwater. Filled areas for SRGw and HGw delimit the changes in concentration observed for these two end-members during the study period. Data source: Lambert et al. (2013); Lambert, unpublished data.
finally (iv) when base-flow conditions are restored, a sub-surface return flow involving a mixture of shallow hillslope groundwater and deep (< 6 m) groundwater flowing through the Bg part of the wetland soil profile. Thus, the fact that the intra-storm isotopic variability mimics the spatial and tempo-ral of δ13C variation in the riparian zones is fully consistent with the storm-flow generation pattern, and confirms the cur-rently accepted view that the source of DOC in stream drain-ing headwater catchments is allochthonous, at least durdrain-ing the wet season (Boyer et al., 1996; Hagedorn et al., 2000; Inamdar et al., 2006; Sanderman et al., 2009).
However, a more detailed comparison between intra-storm δ13CDOCvalues and temporal changes in riparian soil
δ13CDOCvalues reveals some inconsistencies (Figs. 7 and 8).
During storm events no. 2 and no. 3, the δ13CDOC values
observed at peak flow turned out to be significantly lower than the corresponding δ13CDOC values in wetland soil Ah
horizons, even though groundwater from these horizons con-tributed predominantly to stream flow at that time. Similarly, the δ13CDOCvalues at the end of storm events no. 1, 3 and 6
were higher than the δ13CDOCvalues found in groundwater
flowing through the Bg horizon, while this horizon was
cal-culated to provide most of the stream water at that time of the storms.
Most likely, these inconsistencies indicate that the Mercy site is not strictly representative of the riparian zone system over the entire catchment. Indeed, lateral variations in the
δ13CDOCin riparian soil horizons may occur at the catchment
scale. As already mentioned, the increase in δ13CDOCvalues
at the transition between hydrological periods A and B in the Mercy soils is related to the input into these soils of an iso-topically heavier DOC component derived from upland areas (Fig. 2b) caused by the activation of a hydrological connec-tivity developed across the riparian–upland continuum (Lam-bert et al., 2013). In this typical scenario of catchments de-veloped on impermeable basement rocks (McGlynn and Mc-Donnell, 2003; Bishop et al., 2004; Hood et al., 2006; Pacific et al., 2010), spatial variations in the isotopic composition of riparian DOC are to be expected provided that (i) the hydro-logical connectivity across the riparian–upland continuum is spatially discontinuous and (ii) the flux of isotopically heav-ier DOC coming from upland areas varies from one riparian zone to another.
We have no data to assess the variability of the hydro-logical connectivity across the riparian–upland continuum at
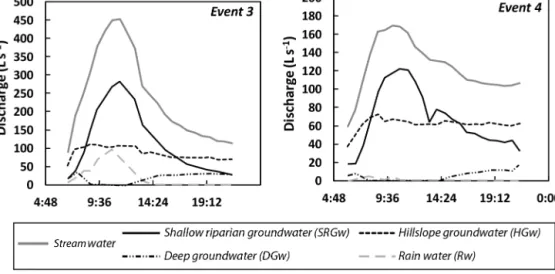
Figure 7. Examples of end-member mixing analysis used to determine the contributing waters during storm events no. 3 and no. 4. -26.5 -27.0 -27.5 -28.5 -29.5 -28.0 -29.0 0 100 200 300 400 500 600 700 800 900 1000 δ 13C DOC ( ‰ ) Dischar g e (L s -1 ) 10/01/10 11/01/10 12/01/10 01/01/11 02/01/11 03/01/11 04/01/11 Period A Period B δ13CDOC of Ah horizon δ13C DOC of Bg horizon Discharge δ13C DOC in stream Event 1 Event 6 Event 5 Event 4 Event 3 Event 2
Figure 8. Comparison between storm-flow DOC isotopic data and
the seasonal DOC isotopic trend observed in riparian soil waters at the Mercy site. Riparian soil water data are from Lambert et al. (2013).
the Kervidy-Naizin catchment scale, nor that of the flux of upland DOC. However, we know that the groundwater rise in upland areas is not uniform over the entire catchment, but more pronounced in its central part at the location of the Mercy site than in areas further upstream with steeper slopes (Molénat et al., 2008). In these latter zones, the up-land groundwater only rarely reach the uppermost organic-rich soil horizons, so we can infer that the ratio of upland to riparian DOC should be lower in these zones as compared to the central flat part of the catchment. This would lead to spatial variations in the isotopic signature of the soil DOC flux entering the stream network during storm events, which could account for the differences between the present storm
δ13CDOCvalues and the Mercy wetland soil data.
Figure 9. (a) The four identified hydrological flow path and DOC
reservoirs at the riparian soil–stream interface and (b) Contribution of each hydrological flow paths to the total storm DOC flux as
calcu-lated using the NO3, DOC, and SO4concentrations and the EMMA
method. Note that DOC in wetland soil horizons is basically a mix-ture of wetland-borne and upland-borne DOC.
4.2 Hydrological flow paths and DOC transport
mechanisms at the soil–stream interface
Using the EMMA results, the relative contribution of each ri-parian soil horizons to the stream DOC flux can be estimated for all six storms events (Fig. 9a), bearing in mind that (i) the riparian soil horizons contain both “autochthonous” riparian DOC and “allochthonous” upland DOC and (ii) the Mercy zone is not strictly representative of the entire riparian do-main across the catchment. Thus we estimated that the SRGw flowing through the uppermost Ah horizons contributed be-tween 78 and 89 % of the total DOC exported by the stream (Fig. 9b). This result is consistent with the 65–90 % contri-bution calculated by Morel et al. (2009) from the EMMA-based decomposition of eight successive storm events in this
same catchment during hydrological year 2005–2006. This suggests that the DOC-rich Ah horizon reservoir in the ripar-ian zone is the main contributor of the total stream DOC flux during storm events.
In addition to EMMA results, an isotopic mixing model using δ13CDOCvalues for storm events can be used to
iden-tify through which of the two wetland soil horizons (shal-low Ah horizon and deep Bg horizon) is the soil DOC usu-ally transferred to the stream, assuming that the Mercy land soils are representative of all the Kervidy-Naizin wet-land soils. In fact, this assumption appears to be valid only for storm no. 4. Indeed, this storm is the only one of the six analysed storms for which the temporal variations in stream
δ13CDOC were bracketed by the δ13CDOC values in the Ah
and Bg soil horizons at the corresponding time (Fig. 8). More specifically, the δ13CDOC values obtained at that time in the
Mercy soils can be taken as possible end-member values for the storm DOC. Assuming δ13CDOC values of −28.7 and
−27.9 ‰ for the DOC circulating in the Ah and Bg soil hori-zons, respectively, we can calculate that the Ah horizon con-tribute 61 % of the total DOC flux. This is significantly lower than the proportion obtained using the EMMA method for this same storm event (85 %). However, the isotopic deposition approach is extremely sensitive to the isotopic com-position chosen for the soil DOC end-members. For exam-ple, increasing the δ13CDOC values of the Ah horizon
end-member by 0.1 ‰ would increase this proportion from 61 % to 70 %, a result which is within the 65–90 % range obtained for the 14 Kervidy-Naizin storm events decomposed so far using the EMMA method (Morel et al., 2009; this study). Thus, the new results confirm the dominant contribution of DOC circulating through the uppermost horizons of the ri-parian soils of this catchment to the DOC fluxes exported during storm events.
4.3 Riparian versus upland origin of stream DOC
As pointed out in the introduction, the transport of DOC from soil to stream is not simply the result of the flush-ing of the DOC generated in the riparian soils, but it can also result from the mobilization of DOC produced in up-land soils (McGlynn and McDonnell, 2003; Sanderman et al. 2009; Pacific et al., 2010). This scenario was first pro-posed for mountainous catchments (McGlynn and McDon-nell, 2003; Bishop et al., 2004; Hood et al., 2006; Sanderman et al., 2009; Pacific et al., 2010) and was recently extended to lowland catchments (Lambert et al., 2013). In this scenario, a hydrological connectivity needs to be developed across the upland–riparian–stream continuum to allow transport of up-land DOC to the stream network. However, no study has so far attempted to quantify the contribution of each source to the total DOC flux exported by streams, or to evaluate how the relative contribution of each source evolves through time. For the first time, the isotopic data obtained at the Kervidy-Naizin catchment provide the possibility of quantifying the
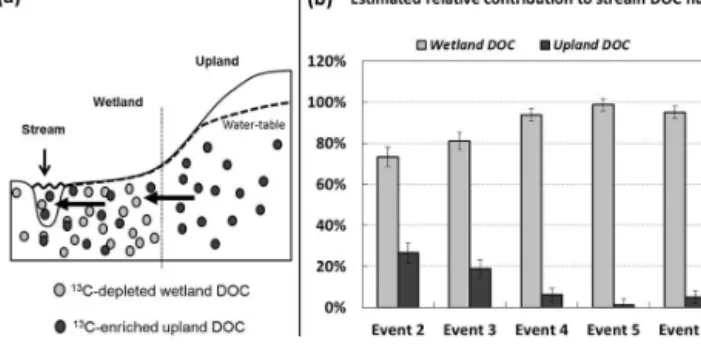
Figure 10. (a) Sketch illustrating the opportunity offered by
sta-ble carbon isotopes to quantify the relative contribution of riparian and upland DOC sources and (b) estimated relative contribution of riparian and upland DOC sources to stream DOC flux.
relative contributions of wetland and upland sources to the stream DOC flux at the catchment scale. This estimation is possible because of the difference in the δ13CDOC
val-ues between these two DOC sources which can be used to estimate their respective contributions by means of a two-end-members isotopic mass-balance mixing (Fig. 10a). For this purpose, the δ13C values for both wetland-derived and upland-derived DOC soils were estimated from those of water-extractable DOC obtained on the uppermost soil hori-zons (0–15 cm) collected along the Kerolland transect (data in Supplement Table 2). The estimated δ13CDOC values of
the wetland- and upland-derived DOC were −28.6 ± 0.1 ‰ (n = 1) and −24.9 ± 0.7 ‰ (n = 3), respectively. The esti-mated δ13CDOC for wetland soils corresponds to the
aver-age value of wetland-borne DOC (Supplement Table 2). Al-though the value of the δ13CDOC of the upland DOC is not
precisely known, the potential internal variability deduced for this reservoir (±0.7 ‰) is much lower than the external variation between the δ13CSOCof wetland and upland soils.
Figure 10b presents the results for storm events no. 2 to 5, while storm event 1 is excluded from the calculation because the deep water table in the upland domain during the rewet-ting period prevented the transfer of any upland DOC to the stream. Due to the uncertainties on the true isotopic compo-sition of upland DOC, our calculations should not be con-sidered as the absolute contribution of upland soils. How-ever, the results clearly show that the contributions of upland-derived DOC reached maxima during storm events no. 2 and 3, estimated at 27 ± 5 % and 19 ± 4 % of the total DOC flux exported at the catchment outlet, respectively, and then de-creased during storm events no. 4 to 6 where it represents less than 10 % of the total DOC flux.
Thus, although it appears that upland DOC significantly contributes to DOC export during storm flows – especially at the beginning of hydrological period B – the riparian wetland zones remain by far the dominant DOC sources. Also, the relative contribution of upland DOC sources was decreasing during hydrological period B (Fig. 10b). Interestingly, this
decrease occurred for storm events whose maximum peak flow values were comparable (e.g. events no. 2, 4 and 5) and while the water table was still high in the upland domains (Fig. 3). This suggests that the DOC reservoir in these do-mains is rapidly depleted or flushed during the course of the rainy season. The seasonal depletion of the upland DOC pool in the Kervidy-Naizin catchment was also apparent in the
δ13CDOCrecords in Mercy soil solutions, with δ13CDOC
val-ues decreasing gradually during period B despite the fact that the hydrological connectivity remained elevated (Fig. 2b; Lambert et al., 2013). A similar behaviour has been observed in a coastal catchment in California (Sanderman et al., 2008, 2009). In this catchment, the seasonal depletion of the hills-lope DOC reservoir is accompanied by a change in the radio-carbon ages of the DOC, indicative of a shift from recent to aged SOM sources. Certain authors consider that this shift to-wards aged SOM sources for DOC, which occurs along with depletion of the hillslope domain, is due to plant productiv-ity that is insufficiently rapid to meet the microbial demand for organic substrate, thus leading to solubilization of older organic matter sources by the microbial community (Zogg et al., 1997; Andrews et al., 2000). In the present case, we do not have the necessary data to elucidate the precise cause of the observed rapid flush of the hillslope DOC component. This evidently remains an open question for future work.
Unlike upland soils, wetland soils in headwater catch-ments developed on impervious bedrock appear to behave as a near-infinite DOC source pool (e.g. Hinton et al., 1998; McGlynn and McDonnell, 2003; Sanderman et al., 2008, 2009; Pacific et al., 2010). For the Kervidy-Naizin catch-ment, the constancy of DOC concentrations in the riparian soils observed by Morel et al. (2009) despite the continuous succession of storm events and the lack of seasonal exhaus-tion of the DOC store built up in the riparian soils during an entire hydrological year reported by Lambert et al. (2013) support this conclusion. This lack of seasonal depletion of the wetland DOC source pool is likely due to the signifi-cantly higher organic carbon contents in the wetland soils, which accumulate significantly more organic matter that the surrounding cultivated uplands. Taken together, all these re-sults suggest that DOC is primarily transport-limited in the Kervidy-Naizin catchment, given the dominant role of shal-low riparian DOC-sources in contributing the major part of the exported DOC.
4.4 Carbon isotopes: a reliable tool for locating DOC
sources and studying DOC transport processes in landscapes?
The results of this study indicate that carbon stable isotopes provide a reliable tool for locating DOC sources in the land-scape and unravelling the DOC transport pathways from the soil profile to the stream. The quantification of DOC trans-port processes was based on the high-resolution monitoring of the temporal and spatial evolution of the δ13CDOCvalues
during storm events and in soil solutions. Importantly, these results could not have been obtained without detailed previ-ous studies involving high-frequency (bi-weekly) and contin-uous monitoring of the isotopic composition of DOC in soil waters, as well as SOM in the soil profile, and continuous monitoring of the water table movements across the stream– wetland–upland continuum (Lambert et al., 2013). All these constraints concerning the type, frequency and location of the data are necessary preconditions for interpreting the iso-topic signal and implementing the carbon isoiso-topic tool for tracing sources and transport mechanisms of DOC in catch-ments.
Two questions arise at this stage: (1) Is it possible that the wetland–upland isotopic continuum observed at Kervidy-Naizin is found in other headwater catchments, thus allowing the implementation of the carbon isotope tool with the same efficiency as in the present case? (2) Why is it so important to determine the ultimate source of DOC in the landscape?
We can probably answer positively to the first question. As mentioned above, the wetland–upland gradient observed at Kervidy-Naizin (δ13CSOCvarying from −29.4 ‰ in the
wet-land to −26.4 ‰ in the upwet-land domains) may be explained by the difference in the conditions of degradation of soil or-ganic matter between the water-saturated anaerobic wetland areas and the better drained, more aerobic upland domains. Insofar as this difference in organic matter degradation con-ditions is expected to occur in all headwater catchments de-veloped on impervious basement rocks, we can reasonably assume that the wetland–upland isotopic gradient will be re-produced elsewhere. Indeed, a comparable isotopic gradient was observed in the Urseren valley in Switzerland, where a variation of 2 ‰ has been reported between wetland organic matter (δ13C = −28.6 ‰) and upland organic matter (δ13C
= −26.6 ‰) (Schaub and Alewell, 2009). This similarity be-tween the two situations is particularly noteworthy, since the physiographic and land-use settings are markedly different, i.e. cultivated lowland soils in the case of Kervidy-Naizin, and forested/pastured alpine soils in the Urseren valley. This comparison clearly indicates that we should consider it fea-sible to transpose the approach developed at Kervidy-Naizin to other catchments with similar final results.
Regarding the importance of identifying DOC sources in landscape, we can see at least two important issues. The first concerns water quality protection and the well-known role of dissolved organic matter as a vector for micropollutants such as metals and pesticides (e.g. Graber et al., 2001; Williams et al., 2006; Grybos et al., 2007; Pédrot et al., 2008; Du Laing et al., 2009; Thevenot et al., 2009; Taghavi et al., 2010). The challenge faced here concerns agricultural catchments, where cultivated fields on the slopes are likely to receive sur-face loading of heavy metals and/or pesticides due to agri-cultural practices. Given the role of dissolved organic matter in controlling the mobility of micropollutants, we anticipate that these substances might become a threat for downstream ecosystems if the upland domains to which they are applied
become hydrologically connected to the stream network. In this way, the micropollutants would form soluble complexes with organic molecules, thus leading to their transfer down-stream. Determining the fraction of stream dissolved organic matter likely to come from upland areas using carbon iso-topes would enable us, in this case, to quantify the potential risk of water contamination by agricultural pollutants.
The second issue concerns testing the hypotheses that have been proposed for the transfer of DOC in the landscape and the factors controlling the pathways and efficiency of this transfer. Based upon catchment-scale topography anal-ysis and measurements of stream and groundwater DOC, it has been suggested that temporal and spatial changes in the hydrological connectivity between upland and wetland do-mains could be one of the dominant factors, and that the maximum DOC export occurs in areas combining both large DOC sources with high stream–wetland–upland hydraulic conductivity (e.g. McGlynn and McDonnell, 2003; Pacific et al., 2010). Carbon isotopes are expected to provide a valu-able tool to test this hypothesis at the catchment and upland scales, since regions characterized by high hydrological con-nectivity between stream, wetland and upland areas should yield DOC with a carbon isotope composition more enriched in13C than regions showing a low hydrological conductivity along this continuum. Carbon isotopes should therefore pro-vide direct epro-vidence of a mixing process than can occur in riparian zones between wetland- and upland-derived DOC, while allowing the unravelling of DOC pathways at the soil– stream interface.
5 Conclusions
Using the carbon isotopic composition of DOC sampled at the outlet of a small lowland agricultural catchment in western France during six successive storm events between November 2010 and February 2011, we were able to recon-struct the transfer pathway of DOC in this catchment and locate the ultimate sources of DOC in the landscape. This was achieved by comparison with previously published iso-topic composition of DOC in the soils of this catchment. We showed that the observed temporal change in the range of intra-storm δ13C values closely reflected the temporal change of δ13C values observed in soils of the riparian zone of the catchment over the same period. Combining the carbon iso-topic data with hydrometric monitoring results and an end-member mixing analysis based on DOC, SO4and NO3
con-centrations, we showed that (i) more than 80 % of the DOC flux transiting through the outlet of the basin has passed via the uppermost organo-mineral soil horizons of the riparian domain and (ii) this flux is composed of DOC derived ulti-mately from both riparian and upland source regions. More-over, we found that the proportion of upland DOC compo-nent decreased rapidly after the rise in water table in the up-land domains of the catchment, corresponding to ca. 20–30 %
of the total DOC flux exported at the outlet of the catchment during storms events taking place soon after the water table rise. This proportion decreased to less than 10 % of the total DOC flux for storm events occurring later on in the hydrolog-ical year. These results indicate that (i) upland domains can be significant contributors of stream DOC flux in headwater catchments and (ii) wetland domains represent more sustain-able sources of DOC than upland regions, the DOC-source pool of the latter being rapidly depleted during the course of the rainy season.
Through this study, we demonstrate that the isotopic com-position of DOC is a powerful tool for tracing DOC sources and DOC transport mechanisms in headwater catchments if measured at high-resolution. At the same time, to produce accurate results, this tool requires an accurate knowledge of the temporal and spatial variability of the isotopic signatures of all potential DOC sources in the catchment. Providing that this condition is met, the carbon isotopic tool can be used to quantify the proportions of DOC coming from different ar-eas of supply. This approach may be of great importance in achieving a better understanding and improved modelling of DOC transport processes in catchments.
The Supplement related to this article is available online at doi:10.5194/bg-11-3043-2014-supplement.
Acknowledgements. We thank Jean-Paul Guillard from Naizin
village for his assistance during stream water sampling. INRA and technical staff at Geosciences Rennes are acknowledged for their assistance during field work and chemical analyses. This work benefited from the data, equipment and knowledge accumulated in the ORE AgrHys observatory. This research was funded by the CNRS, ANDRA, BRGM, CNES, IFREMER, IFSTTAR, IRD, IRSTEA and Météo France joint research programme “EC2CO” (PRODYNAMOS project) and the PSDER project “Climaster”. Thibault Lambert received a grant from the French Ministry of Scientific Research. Michael Carpenter post-edited the English style.
Edited by: T. J. Battin
The publication of this article is financed by CNRS-INSU.
References
Aitkenhead, J. A., Hope, D., and Billett, M. F.: The relationship between dissolved organic carbon in stream water and soil or-ganic carbon pools at different spatial scales, Hydrol. Process., 13, 1289–1302, 1999.
Amiotte-Suchet, P., Linglois, N., Leveque, J., and Andreux, F.: C-13 composition of dissolved organic carbon in upland forested catchments of the Morvan Mountains (France): influence of coniferous and deciduous vegetation, J. Hydrol., 335, 354–363, doi:10.1016/j.jhydrol.2006.12.002, 2007.
Andrews, J. A., Matamala, R., Westover, K. M., and
Schlesinger, W. H.: Temperature effects on the diversity of soil
heterotrophs and the delta C-13 of soil-respired CO2, Soil Biol.
Biochem., 32, 699–706, doi:10.1016/S0038-0717(99)002000, 2000.
Billett, M. F., Deacon, C. M., Palmer, S. M., Dawson, J. J. C., and Hope, D.: Connecting organic carbon in stream water and soils in a peatland catchment, J. Geophys. Res., 111, G02010, doi:10.1029/2005JG000065, 2006.
Bishop, K., Seibert, J., Khöler, S., and Laudon, H.: Resolving the Double Paradox of rapidly mobilized old water with highly vari-able responses in runoff chemistry, Hydrol. Process., 18, 185– 189, doi:10.1002/hyp.5209, 2004.
Boström, B., Comstedt, D., and Ekblad, A.: Isotope fractionation
and13C enrichment in soil profiles during the decomposition of
soil organic matter, Oecologia, 153, 89–98, 2007.
Boyer, E. W., Hornberger, G. M., Bencala, K. E., and McKnight, D. M.: Overview of a simple model describing variation of dis-solved organic carbon in an upland catchment, Ecol. Modell., 86, 183–188, 1996.
Boyer, E. W., Hornberger, G. M., Bencala, K. E., and McK-night, D. M.: Response characteristics of DOC flushing in an alpine catchment, Hydrol. Process., 11, 1635–1647, 1997. Buffam, I., Galloway, J., Blum, L., and McGlathery, K.: A
storm-flow/baseflow comparison of dissolved organic matter concentra-tions and bioavailability in an Appalachian stream, Biogeochem., 53, 269–306, 2001.
Christophersen, N., Neal, C., Hooper, R. P., Vogt, R. D., and Ander-sen, S.: Modeling streamwater chemistry as a mixture of soilwa-ter endmembers – a step towards second-generation acidification models, J. Hydrol., 116, 307–320, 1990.
Crave, A. and Gascuel-Odoux, C.: The influence of topography on time and space distribution of soil surface water content, Hydrol. Process., 11, 203–210, 1997.
Curmi, P., Durand, P., Gascuel-Odoux, C., Mérot, P., Walter, C., and Taha, A.: Hydromorphic soils, hydrology and water quality: spatial distribution and functional modeling at different scales, Nutr. Cycl. Agroecosys., 50, 127–147, 1998.
Dalzell, B., Filley, T. R., and Harbor, J. M.: The role of hydrol-ogy in annual organic loads and terrestrial organic matter ex-port from a midwestern agricultural watershed, Geochim. Cos-mochim. Acta, 71, 1448–1462, doi:10.1016/j.gca.2006.12.009, 2007.
Dia, A., Gruau, G., Olivier-Lauquet, G., Riou, C., Molénat, J. and Curmi, P.: The distribution of rare earth elements in ground-waters: assessing the role of source–rock composition, redox changes and colloidal particles, Geochim. Cosmochim. Acta, 64, 4131–4151, 2000.
Du Laing, G., Rinklebe, J., Vandecasteele, B., Meers, E., and Tack, F. M. G.: Trace metal behaviour in estuarine and riverine floodplain soils and sediments: a review, Sci. Total Environ., 407, 3972–3985, doi:10.1016/j.scitotenv.2008.07.025, 2009. Durand, P. and Torres, J. L.: Solute transfer in agricultural
catch-ments: the interest and limits of mixing models, J. Hydrol., 181, 1–22, 1996.
Graber, E. R., Dror, I., Bercovich, F. C., and Rosner, M.: En-hanced transport of pesticides in a field trial with treated sewage sludge, Chemosphere, 44, 805–811, doi:10.1016/S0045-6535(00)00362-3, 2001.
Grybos, M., Davranche, M., Gruau, G., and Petitjean, P.: Is trace metal release in wetland soils controlled by organic matter mo-bility or Fe-oxyhydroxide reduction?, J. Colloid Interf. Sci., 314, 490–501, 2007.
Hagedorn, F., Schleppi, P., Waldner, P., and Fluhler, H.: Export of dissolved organic carbon and nitrogen from gleysol dominated catchments: the significance of water flow paths, Biogeochem-istry, 50, 137–161, 2000.
Hinton, M. J., Schiff, S. L., and English, M. C.: The significance of storm for the concentration and export of dissolved organic car-bon from two Precambrian Shield catchments, Biogeochemistry, 36, 67–88, 1997.
Hinton, M. J., Schiff, S. L., and English, M. C.: Sources and flow-paths of dissolved organic carbon during storms in two forested watershed of the Precambrian Shield, Biogeochemistry, 41, 175– 197, 1998.
Hood, E., Gooseff, M. N., and Johnson, S. L.: Changes in the char-acter of stream water dissolved organic carbon during flushing in three small watersheds, Oregon, J. Geophys. Res., 111, G01007, doi:10.1029/2005JG000082, 2006.
Hornberger, G. M., Bencala, K. E., and McKnight, D. M.: Hydro-logical controls on dissolved organic carbon during snowmelt in the Snake River near Montezuma, Colorado, Biogeochemistry, 25, 147–165, 1994.
Inamdar, S. P. and Mitchel, M. J.: Hydrologic and topographic con-trols on storm-event exports of dissolved organic carbon (DOC) and nitrate across catchment scales, Water Resour. Res., 42, W03421, doi:10.1029/2005WR004212, 2006.
Inamdar, S. P., O’Leary, N., Mitchell, M. J., and Riley, J. T.: The im-pact of storm events on solute exports from a glaciated forested watershed in western New York, USA, Hydrol. Process., 20, 3423–3439, doi:10.1002/hyp.6141, 2006.
IUSS Working Group WRB: World reference base for soil resources 2006. World Soil Resources Reports No. 103, FAO, Rome, 2006. Kalbitz, K., Solinger, S., Park, J. H., Michalzik, B., and Matzner, E.: Controls on the dynamics dissolved organic matter in soils: a re-view, Soil Sci., 165, 277–304, 2000.
Katsuyama, M., Ohte, N., and Kobashi, S.: A three-component end-member analysis of streamwater hydrochemistry in a small Japanese forested headwater catchment, Hydrol. Process., 15, 249–260, 2001.
Lambert, T., Pierson-Wickmann, A.-C., Gruau, G., Thibault, J. N., and Jaffrezic, A.: Carbon isotopes as tracers of dissolved organic carbon sources and water pathways in headwater catchments, J. Hydrol., 402, 228–238, doi:10.1016/j.jhydrol.2011.03.014, 2011.
Lambert, T., Pierson-Wickmann, A.-C., Gruau, G., Jaffrezic, A., Petitjean, P., Thibault, J.-N., and Jeanneau, L.: Hydrologically
driven seasonal changes in the sources and production mecha-nisms of dissolved organic carbon in a small lowland catchment, Water Resour. Res., 49, 1–12, doi:10.1002/wrcr.20466, 2013. Laudon, H., Köhler, S., and Buffam, I.: Seasonal TOC export from
seven boreal catchments in northern Sweden, Aquat. Sci., 66, 223–230, doi:10.1007/s00027-004-0700-2, 2004.
Laudon, H., Berggren, M., Agren, A., Buffam, I., Bishop, K., Grabs, T., Jansson, M., and Köhler, S.: Patterns and dynamics of dissolved organic carbon (DOC) in boreal streams: the role of processes, connectivity and scaling, Ecosystems, 14, 880–893, doi:10.1007/s10021-011-9452-8, 2011.
McGlynn, B. L. and McDonnell, J. J.: Role of discrete
land-scape units in controlling catchment dissolved organic
carbon dynamics, Water Resour. Res., 39, 1090–2007,
doi:10.1029/2002WR001525, 2003.
Mérot, P., Durand, P., and Morisson, C.: Four-component hydro-graph separation using isotopic and chemical determinations in an agricultural catchment in Western France, Phys. Chem. Earth, 20, 415–425, 1995.
Molénat, J., Gascuel-Odoux, C., Durand, P., Davy, P., and Gruau, G.: Mechanisms of nitrate transfer from soils to stream in an agricultural watershed of French Brittany, Water Air Soil Poll., 133, 161–183, 2002.
Molénat, J., Gascuel-Odoux, C., Ruiz, L., and Gruau, G.: Role of water table dynamics on stream nitrate export and concentration in agricultural headwater catchment (France), J. Hydrol., 348, 363–378, doi:10.1016/j.jhydrol.2007.10.005, 2008.
Morel, B., Durand, P., Jaffezic, A., Gruau, G., and Molénat, J.: Sources of dissolved organic carbon during stormflow in a head-water agricultural catchment, Hydrol. Process., 23, 2888–2901, doi:10.1002/hyp.7379, 2009.
Pacific, V. J., Jensco, K. G., and McGlynn, B. L.: Variable flushing mechanisms and landscape structure control stream DOC export during snowmelt in a set of nested catchments, Biogeochemistry, 99, 193–211, doi:10.1007/s10533-009-9401-1, 2010
Pédrot, M., Dia, A., Davranche, M., Pourret, O., Hénin, O., Le Coz-Bouhnik, M., and Gruau, G.: Trace metal colloidal release in a temperate soil: an experimental kinetic insight, J. Colloid In-terf. Sci., 208, 187–197, 2008.
Peterson, B. J., Wollheim, W. M., Mulholland, P. J., Webster, J. R., Meyer, J. L., Tank, J. L., Martí, E., Bowden, W. B., Valett, H. M., Hershey, A. E., McDowell, W. H., Dodds, W. K., Hamilton, S. K., Gregory, S., and Morrall, D. D.: Control of Nitrogen Export from Watersheds by Headwater Streams, Science, 292, 86–90, 2001.
Potthoff, M., Loftfield, N., Buegger, F., Wick, B., John, B.,
Joer-gensen, R. G., and Flessa, H.: The determination of δ13C in
soil microbial biomass using fumigation-extraction, Soil Biol. Biochem., 35, 947–954, 2003.
Raymond, P. A. and Saiers, J. E.: Event controlled DOC ex-port from forested watersheds, Biogeochemistry, 100, 197–209, doi:10.1007/s10533-010-9416-7, 2010.
Sanderman, J., Baldock, J. A., and Amundson, R.: Dis-solved organic carbon chemistry and dynamics in contrast-ing forest and grassland soils, Biogeochemistry, 89, 181–198, doi:10.1007/s10533-008-9211-x, 2008.
Sanderman, J., Lohse, K. A., Baldock, J. A., and Amundson, R.: Linking soils and streams: sources and chemistry of dissolved organic matter in a small coastal watershed, Water Resour. Res., 45, W03418, doi:10.129/2008WR006977, 2009.
Schaub, M. and Alewell, C.: Stable isotopes as an indicator for soil degradation in an alpine environment (Urseren Val-ley, Switzerland), Rapid Commun. Mass Sp., 23, 1499–1507, doi:10.1002/rcm.4030, 2009.
Schwartz, E., Blazewiccz, S., Doucett, R., Hungate, B. A.,
Hart, S. C., and Djijkstra, P.: Natural abundance δ15N and δ13C
of DNA exctracted from soil, Soil Biol. Biochem., 39, 3101– 3107, 2007.
Taghavi, L., Probst, J.-L., Merlina, G., Marchand, A.-L., Durbe, G., and Probst, A.: Flood event impact on pesticide transfer in a small agricultural catchment (Montousse at Aurade, south west France), Int. J. Environ. An. Ch., 90, 390–405, doi:10.1080/03067310903195045, 2001.
Thevenot, M., Dousset, S., Hertkorn, N., Schmitt-Kopplin, P., and Andreux, F.: Interactions of diuron with dissolved organic matter from organic amendments, Sci. Total Environ., 407, 4297–4302, doi:10.1016/j.scitotenv.2009.04.021, 2009.
van Verseveld, J., McDonnel, J., and Lajtha, K.: A mechanistic as-sessment of nutrient flushing at the catchment scale, J. Hydrol., 358, 268–287, doi:10.1016/j.jhydrol.2008.06.009, 2008. Williams, C. F., Letey, J., and Farmer, W. J.: Estimating the
potential for facilitated transport of napropamide by dis-solved organic matter, Soil Sci. Soc. Am. J., 70, 24–30, doi:10.2136/sssaj2001.0063, 2006.
Wynn, G. J., Harden, J. W., and Fries, T. L.: Stable car-bon isotope depth profiles and soil organic carcar-bon dynam-ics in the lower Mississippi Basin, Geoderma, 131, 89–109, doi:10.1016/j.geoderma.2005.03.005, 2006.
Ziegler, S. E. and Brisco, S.: Relationships between the isotopic composition of dissolved organic carbon and its bioavailability in contrasting Ozark streams, Hydrobiology, 513, 153–169, 2004. Zogg, G. P., Zak, D. R., Ringelberg, D. B., MacDonald, N. W.,
Pre-gitzer, N. W., and White, D. C.: Compositional and functional shifts in microbial communities due to soil warming, Soil Sci. Soc. Am. J., 61, 475–481, 1997.