Printed in Great Britain
Comparison of protein structures determined
by N M R in solution and by X-ray diffraction
in single crystals
MARTIN BILLETER
Institut fiir Molekularbiologie und Biophysik, Eidgenosische Technische Hochschule-Honggerberg CH-8093 Zurich, Switzerland
1. INTRODUCTION 325 2. COMPARISON TOOLS 326
3. DETERMINATION OF PROTEIN STRUCTURES 329
3.1 Determination by NMR in solution 329
3.2 Determination by X-ray diffraction in single crystals 330
4. PROTEINS SELECTED FOR COMPARISON 331 5. INDIVIDUAL COMPARISONS 334
5.1 a-Amylase inhibitor (tendamistat) 334 5.2 Barnase 339
5.3 Calbindin 343
5.4 Chytnotrypsin inhibitor 2 346 5.5 C0IE1 rop protein 348 5.6 Interleukin J/? 350 5.7 Interleukin 8 353 5.8 Metallothionein 357 5.9 434 Repressor(i-6g) 360 5.10 Ribonuclease 362 5.11 Thioredoxin 365
5.12 Trypsin inhibitor (BPTI) 367
6. CONCLUSIONS 369
7. ACKNOWLEDGEMENTS 371 8. REFERENCES 371
APPENDIX: CRYSTALLOGRAPHIC PARAMETERS 377
I . I N T R O D U C T I O N
Following the first determinations of protein structures in the late 1950s and the early 1960s (see for example Kendrew et al. i960; Perutz, 1964), the three-dimensional structures of several hundred proteins have been elucidated by X-ray
diffraction on single crystals. By the end of 1991, approximately 150 entries of proteins with substantially different sequences and a well resolved structure (Hobohm et al. 1992) were deposited in the Protein Data Bank (Bernstein et al. 1977; Abola et al. 1987). In addition, many structures of homologous proteins or of mutants have been described, bringing the total number of entries to about 600. While it was soon accepted that almost all of these structures do indeed give a correct picture of the fold of the active protein in spite of the non-physiological environment of single crystals, it is not clear to what extent structural details are reliably described by these structures. In particular the surface of a protein may be modified due to the dense packing of protein molecules in the crystal lattice. A detailed knowledge of the protein surface is, however, essential for the understanding of the function of the protein.
In the second half of the 1980s, NMR established itself as an alternative method for the determination of protein structures at atomic level, i.e. at a level of structural detail comparable to that of X-ray diffraction studies (in 1984 the structures of two globular proteins were obtained: BUSI (Williamson et al. 1985) and lac repressor headpiece (Zuiderweg et al. 1984; Kaptein et al. 1985)). In the past seven years many structures of proteins have been solved by an ever increasing number of NMR techniques (see Wiithrich, 1986, 1989; Clore & Gronenborn, 1991 a). By the end of 1991, about 40 protein structures determined by NMR were deposited or announced in the Protein Data Bank. The obvious advantage of the NMR technique is that the experiments are performed in solution, which approximates the conditions in which the protein exhibits its physiological activity better than a single crystal. The major disadvantage of NMR is its limitation to rather small proteins, or complexes with proteins, due to the increase in spectral complexity of large proteins.
In the present study, structures obtained by X-ray diffraction and by NMR were compared with the purpose of evaluating (a) the agreement between the two types of structures, (b) differences in the structures resulting from the experimental techniques employed as well as from the different tools used to describe the structures, and (c) differences due to the environment seen by the protein in the two types of experiments. Therefore, this study was restricted to cases where both an NMR and an X-ray structure are available for the same protein (or, in a few cases, where the two proteins differ minimally, e.g. in their oxidation state). In the following chapters, the comparison tools used in this study are described, some characteristic features of the two structure determination methods are highlighted, a set of proteins is selected for comparison, detailed comparisons are given for these, and the general observations from the comparisons are discussed.
2. COMPARISON TOOLS
Solution and crystal structures were compared using both interactive examination of the protein structures on a graphics workstation with the molecular graphics package MidasPlus (Ferrin et al. 1988), and quantitative automatic procedures. The latter consisted of measurements of the atomic deviations among the
structures, comparison of the dihedral angles <fi, \]r and ^J, determination of networks of hydrogen bonds, as well as the examination of the crystallographic B-factors and intermolecular contacts in the crystal lattice. While all these comparison tools were applied to each protein, only those quantities are reported in Chapter 5 that best describe the observations for a given protein.
Two different questions were addressed regarding the quantification of atomic deviations, (a) How well can a set of atoms of one structure (e.g. the backbone) be superimposed onto the corresponding set of atoms of another structure ? (b) After the superposition of the best defined parts of two structures according to (a), how much do other parts (e.g. the side-chains) differ in their position and orientation ? In a first step of answering both questions, a subset of the protein atoms is selected for optimal superposition; these n atoms are denoted here with the index i. The two structures are then moved to the center of mass of the atoms i = 1,..., n, using the same weight factor for every atom. With ri and r't describing the position of atom i in the two structures after the center of mass translation, a rotation R is applied to the second structure such that the following expression becomes minimal:
2 |r,-Rr;|2. (1)
The following equation is then used to quantify structural differences for the group of atoms described by the index k with k = 1,..., m:
A = \-Z\r
k-Rr'A. (2)
If the two subsets of atoms defined by the indices k = 1,..., m and 1'. = 1,..., n coincide, A describes the usual RMSD value for these atoms (see Appendix in McLachlan, 1979), and yields an answer to question (a). For the case of different subsets of atoms k = 1,... ,m and i = 1,... ,n, A is referred to as displacement D (Billeter et al. 1989), and answers question (b).
An NMR structure is usually described by a group of about 20 conformers. Whenever such a group of conformers was involved in an RMSD or displacement calculation, individual comparisons with all conformers were performed and the resulting values were averaged. Different comparisons were made for the backbone atoms N, Ca and C , and for all heavy atoms. For the RMSD and displacement measurements it was assumed that the nitrogen and the oxygen in the side-chains of asparagines and glutamines cannot by distinguished in the electron density maps. In the crystal structures, the amide in these side-chains was therefore flipped by 1800 around the bond preceding it whenever a better fit with the set of NMR conformers could be obtained. (For reasons of atom nomenclature, the carboxylic groups of aspartic acid and glutamic acid, as well as the rings of phenylalanine and tyrosine were sometimes also flipped by 1800 with respect to the original data files.)
RMSD values were evaluated for the following two choices of residues. Initially, all residues were selected and the RMSD was calculated for all backbone atoms N, Ca and C , and for all heavy atoms. The second choice consisted of those
residues with smallest displacements D among the set of conformers describing the NMR structure. A threshold for D was determined in the following way. For each residue, the displacement of the backbone atoms was evaluated after superposition of the complete backbone. These D values were then sorted according to their size, and the largest gap in this series of numbers determined the threshold, with the condition that between § and § of the residues were selected. The choice then consisted of all residues which had a displacement of the backbone atoms smaller than the threshold. For the heavy atom comparisons, side-chains with displacements smaller than 1-5 times the threshold were added. Structural deviations were calculated for each protein usig the above procedures within the group of NMR conformers, and between this group and the single coordinate set reported for the crystal structure. In addition, a mean NMR structure was obtained by superposition of all NMR conformers using the selection of § to f of the protein backbone (see above), and averaging the coordinates of corresponding atoms of the NMR conformers.
Square roots of B-factors were used to indicate the expected structural deviations within the crystal structures according to the relation B » (Ax2}, with (Ax2} describing the square of the uncertainty of an atom position along the diffraction vector (Glusker & Trueblood, 1985; Buerger, 1980). Similar to the displacements D, B-factors were averaged over the backbone atoms N, Ca and C , or over the heavy atoms, of a residue. Because displacements D describing atomic deviations in NMR structures and B-factors describing atomic deviations in X-ray structures do not exactly match in their information content, these measures of precision were normalized in the following way prior to quantitative comparisons between NMR and X-ray structures:
and
The average, <-D>, and the standard deviation, AD, of the displacements D of each residue were calculated. The average <£)) was subtracted from the value D, and this difference was divided by the standard deviation AD. Thus the normalized displacement, Dn, for a given residue is negative when the displacement is smaller than the average displacement over all residues, and a value of Dn = i-o indicates a displacement that is one standard deviation worse than the average. A similar treatment yielded normalized values \/Bn for the square roots of the B-factors.
The most local view of structural differences is given by the values of individual dihedral angles, which represent the basic degrees of freedom when folding a polypeptide. The backbone angles <fi and \jr and the first side-chain angle x1 were plotted versus the protein sequence. For a given dihedral angle, the single value measured in the X-ray structure was plotted together with up to three distinct ranges of values observed in the NMR conformers.
On the level of the secondary structure, it is useful to examine the network of hydrogen bonds since these represent the most important interactions in helices and /^-sheets. In the present context, a hydrogen bond was defined whenever the distance between a donor heavy atom and an acceptor heavy atom was smaller than 3-4 A, and the angle defined by the position of the acceptor atom, the hydrogen and the donor heavy atom did not exceed 350. For this purpose, a hydrogen atom is attached to the donor, either in the unique position defined by the donor heavy atom and two other heavy atoms bound to the latter, or by the optimal position for hydrogen bonding when the donor heavy atom is bound to only one other heavy atom.
The above data was complemented by a list of contacts shorter than 3-0 A observed for the X-ray structure between different molecules in the crystal lattice. These crystal contacts were checked within a unit cell by application of crystallographic symmetry operations, and between unit cells by using periodic boundary conditions.
3. DETERMINATION OF PROTEIN STRUCTURES
3.1 Determination by NMR in solution
This chapter describes several factors that limit the structural accuracy that can be obtained using the two methods of structure determination of proteins. NMR data on proteins result mainly from constraints on proton-proton distances derived from NOEs (nuclear Overhauser effects), and from dihedral angle information deduced from vicinal coupling constants (Wiithrich, 1986). The density of the NOEs observed per proton decreases on the protein surface, and is also lowered by internal mobility. Thus, the structure at the surface of a protein, in particular of surface residues, is often less well determined due to the lower density of the experimental data and to the lack of a rigid structure.
In contrast, the presence of very local data given primarily by the coupling constants, but also by intraresidual and sequential NOEs, may determine the local structure very precisely. For example, in residues with a single /?-proton the three different conformers of the ^-angle can often be distinguished. For many other residues, the two protons of the /?-methylene groups can be individually assigned (Giintert et al. 1989). These stereospecific assignments may in turn allow to discriminate the different conformers of the ^-angle. Other dihedral angles in the side-chains may in a similar way be well determined by the NMR data.
NMR data determine the position of a proton relative to the positions of other, nearby protons. Errors in the position of a proton will therefore spread out to other protons whose positions are determined by NOEs to the first one. This is different for X-ray structures where the position of each atom is given directly by experimental data, namely a peak in the electron density map. As the numerous correct protein structures determined by NMR show, the small errors of the local structure do usually not add up to large errors of the global structure in globular proteins due to the requirements of the covalent structure and of the dense packing. The fact that correct overall dimensions are usually found for protein
structures determined by NMR does not, however, prevent occasional distortions of loops protruding from the globular part of the protein.
The need for converting the experimental distance data into atomic coordinates raises the question of possible biases of the distance geometry algorithms used for the calculation of the NMR structure. These have been discussed several times (e.g. Wagner et al. 1987; Havel, 1990; Kuszewski et al. 1992), and the important conclusion for this study is that in the best defined parts of a protein, none of the newer algorithms appear to produce significantly biased structures.
The distance geometry calculations implicitly assume a rigid structure by the use of static distance constraints. This is in contrast to the dynamic behaviour of real proteins. The averaging of the experimental data due to the internal mobility of the protein will in many cases yield an average structure, which may correspond to the most highly populated state. Difficulties arise when the protein structure jumps between two, or a small number, of conformations. The average structure described by the set of distance constraints might in this case be highly strained and thus be scarcely populated (Torda et al. 1990).
3.2 Determination by X-ray diffraction in single crystals
The fundamental steps, and difficulties, of solving the structure of a protein by X-ray diffraction in single crystals are the crystallization of the protein, the recording of a data set to high resolution, the determination of the phases in order to obtain the electron densities, the construction of an initial model, and the refinement of this model. A detailed discussion of potential pitfalls of X-ray diffraction studies on proteins, and of ways around them, was published recently by Branden & Jones (1990). The need of a crystallized form of the protein may require strongly non-physiological solution conditions from which the crystal is grown, e.g. with respect to the concentration of salts or added co-solvents. Furthermore, the introduction of heavy atoms in order to solve the phase problem is often accompanied by small structural changes of the protein. Phases are obtained from small differences between large numbers, and their errors may distort the electron density map. The subjectivity of the crystallographer plays an important role in the construction of the initial model into the electron density map. Today, constructing and testing hypothetical chain traces in the electron density map constitutes largely interactive work on a computer graphics system, and thus lacks the reproducible character of an automatic procedure. Knowledge of various features of the protein under investigation like content of regular secondary structure, known structure of related proteins and other chemical or physical information is used at this step. Difficulties in the construction of the initial model are more likely to occur in more mobile regions, e.g. on the protein surface and outside of regular secondary structure elements. Finally, an automatic refinement of the model attempts to modify both the structure and the phases to obtain the best agreement between the observed amplitudes and the amplitudes calculated from the structures. Additional constraints may describe the covalent structure. Optimization algorithms in high dimensions usually have a limited range of convergence. Thus, the refinement may fail in correcting errors of the initial
phases or of the initial model, and instead find values for the phases and a structure for which the target function of the optimization, the R-factor, reaches only a local minimum.
In single crystals, the protein molecules are densely packed and thus often form intermolecular contacts. These may immobilize surface side-chains that exhibit high mobility in the isolated protein, and may even affect the backbone conformation. For example, the comparison of the polypeptide backbone conformation of two different crystal forms of BPTI (Deisenhofer & Steigemann, 1975 ; Wlodawer et al. 1987 a; entries 4PTI and 6PTI, respectively, of the Protein Data Bank) yields a global RMSD value of 0-4 A with displacements of the backbone atoms of individual residues reaching r o A (for Argi7 after superposition of the backbone of residues 1—56). Often, the active site of a protein is located at the surface and therefore subject to distortions due to crystal contacts, thus making the interpretation of the active-site conformation of this protein difficult.
4. PROTEINS SELECTED FOR COMPARISON
Detailed comparisons between the NMR and X-ray structures of a total of twelve proteins (Table 4.1) are given in Chapter 5. (Crystallographic parameters for the twelve proteins used for the calculation of the lattice contacts are listed in the Appendix.) A requirement for the selection of these proteins was, besides availability of the coordinates, that an NMR structure and an X-ray structure exist for the same protein. This excludes cases where a structure has been determined for proteins from different species, where one structure is for the free protein and the other for a complexed form, or where protein fragments do not have the same length. Examples of such proteins not meeting the above requirements are the zinc fingers, plastocyanin, cellobiohydrolase, hirudin, several proteinase inhibitors, the receptor FKBP, and the activation domain of procarboxypeptidase B. Also excluded are a few proteins that have a structure very similar to that of another protein already on the list. Thus, the proteinase inhibitor domain of Alzheimer's /?-Amyloid precursor is not included due to its similarity to BPTI as quantified by a RMSD value for the backbone (residues 5-55) of o-6 A between the two proteins (Hynes et al. 1990). Leucine zippers are excluded, since their NMR structure consists of a simple helix; however, the C01E1 rop protein is included due to the presence of a tertiary structure, a four-helix bundle. This selection should best serve the purpose of evaluating the degree of structural similarity achieved by the two methods, and the differences resulting from the two techniques for structure determination.
The first protein, tendamistat, serves the purpose of demonstrating the comparison tools used in this study and is thus presented in greater detail. For most other proteins in the study, genuine differences between the two structures are identified, and an attempt was made to explain these differences. For the 434 repressor(i-69) and for BPTI, comparisons based on very similar tools as used here have recently been published, so that the corresponding sections in the following Chapter represent a short summary.
Tabl e 4.1 . Protein * Protein structures used in Sourc e the present comparison Numbe r o f a.a. § NMR f Metho d numbe r RMS D X-ray } resolutio n R-facto r O O a-Amylas e inhibito r Barnas e Ca-bindin g protei n Chymotrypsi n inhib . 2 C0IE 1 ro p protei n Interleuki n 1/ ? Interleuki n 8 Metallothionei n 43 4 repressor(i—69 ) Ribonucleas e A Thioredoxi n Trypsi n inhibito r Streptomyce s tenda e B . amyloliquefacien s Bovin e Barle y Plasmi d C0IE 1 Huma n Huma n Ra t Phag e 43 4 Bovin e E . col i Bovin e 7 4 11 0 75 83 63* 2 15 3 72* 2 3 0 + 3 1 6 9 12 4 10 8 5 8 DISMA N DISGE O + X-PLO R DISGE O + AMBE R DISGE O + X-PLO R DISMA N + X-PLO R DISGE O + X-PLO R DISGE O + X-PLO R DISMA N DIAN A + AMBE R Ow n + GROMO S DISGE O + AMBE R DIAN A + AMBE R 9 2 0 33 11 1 0 32 30 10 2 0 8 12 2 0 (69 ) I-I 1 (no ) 14(62 ) I-I (47 ) 0 4 (150 ) 0-4 (67 ) 2-o+i-7i f (30+31 ) o-6 (63 ) i-81j(i2 4 ) o-6 (106 ) 0-4 (55 ) 2-0 0-19 9 (74 ) to 2' 2 S 2-3 0-178(75 ) s 2' O 0-19 8 (65 ) I' 7 O-l8 2 (56 ) 2-O O-I 9 (151 ) 2-0 0-18 7 (69 ) 2 O 0-17 6 (6l ) 2-0 0-19 3 (63 ) I-2 6 O-I 5 (124 ) i-6 8 0-165(108 ) I-O O-2O O (58 ) * Se e th e tex t (Chapte r 5 ) fo r reference s t o thes e structures . § Thi s numbe r correspond s t o th e complet e protei n o r protei n domain . Th e numbe r o f residue s fo r whic h coordinate s ar e reporte d fo r th e NM R structur e an d th e X-ra y structure , an d thu s use d i n th e comparison , i s give n i n Tabl e 4.2 . C0IE 1 ro p an d interleuki n 8 for m dimers . Metallothionei n consist s o f tw o domain s tha t hav e n o significan t contact s i n th e solutio n o r crysta l structures . f Th e entrie s unde r th e headin g NM R repor t th e distanc e geometr y an d refinemen t program s use d fo r th e calculatio n o f th e solutio n structure , th e numbe r o f conformer s tha t describ e thi s structure , an d th e averag e RMS D valu e a s reporte d i n th e origina l publication s with , i n parentheses , th e numbe r o f residue s use d fo r th e RMS D calculation . DISMA N (Brau n & Go , 1985 ) an d DIAN A (Giinter t et al. 1991 ) ar e implementation s o f th e variabl e targe t functio n algorithm . DISGE O (Have l & Wiithrich , 1984 ) i s a n implementatio n o f th e EMBE D algorithm . X-PLO R (Brunger , 1990) , AMBE R (Sing h et al. 1986 ) an d GROMO S (va n Gunsteren , 1987 ) ar e Molecula r Dynamic s programs . 'Own ' indicate s no t furthe r specifie d cod e writte n b y th e author s o f th e structure . % Th e entrie s unde r th e headin g X-ra y lis t th e resolutio n o f th e crysta l structure , an d th e crystallographi c R-facto r with , i n parentheses , th e numbe r o f residue s fo r whic h coordinate s ar e reported . ^[ Thes e RMS D value s ar e average s o f pairwis e comparison s rathe r tha n o f comparison s fro m eac h conforme r t o a mea n structure . The y ar e abou t 1-5 time s large r tha n thos e calculate d t o a mea n structure .
Tabl e 4.2 . RMSD values from the mean NMR structure to the NMR conformers and to the X-ray structure Protein * a-Amylas e inhibito r Barnas e Ca-bindin g protei n Chymotrypsi n inhib . 2 C0IE 1 ro p protei n Interleuki n 1/ ? Interleuki n 8 Metallothionein : / ? a 43 4 repressor(i-69 ) Ribonucleas e A Thioredoxi n Trypsi n inhibito r Al l Nr . 7 4 10 7 7 5 6 4 5 6 15 3 6 9 3 0 3 1 6 3 12 4 10 8 5 8 residues f RMS D [A] J (NMR) - < (NMR> -NM R X-ra y 1-35 ; 16 9 : i - oo ; 1'4 4 098 ; 13 4 0-87 ; 1-4 3 0-90 ; 1-4 5 2-17 ; 2-5 0 76 ; 2-2 1 [•31 ; 17 1 [•19 ; 1-8 5 •16 ; 19 5 0-48 ; 0-8 5 0-99 ; 1-5 2 0-51 ; 1-0 4 2 1-36 ; 1-9 6 2 1-16 ; i-8 o o-6i ; I-I O 077 ; 1-1 4 076 ; 11 3 073 ; 1-0 7 >-oo ; 26 5 $-05 ; 2-5 8 •47 ; 23 6 •09 ; 1-6 2 •11 ; 1-5 8 •01 ; 1-5 3 •16 ; 1'4 4 Selecte d Nr . 56;4 3 72 ; 4 8 58 ; 4 4 49 ; 2 9 42 ; 1 8 118 ; 6 7 50 ; 2 7 21 ; 1 5 23 ; 1 4 49 ! 1 9 94 ; 7 2 76 ; 3 9 44 ; 2 4 residues f RMS D [A] J <NMR> -NM R 0-40 ; 0-5 6 0-62 ; 07 7 0-49 ; 06 6 0-47 ; 05 9 059 ; 0-6 5 0-26 ; 02 9 0-24 ; 0-3 1 o-86 ; 1-0 5 0-83 ; 0-8 7 0-40 ; 0-4 5 0-44 ; 0-5 2 o-37 ; 0-4 3 0-32 ; 0-3 4 <NMR> -X-ra y 0-69 ; 1-0 4 1-27 ; 1-3 9 071 ; I-I O o-86 ; 1-0 9 I-O I ; 1*0 7 0-64 ; 07 4 095 ; 1-2 6 i-34 ; i-7 3 1-28 ; 0-8 3 o-66 ; 07 7 076 ; 1-2 5 075 ; 1-0 5 0-64 ; o-8 1 * Se e footnot e t o Tabl e 1 . f 'Al l residues ' ar e thos e residue s whic h ar e foun d i n bot h th e NM R an d th e X-ra y structure . 'Selecte d residues ' ar e th e one s selecte d b y th e automati c procedur e describe d i n Chapte r 2 . X '<NMR> ' denote s th e mea n NM R structure , 'NMR ' th e se t o f individua l conformer s describin g th e NM R structure , an d X-ray ' th e X-ra y structure . Th e firs t numbe r i s fo r th e selecte d backbon e fragments , th e secon d fo r th e selecte d heav y atoms .
Table 4.2 lists, for each protein, the total number of residues for which coordinates are reported in both the NMR and the X-ray structure. Furthermore, the number of residues forming the well defined regions in the NMR structure is given (see Chapter 2 for their selection). These residues are used for all superpositions shown in the figures of Chapter 5. For both residue selections, RMSD values are listed for the comparison of the NMR conformers to their mean and between this mean structure and the crystal structure. The two values in each column are comparisons of the backbone atoms N, Ca and C , and of heavy atoms. Heavy atoms are either all non-hydrogen atoms in the protein or only those from the selected backbone fragments and the selected side-chains (see Chapter 2).
All crystal structures have a resolution of 2-3 A or better, with R-factors of 0-2 or below (Table 4'i). The RMSD values for all residues between the mean NMR structure and the individual NMR conformers vary from 0-5 A to 1-4 A; those between the mean NMR structure and the X-ray structure are in the range from i-oA and 2 7 A . In contrast, the backbone of the well defined regions is determined in the NMR structures for all but two proteins with a RMSD value not exceeding 0-5 A, whereas the differences to the X-ray structure are often larger than 0-5 A. If the best defined side-chains are included in the calculation of the global RMSD values, a threshold of about 075 A delimits the RMSD values of the mean NMR structure to the individual NMR conformers from those of the mean NMR structure to the X-ray structure.
5. INDIVIDUAL COMPARISONS
5.1 a-Amylase inhibitor (tendamistat)
The a-amylase inhibitor Hoe-46yA from Streptomyces tendae 4158 (also called tendamistat) is a small, very stable protein resistant to denaturation and proteolytic attack. It consists of two triple-stranded /^-sheets (residues 12-17, 20—25 and 52—58; 41-49, 30-37 and 67—73) with all neighbouring strands ar-ranged in an antiparallel fashion (Fig. 5.1.1). The structure is further stabilized by two disulfide bridges (Cysn-Cys27 and Cys45-Cys73). The tripeptide Trpi8-Argi()-Tyr2o is assumed to play a major role in the binding to a-amylase. The determination of the solution structure (Kline et al. 1986, 1988) yielded a well defined conformation for the complete backbone with the exception of about five residues at the N-terminus and of the C-terminal residue. This structure was based on 842 distance constraints from NOEs and about 70 constraints on dihedral angles. In the crystal structure (Pflugrath et al. 1986), unique positions are given for all atoms except for the aromatic ring of Tyri 5, for which no electron density could be observed. The NMR and X-ray structures of tendamistat have been compared earlier (Billeter et al. 1989). Fig. 5.1.1 shows the close coincidence of the backbone fold of the two structures. In the following, the precision of the structures determined by both NMR and crystallography is described in detail, and the differences between the two structures are evaluated in terms of this structural precision.
Fig. 5.1.1. Stereo view with the backbones of the mean NMR structure (thick line) and of the X-ray structure (thin line) of the a-amylase inhibitor tendamistat. Distortions of the covalent geometry for the terminal residues of the mean NMR structure are caused by the averaging of the coordinates. The superposition was calculated for selected residues which are identified in Fig. 5.1.2.
the nine conformers obtained after restrained energy-refinement using a large weight for the NOE distance constraints is considered (Billeter et al. 1990). A comparison of the complete backbone of the nine NMR conformers with their mean structure yields an average RMSD value of 1-35 A; for all heavy atoms a value of 1-69 A is obtained (Table 4.2). The selection procedure described in the Methods section identified 56 residues with a structurally well defined backbone in the solution structure, to which 43 side-chains with a well defined conformation were added. With this selection, the average RMSD values drops to 0-40 A and 0-56 A, respectively (see Fig. 5.1.2 for this selection).
A plot of displacements, D, versus the sequence is given in Fig. 5.1.2. The conformation of the four N-terminal residues is completely undefined in the NMR structure, and the next two residues still show a large structural spread. The following four residues clearly adopt a single conformation with Serio having both backbone and side-chain displacements, D, just above the threshold used for the selection of the best defined protein fragments. With the start of the first /?-strand, the peptide chain becomes very well defined. This remains true for the backbone of all six /?-strands except for the exposed Thr4i and for Cys73, the next to last residue. Other well defined backbone fragments are the loops 26-29 and 50-51 which connect the two /?-sheets, and the extension of the /?-strand 52-58, i.e. residues 59-61. Besides residue 10, all backbone fragments with an increased structural spread are located on one edge of the molecule (Fig. 5.1.1). The unstructured side-chains of residues with a well defined backbone part contain polar or charged groups located on the protein surface, namely Tyr2O, Glu29, Gln52, Asp58, Arg68 and Arg72; the only exception is Ile6i with a D-value for the side-chain just above the selection threshold.
D(A) l • •
3 ••
D(A) 2 • •
20 30 40 50
Amino acid sequence
60 70
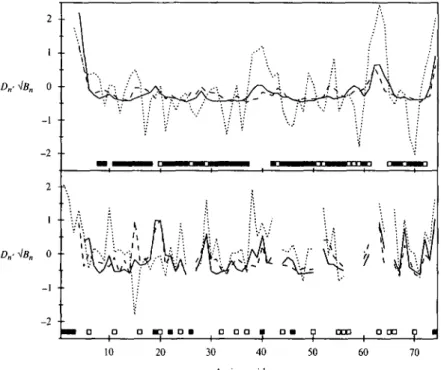
Fig. 5.1.2. Displacements and square roots of the B-factors are plotted versus the sequence for the a-amylase inhibitor tendamistat. Top panel: Displacements from the individual NMR conformers to their mean structure (solid line), and from this mean structure to the X-ray structure (broken line). All displacements are averaged over the atoms N, C and C . Centre panel: Same for the heavy atoms of the side-chains with averaging over all heavy atoms of the side-chains. The squares at the top of this panel identify the residues forming the best defined backbone fragments (for the selection procedure see Chapter 2). Filled squares indicate that the side-chain of the residue is also well defined. Lower panel: Square roots of the B-factors for the backbone (solid line) and the side-chains (broken line) of the X-ray structure. Squares at the bottom identify the residues with contacts in the crystal lattice to other molecules, where filled squares indicate intermolecular protein-protein contacts.
A closer look at the crystal structure and at the reported B-factors show a lower than average precision for a number of backbone fragments (Fig. 5.1.2). The N-terminal five residues are again among the structurally most disordered parts. In the first /?-strand, the backbone of Tyri5 has a slightly increased B-factor. Other less well defined fragments are the loop with residues 38-41 connecting the first
2 • • 1 • />„• Vfln 0 • • - l • • -2 1 • _i - 2 • •
-
;
j Jil
30 40 50 60 70Amino acid sequence
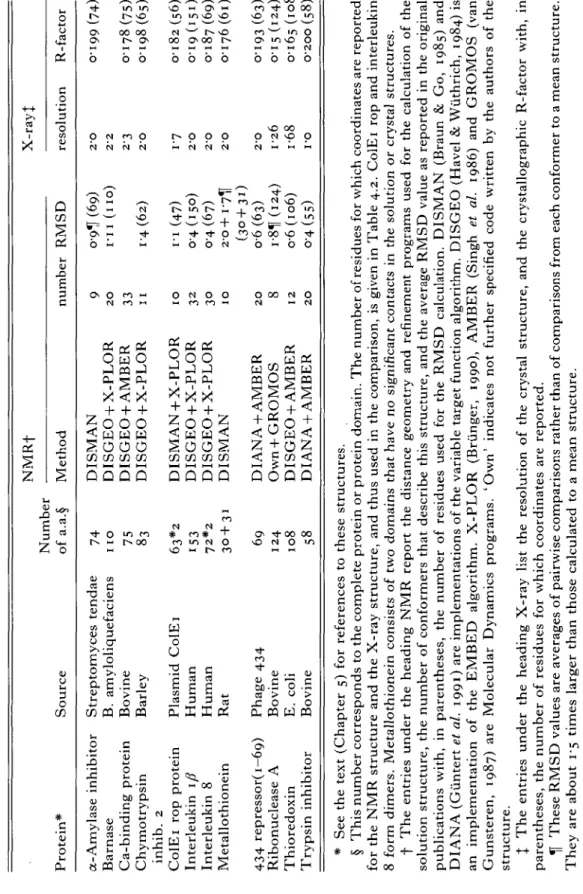
Fig. 5.1.3. Normalized displacements Dn (equation 3a) and normalized square roots of the
B-factors \/Bn (equation 3 b) are plotted versus the sequence for the a-amylase inhibitor
tendamistat. Solid line: Normalized displacements Dn between the N M R conformers and
their mean structure. Dashed line: Normalized displacements Dn between the mean N M R
structure and the X-ray structure. Dotted line: Normalized square roots of the B-factors \/Bn of the X-ray structure. Top panel: backbone, lower panel: side-chains. The squares in
the top panel identify the residues forming the best defined backbone fragments (for the selection procedure see Chapter 2). Filled squares indicate that also the side-chain of the residue is well denned. The squares in the lower panel identify the residues with contacts in the crystal lattice to other molecules, where filled squares indicate intermolecular protein-protein contacts.
two strands of the second /?-sheet, Thr54 on one of the outer strands of the first sheet, an exposed loop at one end of the molecule with residues 61—64, and the three C-terminal residues. Again, all but one of the disordered side-chains attached to backbone parts with small B-factors are polar or charged and located on the protein surface: Serio, Asp24, Glu2Q, GIU42, Gln52, His66 and Arg68. The exception is the side-chain of Val3i with a marginally higher than average B-factor.
The backbone displacements between the mean NMR structure and the crystal structure after global superposition are smaller than 0-5 A for 27 residues; the
o
side-chain displacements are smaller than r o A for 28 side-chains (Fig. 5.1.2). However, the global RMSD values of Table 4.2 are about i-6 times larger for the comparisons of the crystal structure with the mean solution structure than for the comparison of the individual NMR conformers to the mean solution structure. In Fig. 5.1.3, normalized values for the displacement after global superposition (equation 3 a) are plotted together with the normalized square roots of the
B--120
20 30 40 50 60 70
Amino acid sequence
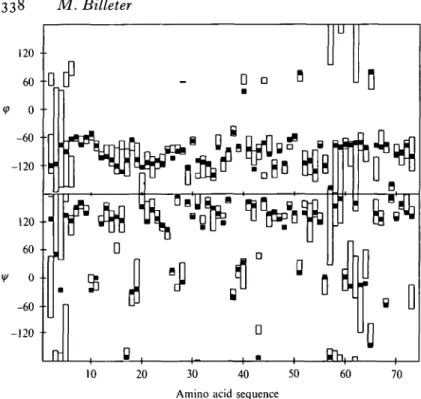
Fig. 5.1.4. Plot of t h e d i h e d r a l angles <fi and ijr versus t h e sequence for t h e a - a m y l a s e i n h i b i t o r t e n d a m i s t a t . T h e o p e n bars delineate t h e range of values a d o p t e d by the d i h e d r a l angles in t h e individual N M R c o n f o r m e r s . T h e filled s q u a r e s indicate t h e value of t h e c o r r e s p o n d i n g dihedral angle in t h e X - r a y s t r u c t u r e .
factors (equation 36). The displacements between the solution and the crystal structure follow closely those describing the solution structure for both the backbone and the side-chains, whereas the curve for the normalized square roots of the B-factors shows the largest variations. Differences between the two structures exceeding the normalized precision of each structure by more than 0-4 s.d. occur for the side-chains of Tyri5 and lies3. The difference for Tyri5 can be explained by the absence of electron density in the crystal structure for this side-chain. For Ile53, which is well defined by both methods, no obvious explanation is available. This side-chain is located on the protein surface, next to T y r i s . In the crystal structure, its ^-methyl group is where the y-methyl group is in the solution structure, and in the NMR structure, the ^-methyl group is about 2 A away from the ring of Tyri5. Two side-chains, Argio. and Tyr2O, are clearly better defined in the X-ray structure. For each of these side-chains, contacts to other protein molecules and to crystal water molecules are detected (Fig. 5.1.3). Local backbone differences described by the dihedral angles (Fig. 5.1.4) are observed for residues 5-6, 15-16 and 43-44, and thus do not coincide with the major differences detected after global superposition. In most cases, these local differences are due to the rotation of individual peptide planes, which occur mostly on the protein surface.
The network of hydrogen bonds is very similar, in particular for those involving backbone-backbone interactions. Of the 34 hydrogen bonds observed, only four
=60
Fig. 5.2.1. Stereo view with the backbones of the mean NMR structure (thick line) and of the X-ray structure (thin line) of barnase. The superposition was calculated for selected residues identified in Fig. 5.2.2.
have different bonding partners in the two structures: The amide proton to carbonyl oxygen hydrogen bonds Gly26—Asp24 and Asp4O-Tyr37 of the solution structure was replaced by Gly26-Cysi 1 and Asp4o—GIU38 in the crystal structure. In the NMR conformers, the amide proton of Gly62 is sometimes bound to Tyr6o rather than to Gly59 as in the crystal. The carbonyl oxygen of Val36 pairs with the amide of Tyr6g in the solution structure and to the OH of Tyr69 in the crystal structure. With the hydrogen bonds involving side-chain atoms, 22 are common to both structures, 11 occur in the solution structure only and 13 in the crystal structure only.
In summary, there is a strong similarity of the two structures which holds for practically the entire polypeptide backbone and for many side-chains. This similarity often extends to the degree of local precision with which the two methods have determined the structure. Interestingly, the largest difference in side-chain precision is observed for the expected active site (Argi9 and Tyr2o). The only difference between the two structures that cannot be explained neither by the lower precision of one or the other method nor by crystal contacts (Fig. 5.1.3), is the side-chain conformation of Ile53.
5.2 Barnase
Barnase is a purine-specific ribonuclease from Bacillus amyloliquefaciens with 110 residues. It consists of two helices with residues 6-18 and 26-34, and a five-stranded antiparallel /?-sheet with residues 50-55, 70—75, 85-91, 94—101 and 105—108 (Fig. 5.2.1). Its structure differs from that of pancreatic ribonuclease (Mauguen et al. 1982). The active site involves HisiO2, which is a conserved residue among several bacterial ribonucleases. In the folded protein two additional conserved residues, GIU73 and Arg87, are located next to HisiO2. The crystal structure at a resolution of 2-2 A was presented by Mauguen et al. (1982), and the
NMR structure for this protein was recently reported based on 853 distance constraints from NOEs, 72 constraints on ^-angles and 53 constraints on ^-angles (Bycroft et al. 1991).
According to the procedure explained in Chapter 2, the backbone of 72 residues (see Fig. 5.2.1) was selected as well denned and superimposed to obtain a mean structure. These fragments include all regular secondary structure elements. Restriction to these residues reduces the average backbone RMSD between the 20 NMR conformers and their mean structure from i-o A to 0-62 A (Table 4'2). When including 48 well denned side-chains (see Fig. 5.2.1), a RMSD of 077 A is obtained.
In the Protein Data Bank entry for the crystal structure, a different coordinate set was reported for each of the three protein molecules in the asymmetric unit (Mauguen et al. 1982). These are all very similar with a RMSD for the complete backbone of only 0-38 A. One of the three coordinate sets contains no entries for the first three residues (the other two sets give coordinates for the third residue), and it has two conformations reported for the side-chain of Lys49. For this structure, which is used in the following comparison, occupancy factors smaller than i-o are given for several peripheral side-chain atoms of Lysi9, Lys27, Gln3i, Arg59, Lys66 and Lys98.
The superposition of the mean NMR structure and the crystal structure in Fig. 5.2.1 shows, that besides the good structural coincidence for large parts of the polypeptide chain, some significant deviations occur in the outer loops containing residues 35-44 and 67-70. The RMSD comparison of the mean NMR structure and the crystal structure yields 1-27 A for the backbone of the 72 residues that are well defined in the NMR structure and 1-39 A if the heavy atoms of the 48 well-defined side-chains are added (Table 4.2). The following discussion is based on inspection of the structures with computer graphics, on the normalized displacements Dn and B-factor values \/Bn reported in Fig. 5.2.2, and on the analysis of hydrogen bonds, dihedral angles and crystal contacts.
Except for residues 27—28, there is good similarity of the backbone fold from the second residue to the end of the second helix, and the normalized displacements between the mean NMR structure and the crystal structure correspond in magnitude to those between the mean NMR structure and the individual NMR conformers (Fig. 5.2.2). This is in spite of the large B-factors reported for residues 15-18 which form the second half of the first helix. Increased B-factors are also given for residues 4, 13-14, 19 and 28-29; the latter may explain only the apparent structural difference in the first 34 residues. The loop with residues 35-47 shows significant structural differences between the two structures, which cannot be fully explained by the low degree of structural definition for this fragment in the NMR structure. The two structures converge again for the first /?-strand. The central two glycines of this strand, 52 and 53, adopt however a different conformation. Interestingly, the following residues 57—60 also show good structural coincidence in spite of both a large structural spread among the NMR conformers and increased B-factors. This coincidence is continued to residue 66. The fragment 67-70 shows sizeable differences combined with a low definition of
Dn.
- 2 • •
o • finrm mn CD i QDO : m DOC
20 40 60
Amino acid sequence
100
Fig. 5.2.2. Normalized displacements, Dn (equation 3a), and normalized square roots of the B-factors, \/Bn (equation 36), are plotted versus the sequence for barnase. See the caption to Fig. 5.1.3 for the information in the three panels and the meaning of the different line types and squares.
both the NMR and the crystal structure. The remaining part of the protein forms three well defined /^-strands. Fragments of increased disorder within the NMR and the crystal structure, and between the two, correspond to the turns and loops connecting these strands.
Obvious differences in side-chain conformation in the fragments 4—34, 48-66 and 71—110, i.e. excluding the regions with large backbone differences between the two structures, are found for the following six residues. The backbone of Argso is not well defined in the NMR structure. Lys66 is at the beginning of the poorly defined loop 67—70 in both structures. Thr7Q and the C-terminal residues Lysio8 and Argiio are in loops connecting /^-strands, and are not well defined in the NMR structure due to their size and their location on the protein surface. The most interesting difference occurs for His 102, which is reasonably well denned in both structures, and is involved in the enzymatic activity of barnase (see below). As expected, most of the hydrogen bonding network involving the protein backbone coincides between the two structures. Exceptions were only found in the least well defined regions 35-47 and 67-70, for Gly53 in the centre of the first /?-strand, and at the edges of the /?-sheet, where donors or acceptors are sometimes replaced by equivalent groups of a sequentially neighbouring residue. The
20 40 60 80 100 Amino acid sequence
Fig. 5.2.3. Plot of the dihedral angles cj) and ijf versus the sequence for barnase. The open bars delineate the range of values adopted by the dihedral angles in the individual NMR conformers. The filled squares indicate the value of the corresponding dihedral angle in the X-ray structure.
different hydrogen-bonding pattern in the first /?-strand is probably due to a hydrogen bond constraint used for the NMR structure calculation and derived from exchange data and secondary structure identification (Bycroft et al. 1990). This forces a hydrogen bond from the oxygen of GIU73 to the amide of Asp54, whereas the amide of Gly53 is bonded by this oxygen in the crystal structure.
The structural coincidence is also present on a very local level, as shown by the dihedral angles <f> and i/r (Fig. 5.2.3). All positive 0-angles of the crystal structure were also found in the NMR structure (Bycroft et al. 1991). Differences for residues 18-19 and 34-35 correspond to rotations of the peptide planes. The different conformation of glycines 52 and 53 was already mentioned. Finally, differences were found to the ^-angles of residues 77 and 85, which are located at a hinge position for the loop between the second and third /?-strand. This loop makes most of its contacts with the ill-defined region 35-47. While almost all residues in the crystal structure are in contact with observed water molecules, only nine residues form inter-protein contacts (Fig. 5.2.2). About one third of these protein-protein contacts are between HisiO2 or Glnio4 and Hisi8, and are thus related to the active site. Another third connects the three C-terminal residues to the residues 38 and 82, both of which are in more disordered regions.
Genuine structural differences were thus observed for the backbone of residues 35-47, the backbone of Gly53 and the side-chain of Hisio2. The first difference affects an apparently flexible region and seems to be related to the numerous
i75 175
Fig. 5.3.1. Stereo view with the backbones of the mean NMR structure (thick line) and of the X-ray structure (thin line) of calbindin. The superposition was calculated for selected residues identified in Fig. 5.3.2.
crystal contacts of residue 38. The different hydrogen bonding pattern around Gly53 is probably due to a distance constraint enforcing a particular hydrogen bond (Bycroft et al. 1990). The different conformation of HisiO2 between the two structures seems related to the crystal lattice contacts with His 18, and to the large B-factors for this latter histidine. Possibly, His 18 makes some contacts similar to those by the RNA substrate.
5.3 Calbindin
Calbindin is a 75 residue calcium-binding protein of the Calmodulin family (also called Vitamin D-dependent Ca-binding protein). Four helices (residues 2-16, 24—36, 45—54 and 62—75) connected by loops of seven or eight residues determine the fold of the bovine form of the protein, which is investigated here (Fig. 5.3.1). The loops between the first two helices and between the last two helices each bind one Ca2+ ion. This helix-loop-helix motif formed by both pairs of helices is common to many Ca-binding proteins. In the X-ray structure (Szebenyi & Moffat, 1986), the peptide bond to proline 43 was described to be in a trans-configuration; however, other studies have shown that an equilibrium between cis and trans exits (Chazin et al. 1989; Svensson et al. 1992). In the NMR structure study (Skelton et al. 1990; W. J. Chazin, personal communication), this proline was substituted by a glycine (and is thus also in a ^am-configuration). In contrast to the crystal structure, the solution structure was determined in the absence of calcium.
The global RMSD values between the mean NMR structure and the 33 individual NMR conformers are 0-49 A for the backbone of 58 residues, and o-66 A when the heavy atoms of 44 side-chains are added (see Fig. 5.3.2 for the
- i •
- 2 •
i > 11 m cap i ODD a wo a:
10 20 30 40 50 60 70
Amino acid sequence
Fig. 5.3.2. Normalized displacements Dn (equation 3a) and normalized square roots of the
B-factors \/Bn (equation 36) are plotted versus the sequence for calbindin. See the caption
to Fig. 5.1.3 for the information in the three panels and the meaning of the different line types and squares.
residue selection). The local backbone precision of the NMR structure is given in Fig. 5.3.2 in terms of normalized displacements. The displacements are lowest for the four helices and highest for the loop connecting the two helix-loop-helix motifs (Fig. 5.3.2). The spread among the NMR conformers is also increased for the two Ca-binding loops, probably due to the absence of calcium in this structure.
The X-ray structure shows small B-factors for the backbone of the first helix-loop-helix motif including the Ca-binding loop (Fig. 5.3.2). The B-factors increase at the end of the second helix, are high for the loop connecting the two Ca-binding motifs, and remain above average for the third helix. After rather low values for the second Ca-binding loop and the first part of the last helix, they increase again for the C-terminus. The bottom of Fig. 5.3.2 shows only very few protein-protein contacts in the crystal lattice. However, Szebenyi & Moffat (1986) list additional intermolecular hydrogen bonds between the side-chain of Glu4 and the amide of Leu46, the side-chains of G1U5 and Asn56, the side-chains of Lysi2 and GIU64, and the side-chains of Lysi6 and G1U48.
The global RMSD values between the mean NMR structure and the crystal structure are 071 A for the backbone of the 58 selected residues, and n o A when the heavy atoms of 44 selected side-chains are added (Table 4.2), indicating the close coincidence of the two structures. This similarity is strongest for the helices, followed by the Ca-binding loops (Figs 5.3.1 and 5.3.2). The largest difference
30 40 50 60 70 Amino acid sequence
Fig- 5-3-3- Plot of the dihedral angles <j> and \jr versus the sequence for calbindin. The open bars delineate the range of values adopted by the dihedral angles in the individual NMR conformers. The filled squares indicate the value of the corresponding dihedral angle in the X-ray structure.
between the two structures is observed for the loop between the second and the third helix, where a structural heterogeneity is reported involving Pro43 (see above). In both structures, the two Ca-binding loops, residues 17-23 and 55-61, are connected by two hydrogen bonds between the amide and carbonyl groups of Leu23 and Val6i.
Other significant differences, i.e. differences exceeding the precision of both structures, are observed for the backbone of residues 20-28 and 59-62. These are most likely due to the presence of the calcium in the crystal structure, and are correlated to each other by the two hydrogen bonds from Leu23 to Val6i. This difference is propagated into the second helix, where a hydrogen bond from Glu26 and Leu3<D is observed only in the X-ray structure. In addition, a different hydrogen bond is formed by the chain of Asn2i, which binds to the side-chain of Asp 19 in the crystal structure and to the side-side-chain of Gln22 in the NMR structure. Finally, a significant difference in side-chain conformation is seen for GIU64, which forms a hydrogen bond to another protein molecule in the crystal (Szebenyi & Moffat, 1986).
Sizeable differences in backbone dihedral angles (Fig. 5.3.3) are all located in the three loops between the helices, and describe mostly rotations of peptide planes. For most dihedral angles, the range of observed values in the NMR conformers is very narrow, and the coincidence with the crystal structure is outstandingly good.
Fig. 5.4.1. Stereo view with the backbones of the mean NMR structure (thick line) and of the X-ray structure (thin line) of chymotrypsin inhibitor 2. The superposition was
calculated for selected residues identified in Fig. 5.4.2.
Thus, when accounting for the fact that calcium is present in the crystal structure but not in the NMR structure, the only significant difference is observed for the side-chain of GIU64, probably due to its intermolecular hydrogen bond.
5.4 Chymotrypsin inhibitor 2
The chymotrypsin inhibitor 2 from barley seeds is an interesting member of the serine proteinase inhibitor family because it lacks the characteristic disulfide bridges of most other inhibitors. A crystal structure appeared in 1987 (McPhalen & James). In the same year a first NMR structure was reported (Clore et al. 1987 a), and the two structures were compared (Clore et al. 19876). Recently, a refined NMR structure was presented and compared to the crystal structure (Ludvigsen et al. 1991). The comparison given here is based on the latter NMR structure. The entire protein consists of 83 residues, however, neither the X-ray nor the NMR study could determine the conformation of the first 19 residues. In addition, both structures describe the loop with residues 54-62 as flexible. It is worth noting that the active site Met59-Glu6o is part of this loop. The core of the protein is formed by a /?-sheet with both parallel and antiparallel relative strand orientations, covered on one side by a helix with residues 32—43 (Fig. 5.4.1). In the crystal structure the description of the /?-sheet includes residues 22—24, 3°> 47~53> 64-71, 75-77 and 80-82 (McPhalen & James, 1987). In the new NMR structure, the one residue long 'strand' 30 is extended to include residues 29-31. The strand 22-24 runs antiparallel to residues 80-82, and so does the second strand with respect to residues 76-75. The residues 75-77 and, in the NMR stucture only, the residues 80-82 form an antiparallel sheet with the strand 64-71, which in turn runs parallel to the strand 47-53. The following discussion of similarities and differences of the two structures is based on global displacements and on square roots of B-factors (Fig. 5.4.2).
D(A) D(A) 2 • 1 • • 6 5 •• 4 • • 2 • D D BODDBBBDBODOOBOBDBBOO O DOBIOOOBBIO B C -H 1 1 1 h-20 30 40 50 60 70 80
Amino acid sequence
Fig. 5.4.2. Displacements and square roots of the B-factors are plotted versus the sequence for chymotrypsin inhibitor 2. See the caption to Fig. 5.1.2 for the information in the three panels and the meaning of the different line types and squares.
The NMR structure was based on 961 NOEs and 94 restraints on dihedral angles. The well defined parts include the backbone of residues 22—43, 46~53, 63—79 a nd 81—82, as well as 29 sidechains (see Fig. 5.4.2). The RMSD values of the 20 NMR conformers to their mean are 0-47 for the backbone and 0-59 for all well denned heavy atoms (Table 4.2). The global displacements for the backbone of the NMR structure show little variation, with peaks for residues 44-45 and the terminal residues, and of course for the flexible loop 54-62. Large side-chain displacements occur mostly in this loop.
A similar picture is shown in Fig. 5.4.2 for the B-factors of the X-ray structure. The pronounced peak for the flexible loop is flanked by particularly low B-factor values for the backbone of residues 49-53 and 68-69. Most of the protein-protein contacts in the crystal lattice affect residues 45, 49-50, 58, 60, 71, 76-78 and 81. Fig. 5.4.2 shows that except for the less well denned backbone segments and a
Fig. 5.5.1. Stereo view with the backbones of the mean N M R structure (thick line) and of the X-ray structure (thin line) of the C0IE1 rop protein. The superposition was calculated for selected residues identified in Fig. 5.5.2.
few residues (30, 38, 79-81), the deviation from the X-ray structure to the mean NMR structure exceeds that from the individual NMR conformers to the mean NMR structure by approximately a factor of two. This factor is also found for the RMSD values between the mean NMR structure and the X-ray structure (Table 4.2). Interestingly, the largest deviations between the two structures is sometimes within regular secondary structure elements, e.g. GIU33 in the helix, or Ile49 and Val7o in the last two /?-strands. No obvious explanation is at hand for the first difference, except possibly the use of hydrogen bond constraints for the NMR structure: The hydrogen bond from GIU33 to Lys37 occurs in all NMR conformers, while it is absent in the X-ray structure. The other two differences may be explained by the numerous protein-protein contacts in the crystal lattice between Valso and Asp7i, and between Ile49 and residues 76—77. Contacts from residues 78 and 81 go to residues 58 and 60, and thus to the flexible loop. Other crystal contacts are between the glutamic acids 45 of two neighbouring molecules. These contacts may explain the most significant structural deviations for the side-chains, i.e. for Ile49 and in the loop 72-75, G1U33 again being an exception.
The agreement between the two structures of the backbone dihedral angles is very good, except for some residues in the loop 72-74, where crystal contacts are also likely to influence the local structure. As with the a-amylase inhibitor tendamistat and with barnase, it is noteworthy that crystal lattice contacts again involve the active site with residues 58-60.
5.5 C0IE1 rop protein
The C0IE1 repressor of primer (rop), a 63 residue long protein, controls the replication of the plasmid PBR322. It consists of two antiparallel helices with residues 3—28 and 32—56, and exists as a homodimer forming a four-helix bundle
(Fig. 5.5.1). The X-ray structure (Banner et al. 1987) gives coordinates for the first 56 residues. The NMR structure reports coordinates for all 63 residues, but the C-terminal tail is not structured (Eberle et al. 1991). A brief comparison of the two structures is found in Eberle et al. (1991).
The extensive contact area between the two monomeric unit adds a new aspect to the evaluation of the NOEs for the determination of the NMR structure. In addition to the assignment of the corresponding cross peaks to individual protons, the NOEs needed to be attributed either to protons of the same monomer or to protons located on different subunits of the dimer. For the determination of the monomer conformation, 397 NOEs were observed. The dimer structure was determined with the help of 30 additional, intermolecular NOEs. Conformers of the dimers were obtained by docking two identical copies of the monomer. These were then subjected to molecular dynamics calculations without imposing symmetry constraints. For the final structure, the conformational difference among monomeric units of the same dimer is smaller than between monomeric units of different dimers. The selection of the best defined fragments of the NMR structure yields a RMSD value of 0-59 A for the backbone of residues 5—14, 16-27, 32—50 and 52. As expected, the most disordered regions are the two chain termini and the loop connecting the two helices (Fig. 5.5.2). The addition of 18 side-chains located in the helices (see Fig. 5.5.2) increases the RMSD only marginally to 0-65 A.
The distribution of local precision in the crystal structure as described by the B-factors follows the same pattern as in the NMR structure, i.e., the best defined regions are again the helices (Fig. 5.5.2). Difficulties in reproducing the unit cell parameters from crystal to crystal were explained by the formation of layers of Rop molecules whose relative position varies. Thus, intermolecular interactions in the crystal should occur mostly within the dimers.
Due to the simple tertiary fold, the structure comparison reveals only few differences. Many of the apparent backbone differences shown in Fig. 5.5.2 are located at the termini or in the loop connecting the two helices (residues 29-31). They thus correspond to the least well determined regions in both the NMR and the crystal structure. Significant differences are observed for residues 6-7, 32—33, 36, 43 and 46—47. Many of them correlate with crystal contacts between different dimer molecules involving residues 2—4, 7, 16, 20, 24, 32 and 35-36 (Fig. 5.5.2). In contrast to some other calculations of NMR structures (e.g. the two interleukins discussed later), the present structure determination made use of the Coulomb potential during the final steps. This might explain the salt bridge between the side-chains of Asp43 and Arg5o which is not found in the crystal structure. The consequence is a slight compression of the helix, which is responsible for the differences of the backbone of residues 43 and 46-47.
The largest apparent differences of side-chains between the two structures are observed for exposed residues in the monomer, namely residues 7, 10-11, 13, 16, 18 and 25 on the first helix, residues 36, 39, 43, 47 and 50 on the second helix, and residues 30 and 32 in the loop (Fig. 5.5.2). With the exception of two residues, these side-chains are also the ones with the largest disorder in the two structures
D(A) 2 •• 1 •• 3 • • D(A) 2 • • 1 • • Vfl 2
> DDDBODOaDD OIOHIOIOOIO j icaMHDIIIDGIIDQiD O
• • • • • O DD DO DO DDD DOO DDI
10 20 30 40 50
Amino acid sequence
Fig. 5.5.2. Displacements and square roots of the B-factors are plotted versus the sequence for the C0IE1 rop protein. See the caption to Fig. 5.1.2 for the information in the three panels and the meaning of the different line types and squares.
(Figs. 5.5.2). The exceptions are Thr7 and Asp36 which form inter-dimer hydrogen bonds.
Due to the helical character, the distribution of backbone torsion angles is very uniform, and similar in both structures. A genuine difference concerns the x1 -angle (not shown) of Valio.. The two methyl groups, which are located in the interior of the monomeric unit, are rotated by about 1200. This side-chain is among the best defined in both structures. Other differences in x1 are observed for the surface residues 30, 40 and 50, all of which are not particularly well defined in the two structures.
5.6 Interleukin ifi
With 153 residues, interleukin 1/? is the largest protein presented in this comparison study. As a member of the cytokine family, it is produced mainly by
Fig. 5.6.1. Stereo view with the backbones of the mean NMR structure (thick line) and of the X-ray structure (thin line) of interleukin 1/?. The superposition was calculated for selected residues identified in Fig. 5.6.2.
phagocytes in response to infections. Several research groups have determined the structure of this protein independently: three X-ray structures (Finzel et al. 1989; Priestle et al. 1989; Veerapandian et al. 1992) and one NMR structure (Clore et al. 1990 a; 1991) have appeared at nearly the same time. A detailed comparison between the NMR and the X-ray structure was given by Clore & Gronenborn (19916). The structure of interleukin 1/? (Fig. 5.6.1) consists of 12 /?-strands (residues 5-12, 17-22, 25-30, 40-52, 55-62, 67-74, 77-85, 99~i°6, 109-114, 120-125, 130-135 and 143-151) and a 310 helix (residues 33-39). All pairs of
strands are oriented in an antiparallel fashion, and the peptide bond before Pro9o is in a cis confirmation.
The NMR structure was derived from 2780 distance constraints and 366 dihedral angle constraints. The RMSD values for the complete backbone and for all heavy atoms, 0-48 A and 0-85 A, are the smallest ones in Table 4.2. After the automatic selection of backbone fragments with 118 residues and of 67 side-chains
o o
(see Fig. 5.6.2) these RMSD values drop to 0-26 A and 0-29 A, respectively. The NMR structure is thus particularly well defined. The normalized curve for the global displacements between the NMR conformers and their mean structure (Fig. 5.6.2) correlates well with the distribution of the /^-strands.
From the three crystal structures, the one by Priestle et al. (1989) was chosen here, because coordinates for all atoms are included in this structure, and no second conformation of any residue is given. The lack of coordinates for the first two residues in the other two crystal structures, and the presence of two conformations for residue 64 in the structure by Finzel et al. (1989) indicates some flexibility in the conformation of these residues. Otherwise, the three structures are very similar with backbone RMSD differences for residues 3-62 and 66-153 between 0-31 and 0-36 A. The normalized curve for the square roots of the B-factors shows again a strong correlation with the regular secondary structure elements (Fig. 5.6.2).
With 0-64 A and 074 A, the RMSD values between the NMR and the X-ray structure for the selected regions of the protein are almost 2'5 times larger than the
- 2 - •
=¥—i—i—i—
20 40 60 80 100 120 140
Amino acid sequence
Fig. 5.6.2. Normalized displacements Dn (equation 3a) and normalized square roots of the
B-factors \/Bn (equation 36) are plotted versus the sequence for interleukin 1/?. See the
caption to Fig. 5.1.3 for the information in the three panels and the meaning of the different line types and squares.
corresponding RMSD values describing the NMR structure. The superposition in Fig. 5.6.1 shows that significant deviations of the two backbones occur for terminal residues and for loops located on the periphery of the protein. The normalized displacements and B-factors of Fig. 5.6.2 show that the variation of the B-factors and of the NMR displacements coincide, and follow the pattern of the secondary structure. Differences in the backbone conformation that are not explained by lower precision in one or both of the two structures occur for the following residues. G1U64 can adopt a second conformation in the crystal environment (see above). The carbonyl oxygen of Asp86 hydrogen bonds to the amide of Asn89 in the crystal structure and to the amide of Tyr9o in the NMR structure. Thri47 makes two backbone hydrogen bonds to A r g n in the crystal structure, whereas in the NMR structure the side-chain OH of Thri47 binds to the oxygen of Argi 1.
The largest local difference as identified in a plot of backbone dihedral angles (not shown) is encountered for residues 106-108. In the crystal structure, the Wr-angles for residues 106-107 a nd the ^-angles for residues 107-108 are all about
— 900. The NMR structure, however, has values of all these angles of about + 6o°. Residues 106—108 are located on the surface. They are thus not among the best
Fig. 5.7.1. Structure of the dimer of interleukin 8. The crystal structure is drawn with a heavy line for one monomeric unit and a thin line for the other.
defined parts in the NMR structure, and the B-factors of the crystal structure are the largest except for the terminal residues.
The following side-chains show significant differences of their conformation in the two structures (Fig. 5.6.2). GIU15 is located on the surface. In the NMR structure its conformation is not very well denned but tends to point away from the protein. In the X-ray structure, residues 14 and 15 are in contact with another protein molecule, thus the side-chain of G1U15 might be pushed to the side. Gln8i, Lys92 and GIU128 are also surface residues. In the crystal structure they interact with other side-chains forming hydrogen bonds or salt bridges: Gln8i—Lys74, Lyso.2—Tyrc>o and GIU128—His3O. In addition, GIU128 forms an intermolecular salt bridge to Lys6s. The intramolecular surface interactions are not likely to be detected by NMR. Finally, the observed difference for Asnio7 is due to the different backbone conformations; in fact the side-chain tries to compensate this difference by placing its peripheral group at similar positions in the two structures.
5.7 Interleukin 8
Interleukin 8, another cytokine, is involved in the response to inflammatory stimuli. It forms a homodimer by joining /?-sheets from two monomeric units to a larger sheet (Fig. 5.7.1). Each subunit consists of 72 residues. These /?-strands with residues 23—30, 36—43 and 48—51 are connected by short loops (Fig. 5.7.2). The first strands of the two subunits run antiparallel to each other, thus connecting the two /?-sheets to form a six-stranded, fully antiparallel sheet in the dimer. The helices of the two units (residues 56-72) run antiparallel to each other on the same side of the /?-sheet at an angle of about 60° to the /^-strands. As for the C0IE1 rop protein, the discrimination between intra- and inter-subunit NOEs presented an additional challenge to the determination of the NMR structure (Clore et al. 19906). An interesting aspect of the determination of the X-ray structure was the use of the NMR structure as starting model to solve the phase
Fig. 5.7.2. Stereo view with the backbones of the mean NMR structure (thick line) and of the X-ray structure (thin line) of interleukin 8 (only one monomeric unit). The
superposition was calculated for selected residues identified in Fig. 5.7.3.
problem (Baldwin et al. 1991). Comparisons of the two structures were presented in Baldwin et al. (1991) and in Clore & Gronenborn (1991 c). The NMR structure includes coordinates for residues 2—72, while the X-ray reports electron density, and thus coordinates, only for residues 4—72.
For the NMR structure, a total of 2242 constraints were used. Each subunit was defined by 847 distance constraints from NOEs, 52 constraints for hydrogen bonds and 181 dihedral angle constraints. In addition, 70 distance constraints from NOEs and 12 hydrogen bond constraints connect the two subunits (note that two constraints enforce one hydrogen bond). The automatic selection of well defined parts of the NMR structure (see Chapter 2) eliminates the backbone of residues 4-7, 9-11, 35-39, 45-46, 52-54 and 70-72. The variations of the global backbone displacements for the NMR conformers relative to their mean structure are, however, very small (Fig. 5.7.3), and exceed C4 A only for a few residues at the chain termini. Similarly, nearly all global displacements for the side-chains are smaller than 2-o A, but the selection procedure described only the side-chains of 27 residues with displacements smaller than 05 A as well defined (Fig. 5.7.3).
In the crystal structure, larger values for the B-factors of the backbone are again only given for the terminal residues (Fig. 5.7.3). The best-characterized parts include the three /^-strands and the N-terminal half of the helix.
The RMSD value of 2-0 A for the complete backbone between the mean NMR structure and the X-ray structure indicates the presence of some significant structural differences. For the backbone selected as well defined in the NMR structure this RMSD is reduced to 0-95 A, which is still significantly larger than the 0-24 A from the individual NMR conformers to their mean structure. In addition, the displacements between the NMR and the X-ray structure are all larger than those between the NMR conformers and their mean structure. The major backbone deviations between the two structures involve residues 4-10, 31—33, 35-36, 44, 53-54 and 71-72. Except for two terminal residues on each chain
D(A)
D(A) 2 ••
2 •
10 70
Amino acid sequence
Fig- 5-7-3- Displacements and square roots of the B-factors are plotted versus the sequence for interleukin 8. See the caption to Fig. 5.1.2 for the information in the three panels and the meaning of the different line types and squares.
end, these differences exceed the variations attributed to both the NMR and the X-ray structure due to their precision. The N-terminus and residues 31-36 are located next to each other at one edge of the /?-sheet and connected by the disulfide bridge 7-34, while the other residues are at different, exposed corners of the protein. Lattice contacts to other dimers may explain the structural variations of residues 6, 10, 44 and 54. The conformational difference of the loop 31-35 might be relevant to the binding of the protein to its receptor, which was proposed to involve His33 (Baldwin et al. 1991).
Differences in side-chain conformation are observed for residues 1 0 - n , 23, 26, 32-34, 54, 60 and 68 (Fig. 5.7.3). Residues 10-11, 54, 60 and 68 have large side-chain B-factors, and are also found to be disordered in the NMR structure (residues 11, 60 and 68) or contact other protein molecules in the crystal lattice (residues 10 and 54). Residues 23 and 26 are in the first /?-strand and thus in the