HAL Id: hal-01008066
https://hal.archives-ouvertes.fr/hal-01008066
Submitted on 31 Oct 2018HAL is a multi-disciplinary open access
archive for the deposit and dissemination of sci-entific research documents, whether they are pub-lished or not. The documents may come from teaching and research institutions in France or abroad, or from public or private research centers.
L’archive ouverte pluridisciplinaire HAL, est destinée au dépôt et à la diffusion de documents scientifiques de niveau recherche, publiés ou non, émanant des établissements d’enseignement et de recherche français ou étrangers, des laboratoires publics ou privés.
Determining Ti-17 β-phase Single-Crystal Elasticity
Constants through X-Ray Diffraction and inverse scale
transition model
Sylvain Fréour, Emmanuel Lacoste, Manuel Francois, Ronald Guillén
To cite this version:
Sylvain Fréour, Emmanuel Lacoste, Manuel Francois, Ronald Guillén. Determining Ti-17 β-phase Single-Crystal Elasticity Constants through X-Ray Diffraction and inverse scale transition model. 8th European Conference on Residual Stresses (ECRS8), 2010, Riva del Garda, Italy. �10.4028/www.scientific.net/MSF.681.97�. �hal-01008066�
Determining Ti-17 β-phase Single-Crystal Elasticity Constants through
X-Ray Diffraction and inverse scale transition model
! " # $ ! $ !$ # % &' '( ) *# )+ ,- ,, %-- $ . ! / 0 # !$ % (1 # 2 3 2 4#525256 ! )+ -%- -- - 2 ! 7 58 9 58 5 9 58 8 58 53 9 58 Keywords: 3 ! ! : ! ; ; 3 7 3 3 3 ; 5
Abstract. The scope of this work is the determination of single-crystals elastic constants (SEC)
from X-ray diffraction lattice strains measurements performed on multi-phase polycrystals submitted to mechanical load through a bending device. An explicit three scales inverse self-consistent model is developed in order to express the SEC of a cubic phase, embedded in a multi-phase polycrystal, as a function of its X-ray Elasticity Constants. Finally, it is applied to a two-phases (α+β) titanium based alloy (Ti-17), in order to estimate Ti-17 β-phase unknown SEC. The purpose of the present work is to account the proper microstructure of the material. In particular, the morphologic texture of Ti-17 α-phase, i.e. the relative disorientation of the needle-shaped grains constituting this phase, is considered owing to the so-called Generalized Self-Consistent model.
Introduction
The knowledge of Single-crystal Elasticity Constants (SEC) is important in the field of engineering applications of materials. Actually, it is necessary to predict the micro-mechanical behaviour of polycrystalline materials, such as their X-Ray Elasticity Constants (XEC). SEC characterization through the classical methods, such as analyzing the ultrasonic waves velocities [1], usually requires millimetre sized single-crystals. However, many materials are difficult to obtain in an appropriate single-crystal form. It is the case of numerous multi-phases alloys such as (α+β)titanium alloys. In these circumstances, the traditional SEC determination methods are no more suitable.
Owing to X-ray diffraction (XRD) techniques, SEC can be evaluated from the mechanical macroscopic stiffness and XEC measured on polycrystals. The required procedure was historically introduced for single-phase polycrystals [2]: experimental XEC are fitted using a multiscale approach, such as Kröner’s model [3]. The method was firstly applied to cubic polycrystals [4] and then, extended to hexagonal single phases [5]. The last reference features a geometric sets average mathematical framework instead of the traditional arithmetic mean, classically used for achieving multiscale modelling. Discussions about the consequences of such a choice can be read in [6]. In the case that a multiphase polycrystal is characterized, the interphase elastic interactions which occur should properly be taken into account for an accurate estimation of the SEC from the experimental study of such materials [7, 8]. A method has recently been proposed to deal with the question of SEC determination from measurements performed on multiphase materials [9]. In the same reference, an application to the determination of Ti-17 β-phase SEC from lattice strains measurements performed on both phases of an (α+β) Ti-17 specimen submitted to controlled applied mechanical loads, in-situ in a diffractometer, was provided. The present work is focused on the question of accounting a more realistic morphologic microstructure. Actually, Ti-17 β-phase is constituted by needle-shaped grains, randomly oriented in the reference frame associated to the
sample. The historical numerical treatment of the experimental data provided in [9] was achieved owing to the traditional Eshelby [10] and Kröner [3] Self-Consistent (EKSC) elastic model (chosen due to the satisfactory results obtained during previous investigations [11-15]). When EKSC model can handle a single grain-morphology, shared by every inclusion constituting the Representative Equivalent Volume (REV) of the material, this theoretical approach fails to represent a morphologic texture featuring various grain shapes and/or a relative disorientation of the morphologies coexisting among the same REV. It was actually numerically shown in [16], that in such a situation, the classical EKSC model does not simultaneously fulfil both the so-called “Hill’s average relations over the mechanical states”, historically established in [17], anymore. The first aim of the paper is thus to develop an inverse scale-transition model enabling to by-pass this problem. In a second part, this new approach will be applied to the practical determination of Ti-17 β-phase SEC from lattice strains measurements performed on both phases of a specimen submitted to controlled applied mechanical loads in-situ in a diffractometer. The results obtained through either the new or the traditional approaches, respectively enabling to account the morphological texture of the material, or neglecting this very microstructural feature, will be compared in this second section of the paper.
On the identification of materials properties through scale-transition models
Introduction. Scale transition models have a long history and rich literature. Among their
applications, their ability to predict the effective behavior of macroscopically homogeneous but microscopically heterogeneous materials is often valued. Numerous papers have actually dealt with the question of estimating the effective stiffness of single-phase [18] and two-phases [8] metallic bulk polycrystals, thin solid films [19], or even metal / organic matrix composites [20], for instance. Scale transition models are also often used for calculating the XEC [8, 21] required for achieving internal stress determination from XRD peak-shifting measurements. Another centre of interest of scale transition models is their ability to provide links between local fields (such as the mechanical states, either strains or stresses, as an example), and their macroscopic counterparts. This information is valuable within multi-physical phenomena such as mechanical states enhanced diffusion [12, 22]. The third driving force behind the extensive use of scale-transition models is for identifying materials properties. The question of determining the multi-scale properties of some constituents of heterogeneous materials has been extensively addressed in the field of materials science, especially for studying polycrystals (like titanium alloys [9, 11, 15], metal matrix composites [13, 14] and iron oxides from the inner core of the Earth [5], for instance).
Accounting a morphologic texture through “self-consistent” scale transition models.
It was shown by many authors, that the application of traditional scale transition models such as Mori-Tanaka estimates or EKSC model to the case of multi-phase materials containing heterogeneities of different shapes or alignments was questionable, since several fundamental relations are not satisfied anymore [23-26]. In order to overcome the theoretical difficulties related to accounting various grain morphologies within the same RVE, Li proposed to add an intermediate level (denoted by the superscript a) between the traditional mesoscopic (i) and macroscopic (I) scales, as displayed on figure 1 [27]. The resulting scale-transition relations respectively write:
a i i T εεεε εεεε = : , and a i 1 I T εεεε εεεε = − : , (1)
where ε ε ε ε stands for the strains, whereas T denotes the intermediate to mesoscopic strain localization tensor. The square brackets < > represent the volume average. Within the context of Eshelby-Kröner
model, T satisfies i
[
Ii(
i I)
]
1I C c E
T = : − + − , where ci and CI are respectively the mesoscopic and
the macroscopic stiffness tensors. I represents the fourth order identity tensor, and Ii
E is the
and the Homogeneous Equivalent Medium (HEM) [28]. Furthermore, specific attention must be paid to the fact that the calculation of the Morris tensor must be made with the stiffness tensor CI
dropped in the coordinate system Ri, attached to the main axes of the ellipsoidal inclusion. According to Eq. 1, the mesoscopic to macroscopic scale transition relation becomes:
I 1 i i i T T εεεε εεεε = : − : (2)
As a consequence, the strain localization tensor Ai, traditionally enabling to express the mesoscopic
strains from their macroscopic counterparts, is defined by i i i 1
T T
A = : − . The homogenization
relation enabling to find the macroscopic stiffness CI from the mesoscopic stiffnesses ci satisfies:
1 i i i I c T T C = : : − (3)
Eq. 1 to Eq. 3 are the fundamental relations of the Generalized Self-Consistent (GSC) model. It should be highlighted, that this model corresponds to a “normalization” of the EKSC model, where actually TEKSC=AEKSC, since the intermediate medium and the macroscopic scale are merged.
Characterization of Ti-17 β-phase SEC through GSC model
Introduction. Explicit forms for the XEC of a cubic phase embedded in a macroscopically
quasi-isotropic multi-phase material were demonstrated from the traditional EKSC model in [29]. The model can be inverted in order to express the SEC of the diffracting cubic phase whose mesoscopic stiffness tensor components (c11β ,c12β andcβ44) satisfy analytical relations already presented in [9]. Application of those analytical relations requires the knowledge of: i) the macroscopic elasticity constants of the multi-phase material (C11I andC12I ), ii) β−phase pseudo-macroscopic elasticity
constants (C11β andCβ12) and iii) XEC of the analyzed phase for a single {hkl} reflection.
In need of the GSC model: Ti-17 morphologic texture. Ti-17 is an (α+β) titanium alloy
containing volume fractions fα and fβ of the phases, being equal to fβ= 30 % and fα= 70 %,
respectively. According to the micrographs published in [9], the structure of the studied Ti-17 polycrystal consists of acicular α (needle-shaped crystallites) mixed to slightly equiaxed prior β grains, as shown on figure 2. According to figure 2, the morphologic microstructure exhibited by
Ti-Macroscopic scale I
Figure 1: Introducing an intermediate medium (a) between the macroscopic scale (I) and the mesoscopic scale (i), for modelling multi-phase polycrystals presenting a morphologic texture.
Figure 2: The morphologic texture of Ti-17 two-phase polycrystal featuring disoriented needle-shaped α-Ti crystallites and equiaxed β-Ti grains.
β equiaxed grains α platelets Intermediate medium a i i i i i i
17 α-phase cannot be properly taken into account through the traditional EKSC model. The GSC model, however, was specifically built in order to model such a material.
Macroscopic elasticity constants of Τ Τ Τ Τi-17. In order to determine the XEC required for SEC
calculation according to [9] Ti-17 macroscopic and pseudo-macroscopic elastic constants are necessary. The macroscopic characterization has been described in [11] (see Table 1), whereas determining Ti-17 β-phase average properties requires the use of an inverse multiscale model.
Identification of Ti-17 average (pseudo-macroscopic properties) through inverse GSC model.
Ti-17 β-phase crystallites can be represented by spherical grains. Thus, only the relative disorientation between α-Ti needles should be represented at the mesoscopic scale. The average pseudo-macroscopic behaviour Cβ of Ti-17 β-phase results from an inversion of Eq. 3:
(
) (
)
1 i 1 i I T T c T T C C = − − − β ββ β α α α α α α α α α α α α β ββ β β ββ β α αα α β ββ β , m c m c β α , β : : ff θ ,θ : θ ,θ : f 1 (4)Where θ =c
{
θ1c,θc2,θ3c}
and θ =m{
θ1m,θm2 ,θm3}
stands for the Euler angles required for representing the disorientation of the single-crystal crystalline structure / morphologic misalignment of the needle-shaped grains, with respect to the sample reference frame. The lengths of the principal axis of the ellipsoid representing the needles were taken equal to a1 = 100, a2 = 1 and a3 = 1 (arbitraryunits). 20,000 α-Ti17 inclusions with random values of θcand θm were considered for constituting the REV of the material. The resulting average properties of β-Ti17, deduced from Eq. 4 are displayed in Table 1. According to Table 1, accounting the morphologic texture of Ti-17 α−phase results in a slight softening of the predicted elastic behavior of the second phase.
C11 [GPa] C12 [GPa] Y [GPa] ν
Ti-17 [9] 169.4 87.4 110.0 0.340
Ti-17 β-phase (GSC model -present work) 180.3 108.5 98,8 0.376
Ti-17 β-phase (EKSC model - [9]) 183.0 111.0 99.3 0.377
Table 1: macroscopic and β-phase pseudo-macroscopic elastic properties of Ti-17. Comparison between the values predicted by the GSC model and EKSC model. Y and ν respectively stand for Young’s modulus and Poisson’s ratio. Ti-17 ββββ-phase XEC calculation. X-Ray analysis of {310}β and {21.3}α lattice strains on a Ti-17
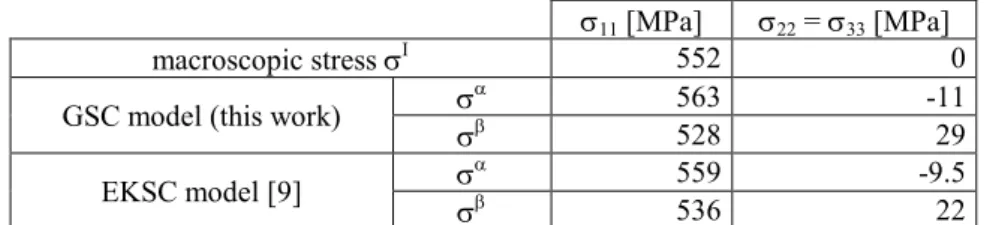
polycrystal (1 mm thick plate) submitted, in-situ, to applied stresses through a cylindrical bending device which radius is R=99.5 mm, was achieved in [9]. The longitudinal macroscopic stress yields biaxial pseudo-macroscopic stresses, the components of which are given in Table 2: accounting the morphologic texture of Ti-17 α-phase affects the stresses experienced by the phases.
σ11 [MPa] σ22 = σ33 [MPa]
macroscopic stress σΙ 552 0
GSC model (this work) σσαβ 563 528 -11 29
EKSC model [9] σσαβ 559 536 -9.5 22
Table 2: Predicted pseudo-macroscopic stresses due to the applied macroscopic stresses in the bended Ti-17 plate. Comparison between the GSC model and the classical EKSC model.
The macroscopic applied stress being uniaxial along longitudinal axis x1, the resulting measured
strain in α-phase for a pseudo-macroscopically isotropic sample, is given in [7]:
+ + + + + − − = S σ σ S Tr σα,A Tr σα,R 2 1 ψ sin σ σ σ σ S 2 1 εαψ α2 11α,A 11α,R 33α,A 33α,R 2 2α 33α,A 33α,R 1α (5)
Where the exponents A and R respectively denote the Applied and Residual stresses in the considered α-phase (a similar equation is obtained for β-phase). The measurement without applied stress yields the strains due to residual stresses only. That condition enables XEC determination from the subtraction of the lattice strains measured under and without applied load:
(
=)
−(
→∞)
=εαψ R 99.5 εαψ R α ψ ∆ε = sα.sin2ψ+iα = + + − α,A σ Tr α 1 S A α, 33 σ α 2 S 2 1 ψ 2 sin A α, 33 σ A α, 11 σ α 2 S 2 1 (6)The XEC deduced from the experimental results published in [9], through the pseudo-macroscopic stresses listed in table 2 are: ½ S2{21.3}α = 12.05 10-6/MPa; ½S2{310}β = 14.97 10-6/MPa, according to the GSC model, whereas the traditional EKSC model gives :
½ S2{21.3}α = 11.72 10-6/MPa; ½ S2{310}β = 14.56 10-6/MPa.
Ti-17 β-phase SEC calculation and discussion. The results obtained for Ti-17 β-phase XEC was
reported in the analytical relations already presented in [9], accounting for the macroscopic and pseudo-macroscopic elastic constants listed in Table 1. Numerical computations yield the values given in Table 3, where Ti-17 β-phase SEC obtained through either the GSC model or the EKSC model, have been compared to Ti-40Nb (100 % β) mesoscopic elastic properties.
c11 [GPa] c12 [GPa] c44 [GPa] Ac
Ti-17 (β) GSC model 167 115 44 1.7
Ti-17 (β) EKSC model [9] 174 116 41 1.4
Ti-40Nb (β) [30] 156.5 111.6 39.6 1.76
Table 3: SEC and anisotropy elastic coefficient Ac of Ti-17 β-phase. Comparison to Ti-40Nb (100 % β) SEC.
The deviation observed in the SEC of the two materials is consistent with the measurements of β−Ti macroscopic elasticity constants in various (100 % β) alloys [31, 32]. Contrary to α-phase elastic properties, which remain almost constant in two-phases Titanium based alloys, due to the small concentration of alloying elements in this phase, β-Ti SEC and its related pseudo-macroscopic elasticity constants vary from one alloy to the other. This is due to the occurrence of very strong variations in the nature and concentration of β-stabilizers elements. Nevertheless, accounting the morphologic texture of Ti-17 α-phase through the GSC model yields slight discrepancies from the SEC previously determined using the classical EKSC model.
Conclusion
Inverse scale transition models, involving explicit simplified forms, were used in order to handle the question of determining the unknown single-crystal elasticity constants of Ti-17 β-phase embedded in an (α+β) Ti-17 alloy. The present work features, for the first time in the context of SEC identification from X-Ray diffraction analyses performed on polycrystals, the so-called Generalized Self-Consistent model. Contrary to the classical Eshelby-Kröner Self-Consistent model, the recently proposed generalized version of the model enables accounting a morphologic texture within the Representative Elementary Volume. A more realistic morphological texture for both Ti-17 phases was taken into account, owing to the generalized self-consistent model: i) Ti-17 β-phase was assumed to be constituted by an assembly of spherical grains, whereas ii) needle-shaped crystallites, randomly oriented in the coordinate system associated to the specimen, were considered for Ti-17 α-phase. A comparison between the numerical results, obtained at each step of the experimental data treatment method, through either the classical EKSC model or the GSC model was provided. Both scale-transition models yield to very close values for either the pseudo-macroscopic properties of Ti-17 β-phase, the concentration of the macroscopic stress state, imposed to the sample, at the pseudo-macroscopic scale, the X-Ray Elasticity constants ½ S2{21.3}α and ; ½ S2{310}β) and the researched Ti-17 β-phase SEC. This study demonstrates, at least numerically, that a random
morphologic texture can be neglected without much consequence, within the context of modelling the multi-scale behaviour of heterogeneous materials made of quasi-isotropic elementary inclusions.
References
[1] J.F. Nye: , (Oxford, 1957).
[2] V. Hauk and H. Kockelmann: Z. Metallkde. Vol. 70 (1979), p. 500-502. [3] E. Kröner: Z. Physik. Vol. 151 (1958), 504-518.
[4] M. Hayakawa, S. Imai and M. Oka: J. Appl. Cryst., Vol. 18 (1985), p. 513-518.
[5] S. Matthies, S. Merkel, H.R. Wenk, R.J. Hemley and H. Mao: Earth and Planetary Science Letters Vol. 194 (2001), p. 210-212.
[6] S. Fréour, F. Jacquemin and R. Guillén: J. Mater. Sci. Vol. 42 (2007), p. 7537-7543.
[7] V. Hauk: , (Elsevier
Science, 1997).
[8] S. Fréour, D. Gloaguen, M. François and R. Guillén: Phys. Status Solidi (b) Vol. 239 (2003), p. 297-309.
[9] S. Fréour, D. Gloaguen, M. François, A. Perronnet and R. Guillén: Journal of Applied Crystallography Vol. 38 (2005), p. 30-37.
[10] J.D. Eshelby: Proc. Roy. Soc. (London) A Vol. 241 (1957), p. 376-396.
[11] S. Fréour, D. Gloaguen, M. François, R. Guillén, E. Girard and J. Bouillo: Mater. Sci. Forum. Vol. 404-407 (2002), p. 723-728.
[12] G. Youssef, S. Fréour, F. Jacquemin: Mech. Compos. Mater. Vol. 45(4) (2009), p. 369-380. [13] S. Fréour, D. Gloaguen, M. François and R. Guillén: Mater. Sci. Forum. Vol. 426-432 (2003),
p. 2083-2088.
[14] S. Fréour, D. Gloaguen, M. François, R. Guillén: (2004). Phys. Status Solidi a Vol. 201, p. 59. [15] S. Fréour, D. Gloaguen, M. François, R. Guillén: (2006). Scripta Mater. Vol. 54, p. 1475-1478. [16] E. Lacoste, S. Fréour and F. Jacquemin: Mechanics of Materials Vol. 42 (2010), pp. 218-226. [17] R. Hill: Journal of the Mechanics and Physics of Solids Vol. 15 (1967), pp. 79-95.
[18] U.F. Kocks, C.N. Tomé and H.R. Wenk:
, (Cambridge University Press, 1998). [19] G. Youssef, S. Fréour and F. Jacquemin: J. Compos. Mater. Vol. 43 (2009), p. 1621-1637. [20] U. Welzel and S. Fréour: Philosophical Magazine Vol. 87 (2007), p. 3921-3943.
[22] S. Fréour, F. Jacquemin and R. Guillén: J. Reinf. Plast. Comp. Vol. 25 (2006), p. 1039-1053. [23] Y. Benveniste, G.J. Dvorak and T. Chen: J. Mech. Phys. Solids Vol. 39 (1991), pp. 927-946. [24] A.N. Norris: J. Appl. Mech. Vol. 56 (1989), pp. 83-88.
[25] Y.P. Qiu and G.J. Weng: International Journal of Engineering Science Vol 28 (1990), pp 1121-1137.
[26] M. Ferrari: Mechanics of Materials Vol.11 (1991), pp. 251-256. [27] J.Y. Li: Mechanics of Materials Vol. 31 (1999), pp 149-159.
[28] R. Morris: International Journal of Engineering Science Vol 8 (1970), pp. 49–61.
[29] S. Fréour: ! ! ! ! , (Editions
Universitaires Européennes 2010), ISBN 978-613-1-50485-3.
[30] C.N. Reid, J.L. Routbort and R.A. Maynard: J. Appl. Phys. Vol. 44 (1973), p. 1398-1399. [31] D. Kuroda, M. Niinomi, M. Morinaga, Y. Kato and T. Yashiro: Mat. Sci. Eng. A Vol. 243
(1998), p. 244-249.