Nephrology
Dialysis
Transplantation
Registry Report
Demography of Dialysis and Transplantation in Europe, 1984
Report from the European Dialysis and Transplant Association Registry*
*Members of the Registration CommitteeM. Broyer F. P. Brunner**
Hopital Necker Enfants Malades, Paris, France H. Brynger W. Fassbinder P. J. Guillou R. Oules """Chairman
Departement fur Innere Medizin, Universitat Basel, Switzerland
Department of Surgery I, Sahlgrenska Sjukhuset, Goteborg, Sweden
Klinikum der Johann Wolfgang
Goethe-Universitat, Frankfurt am Main, Federal Republic of Germany
University Department of Surgery, St James's Hospital, Leeds, United Kingdom Centre Hospitalier Regional et
Universitaire de Nimes, France
G. Rizzoni N. H. Selwood A. J. Wing
Director
S. Challah
Clinica Pediatrica dell'Universita, Ospedale Civile di Padova, Italy UK Transplant Service, Bristol, United Kingdom
St Thomas' Hospital, London, United Kingdom
St Thomas' Hospital. London. United Kingdom
Assistant to Chairman
S. R. Dykes St Thomas' Hospital, London, United Kingdom
Abstract. The demography of renal replacement therapy up until the close of 1984 in Europe is presented, based on return of individual patient questionnaires to the EDTA Registry. These were completed by 84.7% of known centres in 33 countries. Of 187 267 individually registered patients, 102 276 were known to be alive on defined forms of renal replacement therapy on 31 December 1984. The stock of patients alive on treatment by dialysis and transplantation in Europe continued to grow and exceeded 200 per million population in 14 European countries at the end of 1984. During the same year, 21 198 new patients were accepted for treatment in Europe, and crude acceptance rates for new patients exceeded 60 per million population in four coun-tries. Acceptance rates for elderly patients continued to increase and age specific acceptance rates for males aged 65 and over exceeded 100 per million population in 12 coun-tries. A total of 6802 renal transplants were reported during
1984. Regrafting accounted for a higher proportion of transplants in Nordic countries and in the United King-dom, compared with other nations. During 1984 the total number of transplants reported to the Registry passed 50 000. The distribution of primary renal disease amongst adult patients commencing treatment in 1984 is presented. Amongst elderly patients commencing treatment, a strikingly high proportion have chronic renal failure of uncertain aetiology. Finally, causes of death have been analysed amongst adult patients dying during 1984, show-ing myocardial ischaemia and infarction to be the leadshow-ing cause of mortality.
Key words: Chronic renal failure; Haemodialysis; Con-tinuous ambulatory peritoneal dialysis; Transplantation; Demography
Correspondence and offprint requests to: Dr F. P. Brunner, European Dialy-sis and Transplant Association Registry, St Thomas' Hospital, London SE1 7EH, England.
1
1986 European Dialysis and Transplant Association-European Renal Association
Introduction: timing of this report
This is the first report prepared by the Registry of the European Dialysis and Transplant Association—European Renal Association (EDTA Registry) for the new journal of the Association. In the past, a series of 15 Combined Reports on Regular Dialysis and Transplantation in Europe have been published in the Proceedings of the Association, the final one appearing in 1985 [1]. This Report is based entirely on analyses of individual patient question-naires reporting treatment up till 31 December 1984. These analyses were carried out at the time of the mailing of the 1985 patient questionnaires, when the Registry's files are in their best form for the year.
Methods: the Registry data base
The Registry collects its data from two sources, a centre questionnaire and an individual patient questionnaire. New centres are notified by their directors, or by the National Keymen, who accept responsibility for maintaining a com-plete list of units and trying to ensure as full a return of questionnaires as possible. The contents of the centre ques-tionnaire vary slightly from year to year, but it is designed to obtain summary information on numbers of patients treated during the year, and on centre practices. An indivi-dual patient questionnaire is completed for every subject accepted for renal replacement therapy. The information requested includes personal patient details (name, sex and date of birth), details of primary renal disease leading to end-stage renal failure, dates and types of treatment, and where appropriate, graft details, dialysis schedules, malig-nancies diagnosed and causes of death. The primary renal diseases and causes of death are reported by number codes given in an instruction sheet which accompanies the patient questionnaires. All patient questionnaires are printed in English, but the instruction sheets are available in five lan-guages. Once a patient has been reported to the Registry, the information provided is preprinted on the patient questionnaire, so the responding centre need only update the record.
Demographic data on the number of patients accepted for treatment and total numbers alive on therapy are avail-able from both the centre and individual patient question-naires. The Registry publishes figures from both sources, and there may be differences. This is due not only to incom-plete registration of individual patients, but also to double reporting through the centre questionnaires where more than one centre may claim responsibility for the care of individual patients.
The data base is maintained on the Registry's dedicated computer (VAX 11/750), and flexible analytical pro-grammes have been developed in order to perform regular demographic analyses and particular research projects.
Results: demographic statistics
The completeness of returns for the 1984 patient question-naire are shown in Table 1. This shows the number of known centres in each of the 33 countries reporting to the Registry and the proportion which returned 1984 patient questionnaires. Questionnaires were received from 1613 or 84.7% of centres in 33 countries. Complete returns were received from 11 countries and from over 90% of known centres in 21 countries. The proportion of responding centres was less than 75% in only five countries. The response rate was similar to that in previous years (2).
Table 2 shows the stock of patients of all ages known to be alive on 31 December 1984 according to method of treatment. Figures are given by country and, so that programmes in various countries may be compared, the total of all live patients is expressed per million population. The stock of patients alive on treatment varied greatly from
Table 1. Summary of centres known to the Registry in 1984 in individual countries. Absolute numbers, numbers per million population (PMP) and the proportion (%) returning patient questionnaires are given
Country Algeria Austria Belgium Bulgaria Cyprus Czechoslovakia Denmark Egypt
Fed. Rep. Germany Finland
France
German Dem. Rep. Greece Hungary Iceland Ireland Israel Italy Lebanon Libya Luxembourg Morocco Netherlands Norway Poland Portugal Spain Sweden Switzerland Tunisia Turkey United Kingdom Yugoslavia Total Registry Population in millions 18.3 7.5 9.8 8.9 0.5 15.3 5.1 41.0 61.7 4.8 53.7 16.7 9.7 10.7 0.2 3.3 3.9 56.7 2.7 2.9 0.4 20.9 14.2 4.1 35.6 9.9 37.1 8.3 6.4 6.2 44.2 56.3 22.3 599.3 Known centres 4 26 59 32 2 25 11 31 325 26 212 54 52 12 1 5 26 387 7 3 5 1 48 18 51 39 198 33 36 10 16 65 84 1904 Known centres, PMP 0.2 3.5 6.0 3.6 4.0 1.6 2.2 0.8 5.3 5.4 4.0 3.2 5.4 1.1 5.0 1.5 6.7 6.8 2.6 1.0 12.5 0.1 3.4 4.4 1.4 3.9 5.3 4.0 5.6 1.6 0.4 1.2 3.8 3.3 % Replied 75.0 100.0 91.5 93.8 100.0 100.0 90.9 90.3 87.1 100.0 86.3 98.2 69.2 100.0 100.0 80.0 100.0 68.5 14.3 33.3 100.0 100.0 79.2 94.4 98.0 74.4 93.4 100.0 91.7 100.0 87.5 93.9 81.0 84.7
Table 2. Stock of patients alive on 31 December 1984 in individual countries. Numbers on different forms of renal replacement therapy given together with total per million population
Country Algeria Austria Belgium Bulgaria Cyprus Czechoslovakia Denmark Egypt
Fed. Rep. Germany Finland
France
German Dem. Rep. Greece Hungary Iceland Ireland Israel Italy Lebanon Libya Luxembourg Morocco Netherlands Norway Poland Portugal Spain Sweden Switzerland Tunisia Turkey United Kingdom Yugoslavia Hosp. HD 81 1172 2003 720 95 823 380 754 14 755 245 8892 1426 1184 355 21 155 823 11347 11 50 81 48 1548 224 855 1560 7878 754 826 225 415 1744 2572 Home HD 1 54 107 23 0 2 44 2 177S 3 1807 0 1 0 0 26 46 820 0 0 4 0 126 4 0 0 316 . 99 164 0 1 2006 16 IPD 0 1 6 0 0 9 34 31 186 10 136 4 4 25 0 7 48 139 0 0 0 0 1 3 43 2 91 27 4 1 10 68 8 CAPD 14 18 145 1 0 5 164 10 326 135 813 6 168 8 0 49 132 1057 0 0 0 0 265 20 11 8 596 185 200 17 18 1859 24 With funct. graft 11 406 1120 5 34 254 430 74 3057 583 3868 503 244 122 8 249 276 1585 1 9 7 9 499 639 283 104 1812 1220 604 7 128 5299 205 Total 107 1651 3381 749 129 1093 1052 871 20099 976 15 516 1939 1601 510 29 486 1325 14948 12 59 92 57 2439 890 1192 1674 10 693 2285 1798 250 572 10976 2825 Per million pop. 5.8 220.1 345.0 84.2 258.0 71.4 206.3 21.2 325.8 203.3 288.9 116.1 165.1 47.7 145.0 147.3 339.7 263.6 4.4 20.3 230.0 2.7 171.8 217.1 33.5 169.1 288.2 275.3 280.9 40.3 12.9 195.0 126.7
country to country, but exceeded 250 per million popu-lation in nine nations. The figure was highest in Belgium, where there were 345 patients alive on renal replacement therapy per million population at the end of 1984. The table does not include patients previously reported to the Registry but not updated for 1984.
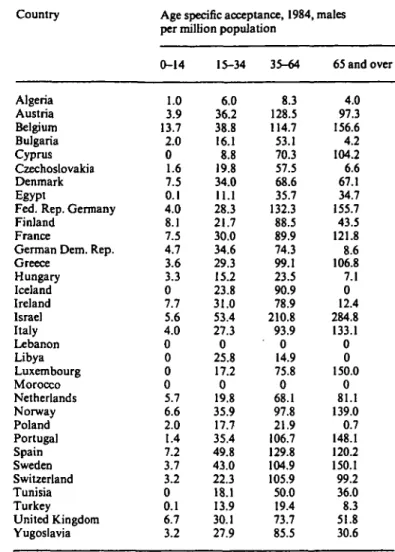
The numbers of new male and female patients accepted for first treatment during 1984 are shown in Table 3, which gives the crude acceptance rate per million population by country. Over 60 new patients per million population were accepted onto treatment during 1984 in Austria, Belgium, the Federal Republic of Germany and Israel. Between 50 and 60 new patients per million population were taken on in Iceland, Norway, Spain and Sweden. The total column of the table includes patients whose sex was not recorded. Acceptance rates for new patients in 1984 are shown separ-ately for males and females in Tables 4 and 5, broken down into four age groups. The take-on rates are expressed as age and sex specific; in other words, calculated in relation to the total number of people in the general population of the corresponding age and sex group. Data on population were
obtained from the WHO Statistics Annual using the most up to date information available for each country. In coun-tries with the highest overall acceptance rates such as Belgium and the Federal Republic of Germany, take-on rates for males increased with age so that the highest acceptance rates were in the 65 and over age group. In these countries, the same pattern was not observed among females. Acceptance rates for women aged 65 and over are similar to those for women aged between 35 and 64 at first treatment. In countries such as the United Kingdom and the German Democratic Republic with an overall accept-ance rate of between 30 and 35 per million population, age specific acceptance rates fell in the 65 and over age group, whether patients were male or female.
Transplantation activity during 1984 is summarised for individual countries in Table 6. This shows grafts according to source, live donor or cadaver, and gives the numbers which were first, second, third or fourth grafts. The table gives the total number of grafts done in each country during 1984 and this will include transplants whose source was unknown. The grafts are given according to the country
Table 3. Numbers of new patients accepted onto renal replacement therapy in 1984 by country. Males and females shown separately. The total
Table 4. Age specific acceptance rate for male patients onto renal replacement therapy in 1984 shown by individual country
per million population (PMP) is also given Country Algeria Austria Belgium Bulgaria Cyprus Czechoslovakia Denmark Egypt
Fed. Rep. Germany Finland
France
German Dem. Rep. Greece Hungary Iceland Ireland Israel Italy Lebanon Libya Luxembourg Morocco Netherlands Norway Poland Portugal Spain Sweden Switzerland Tunisia Turkey United Kingdom Yugoslavia New patients 1984 Male 24 241 354 112 10 193 113 278 2273 100 1433 304 273 75 4 59 182 1573 0 10 9 0 271 128 236 265 1289 301 179 47 190 1149 446 Female 27 215 322 62 9 123 90 124 1833 64 999 237 176 76 6 33 102 1125 0 8 6 0 214 90 159 157 872 193 117 39 110 753 354 Total 51 464 683 175 20 316 205 411 4142 167 2644 544 451 152 10 92 290 2738 0 18 15 0 487 218 395 426 2179 497 300 87 303 1910 808 Acceptance rate PMP 2.8 61.9 69.7 19.7 40.0 20.7 40.2 10.0 67.1 34.8 49.2 32.6 46.5 14.2 50.0 27.9 74.4 48.3 0 6.2 37.5 0 34.3 53.2 11.1 43.0 58.7 59.9 46.9 14.0 6.9 33.9 36.2 Country Algeria Austria Belgium Bulgaria Cyprus Czechoslovakia Denmark Egypt
Fed. Rep. Germany Finland
France
German Dem. Rep. Greece Hungary Iceland Ireland Israel Italy Lebanon Libya Luxembourg Morocco Netherlands Norway Poland Portugal Spain Sweden Switzerland Tunisia Turkey United Kingdom Yugoslavia
Age specific acceptance, 1984, per million population 0-14 1.0 3.9 13.7 2.0 0 1.6 7.5 0.1 4.0 8.1 7.5 4.7 3.6 3.3 0 7.7 5.6 4.0 0 0 0 0 5.7 6.6 2.0 1.4 7.2 3.7 3.2 0 0.1 6.7 3.2 15-34 6.0 36.2 38.8 16.1 8.8 19.8 34.0 11.1 28.3 21.7 30.0 34.6 29.3 15.2 23.8 31.0 53.4 27.3 0 25.8 17.2 0 19.8 35.9 17.7 35.4 49.8 43.0 22.3 18.1 13.9 30.1 27.9 35-64 8.3 128.5 114.7 53.1 70.3 57.5 68.6 35.7 132.3 88.5 89.9 74.3 99.1 23.5 90.9 78.9 210.8 93.9 0 14.9 75.8 0 68.1 97.8 21.9 106.7 129.8 104.9 105.9 50.0 19.4 73.7 85.5 males 65 and over 4.0 97.3 156.6 4.2 104.2 6.6 67.1 34.7 155.7 43.5 121.8 8.6 106.8 7.1 0 12.4 284.8 133.1 0 0 150.0 0 81.1 139.0 0.7 148.1 120.2 150.1 99.2 36.0 8.3 51.8 30.6
where the patient is registered and this does not necessarily correspond to place of grafting. During 1984, no fifth or numerically higher grafts were reported.
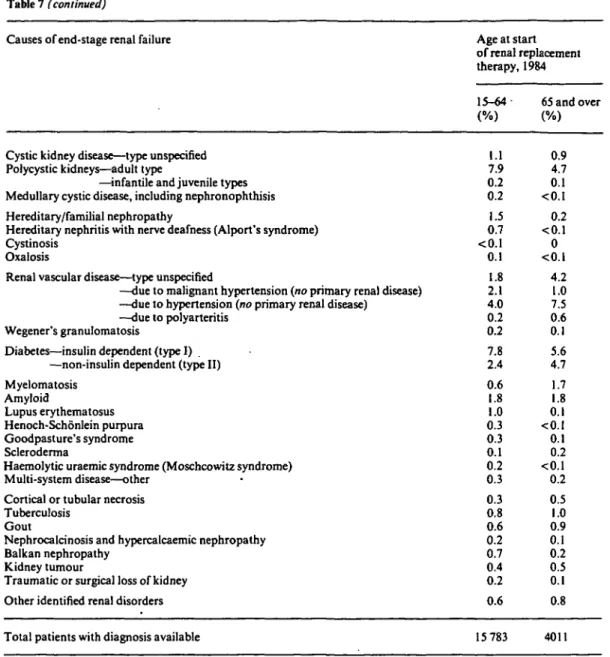
The instruction sheet which accompanies the patient questionnaire affords 55 choices of primary renal disease. Some of these have been amalgamated in Table 7, which shows the proportional distribution of primary renal diseases among patients commencing therapy in 1984 according to age at start of treatment. There were 15 783 patients aged between 15 and 64 at start of therapy in 1984 for whom primary renal disease was provided and an additional 4011 aged 65 and over. In the 15 to 64-year old group glomerulonephritis accounted for 28.3% of primary renal diseases and pyelonephritis/interstitial nephritis for a further 17.1%. Amongst patients aged 65 and over, a striking observation is the proportion (21.1%) of patients with primary renal disease given as chronic renal failure, aetiology uncertain.
In Table 8 the proportional distribution of causes of death amongst patients dying in 1984 is given according to age at death. Information was available on a total of 8612 patients who died aged 15 and over during 1984. The most common single cause of death in the two age groups shown is myocardial ischaemia and infarction, followed by cerebrovascular accident.
Discussion
Completeness of returns to the EDTA Registry
The data given in this paper are entirely based on analyses of the file of individually registered patients. The EDTA Registry now holds 187 267 such records. Of the 1904
Table 5. Age specific acceptance rate for female patients onto renal
replacement therapy in 1984 shown by individual country
Country Algeria Austria Belgium Bulgaria Cyprus Czechoslovakia Denmark Egypt
Fed. Rep. Germany Finland
France
German Dem. Rep. Greece Hungary Iceland Ireland Israel Italy Lebanon Libya Luxembourg Morocco Netherlands Norway Poland Portugal Spain Sweden Switzerland Tunisia Turkey United Kingdom Yugoslavia
Age specific acceptance, 1984, per million population
0-14 1.4 5.4 12.3 1.0 0 0.6 5.9 0.5 4.4 2.1 8.0 6.7 0.9 0.9 33.3 4.0 11.2 4.1 0 0 0 0 6.6 4.6 2.8 5.2 6.7 6.4 6.7 0.8 0.3 4.0 1.1 15-34 4.0 27.6 27.4 10.3 9.3 13.3 14.5 6.1 22.5 14.0 17.3 24.4 22.0 14.5 25.6 22.2 25.1 14.9 0 19.8 17.9 0 12.7 24.8 11.7 23.1 27.9 19.0 12.3 15.5 6.9 12.4 18.7 35-64 12.6 98.2 106.2 28.7 66.4 35.6 72.2 14.6 88.5 57.0 59.3 60.0 55.5 24.8 93.8 41.2 102.0 62.4 0 16.4 44.8 0 48.6 80.0 12.7 • 47.6 88.2 79.2 67.6 37.0 13.2 51.3 66.6 females 65 and over 3.6 62.9 102.6 0 59.3 0 25.5 11.9 92.7 10.9 62.5 2.3 61.7 3.6 76.9 5.1 158.2 77.7 0 0 66.7 0 62.3 53.8 0.9 54.3 54.5 61.9 41.7 10.9 3.1 21.7 20.6
known units in 33 countries, 84% returned patient ques-tionnaires for 1984. In some countries the returns were com-plete and in most they were in excess of 80%. Despite the growing number of units providing dialysis and transplant facilities in Europe, compliance in returning EDTA forms has been maintained.
Trends in renal replacement therapy
At the close of 1984 there were 102 276 patients individually registered alive on defined methods of renal replacement therapy in Europe. This represents an increase of 13.7% compared with 31 December 1983 [1]. Patients alive on hospital haemodialysis had increased by 11.8%, but those
treated on home haemodialysis had fallen by 5.2%. Home haemodialysis appears to have been supplanted by con-tinuous ambulatory peritoneal dialysis (CAPD). Numbers on this form of therapy rose to 6254 in 1984, representing an increase of 23.0%. The stock of patients alive on renal replacement therapy at the close of 1984 exceeded 200 per million population in 14 countries. This treatment figure was surpassed by Austria, Denmark, Finland and Norway for the first time during 1984 (Table 2).
Acceptance rates for new patients varied greatly from country to country during 1984 (Table 3). Acceptance rates were in excess of 60 per million population in four coun-tries. In 16 countries acceptance rates remained below 35 per million population. Overall, 21 198 new patients were accepted for renal replacement therapy in Europe during 1984, with a preponderance of males to females in the ratio 1.4:1.
The variation in acceptance policy between countries is even more striking if age and sex specific acceptance rates are compared (Tables 4, 5). In countries where facilities for treatment of end-stage renal failure are restricted, it is the oldest patients, in other words those aged 65 and over, who are excluded from treatment. Even in nations with high overall acceptance rates, there is still a discrepancy between acceptance rates for elderly males and elderly females. Take-on rate for males aged 65 and over was 150 per mil-lion population or more in Belgium, the Federal Republic of Germany, Israel, Luxembourg and Sweden. By compari-son the age specific acceptance rate exceeded 150 per million population for females in only one country.
The number of individually recorded renal transplants performed in 1984 was 6802 (Table 6). Proportions of live donors and of regrafting varied between countries. There were high proportions of live donors in Egypt, Greece, Ireland, Israel, Norway and Sweden, but low proportions in Denmark, Switzerland and Eastern European countries. Regrafting accounted for more of the grafts in Nordic coun-tries and in the United Kingdom than in other nations where fewer patients were transplanted. Patient question-naires recorded 50 655 renal transplants performed in Europe by 31 December 1984.
Analysis of primary renal diseases leading to end-stage renal failure amongst adult patients commencing treatment in 1984 showed that glomerulonephritis is still the most common diagnosis. Amongst elderly patients, the aetiology of chronic renal failure is unknown in one-fifth of cases (Table 7). The increase in acceptance rates for elderly patients has meant that diabetes, vascular and hypertensive disease account for a greater proportion of primary renal diseases diagnosed as leading to end-stage renal failure. Cardiovascular disease remains the leading cause of death amongst adult patients on renal replacement therapy (Table 8). Among patients aged 15-64 at time of death, cardiac causes accounted for 40% of mortality. In the 65 and over age group the figure was similar, at 37.6%.
Table 6. Grafts reported to the Registry in 1984 by individual country. Grafts are shown according to source and number in overall graft sequence Country Algeria Austria Belgium Bulgaria Cyprus Czechoslovakia Denmark Egypt
Fed. Rep. Germany Finland
France
German Dem. Rep. Greece Hungary Iceland Ireland Israel Italy Lebanon Libya Luxembourg Morocco Netherlands Norway Poland Portugal Spain Sweden Switzerland Tunisia Turkey United Kingdom Yugoslavia Live donor 1st 0 3 36 0 7 1 6 40 34 9 30 4 15 1 0 16 17 25 0 4 I 0 3 51 1 1 50 60 2 1 13 89 35 2nd 0 0 0 0 0 0 1 1 2 1 4 1 0 0 0 2 0 0 0 0 0 0 2 4 0 0 2 2 0 0 0 10 1 3rd 0 0 0 0 0 0 0 0 0 0 1 0 0 0 0 1 0 0 0 0 0 0 0 1 0 0 0 0 0 0 0 1 0 4th 0 0 0 0 0 0 0 0 0 0 0 0 0 0 0 0 0 0 0 0 0 0 0 0 0 0 0 0 0 0 0 0 0 Total 0 3 36 0 7 1 7 41 36 10 35 5 15 1 0 19 17 25 0 4 1 0 5 56 1 1 52 62 2 1 13 100 36 Cadaver 1st 3 134 165 0 5 101 90 0 777 78 772 145 15 44 0 50 57 338 0 0 2 6 90 74 117 49 627 179 103 2 3 959 16 2nd 0 19 27 0 0 16 26 0 117 6 65 8 1 8 0 8 5 32 0 0 0 0 12 13 7 2 32 35 12 0 0 205 3 3rd 0 4 1 0 0 0 8 0 11 0 1 0 0 0 0 0 0 2 0 0 0 0 1 2 0 0 3 7 2 0 0 40 0 4th 0 1 0 0 0 0 1 0 1 0 0 0 0 0 0 0 0 0 0 0 0 0 0 1 0 0 0 0 0 0 0 4 0 Total 3 158 193 0 5 117 125 0 906 84 838 153 16 52 0 58 62 372 0 0 2 6 103 90 124 51 662 221 117 2 3 1208 19 All grafts 3 165 233 0 12 122 139 43 1010 99 981 174 36 59 0 78 88 413 0 4 3 6 121 154 128 56 771 294 161 3 17 1369 60
Table 7. Proportional distribution (%) of causes of end-stage renal failure in patients starting renal replacement therapy in 1984, according to age at start of therapy
Causes of end-stage renal failure
Chronic renal failure, aetiology uncertain Glomerulonephritis—histologically not examined
—histologically examined
Pyelonephritis/interstitial nephritis—cause not specified
—associated with neurogenic bladder —due to congenital obstructive uropathy
with or without vesico-ureteric reflux —due to acquired obstructive uropathy —due to vesico-ureteric reflux without
obstruction —due to urolithiasis —due to other cause
Nephropathy—caused by drugs or nephrotoxic agents—cause not specified —due to analgesic drugs
Age at start of renal replacement therapy, 1984 (%) 15-64 12.8 17.1 11.2 9.1 0.5 1.2 1.4 1.6 2.3 1.0 0.5 2.8 65 and over 21.1 10.6 4.2 12.6 0.4 3.5 0.3 3.6 1.1 0.7
Demography of Dialysis and Transplantation in Europe, 1984 Table 7 (continued)
Causes of end-stage renal failure
Cystic kidney disease—type unspecified Polycystic kidneys—adult type
—infantile and juvenile types Medullary cystic disease, including nephronophthisis Hereditary/familial nephropathy
Hereditary nephritis with nerve deafness (Alport's syndrome) Cystinosis
Oxalosis
Renal vascular disease—type unspecified
—due to malignant hypertension (no primary renal disease) —due to hypertension (no primary renal disease)
—due to polyarteritis Wegener's granulomatosis
Diabetes—insulin dependent (type I) . —non-insulin dependent (type II) Myelomatosis Amyloid Lupus erythematosus Henoch-Schonlein purpura Goodpasture's syndrome Scleroderma
Haemolytic uraemic syndrome (Moschcowitz syndrome) Multi-system disease—other
Cortical or tubular necrosis Tuberculosis
Gout
Nephrocalcinosis and hypercalcaemic nephropathy Balkan nephropathy
Kidney tumour
Traumatic or surgical loss of kidney Other identified renal disorders
Age at start of renal replacement therapy, 198' 15-64- l (%) 1 1.1 7.9 0.2 0.2 1.5 0.7 <0.1 0.1 1.8 2.1 4.0 0.2 0.2 7.8 2.4 0.6 1.8 1.0 0.3 0.3 0.1 0.2 0.3 0.3 0.8 0.6 0.2 0.7 0.4 0.2 t 55 and over 0.9 4.7 0.1 <0.1 0.2 <0.1 0 <0.1 4.2 1.0 7.5 0.6 0.1 5.6 4.7 1.7 1.8 0.1 cO.l 0.1 0.2 <0.1 0.2 0.5 1.0 0.9 0.1 0.2 0.5 0.1 0.6 0.8
Total patients with diagnosis available 15 783 4011
Table 8. Proportional distribution (%) of causes ofdeath in patients dying in 1984, according to age at death
Causes ofdeath on renal replacement therapy Age at death 1984
15-64 65 and over
Cause ofdeath uncertain/not determined/unknown Cardiac: Myocardial ischaemia and infarction
Hyperkalaemia
Haemorrhagic pericarditis Other causes of cardiac failure Cardiac arrest, cause unknown Hypertensive cardiac failure Hypokalaemia Fluid overload 6.0 7.1 13.3 2.7 1.1 7.2 9.9 3.5 0.3 2.2 13.6 1.3 0.3 9.4 10.1 1.9 <0.1
8 Report from the EDTA Registry Table 8 (continued)
Causes of death on renal replacement therapy Age at death 1984
15-64 65 and over
Vascular: Pulmonary embolus Cerebrovascular accident Haemorrhage from graft site
Haemorrhage from vascular access or dialysis circuit Haemorrhage from ruptured vascular aneurysm Haemorrhage from surgery
Other haemorrhage
Infection: Pulmonary infection (bacterial) Pulmonary infection (viral) Pulmonary infection (fungal) Infections elsewhere Septicaemia Tuberculosis
Generalised viral infection Peritonitis
Liver Disease: Viral hepatitis Drug toxicity Cirrhosis—not viral Cystic liver disease
Liver failure—cause unknown Gastro-intestinal: Gastro-intestinal haemorrhage
Mesenteric infarction Pancreatitis
Sclerosing (or adhesive) peritoneal disease Perforation of peptic ulcer
Perforation of colon
Social: Patient refused further treatment Suicide
Therapy ceased for any other reason Miscellaneous: Uraemia caused by graft failure
Bone marrow depression Cachexia
Malignant disease Dementia
Accident: Accident related to treatment Accident unrelated to treatment Other identified cause of death
1.2 10.4 0.2 0.2 0.8 0.3 0.7 3.0 0.5 0.3 0.8 8.1 0.6 0.4 1.7 1.2 0.1 0.8 0.1 0.5 2.1 0.7 0.9 0.4 0.2 0.5 0.7 0.7 0.7 0.3 0.1 2.9 5.4 1.1 0.4 0.8 1.0 11.7 <0.1 0.3 0.6 <0.1 0.3 3.3 0.4 0.2 0.4 4.5 0.4 <0.1 1.8 0.5 0.1 0.8 <0.1 0.1 1.7 0.8 0.2 0.3 0.3 0.6 1.8 0.4 1.5 0 0.3 9.3 6.2 1.7 0.2 0.5 4.0 3.1
Total patients with known cause of death 5917 2695
Acknowledgements. This work was supported by grants from the
Govern-ments or National Societies of Nephrology of Austria, Belgium, Bulgaria, Cyprus, Czechoslovakia, Denmark, Egypt, the Federal Republic of Germany, France, the German Democratic Republic, Greece, Iceland, Ireland, Israel, Luxembourg, the Netherlands, Norway, Sweden, Switzerland, Tunisia and the United Kingdom.
Grants were also made by Asahi Medical GmbH, B. Braun Melsungen AG, Bellco S.p.A., Cobe Laboratories, Inc., CD Medical International, Ltd., Enka AG, Fresenius AG, Gambro AB, Hospal, Ltd., Sandoz AG, Sorin Biomedica S.p.A. and Travenol Laboratories, Ltd.
We acknowledge the co-operation of UK Transplant Service, Bristol, United Kingdom.
We thank those doctors and their staff who have completed question-naires. Without their collaboration this Report could not have been prepared. •
References
1. Brunner FP, Broyer M, Brynger H et al. Combined report on regular dialysis and transplantation in Europe, XV, 1984. Proc Eur Dial
Transplant Assoc 1985; 22: 3-53
2. Kramer P, Broyer M, Brunner FP et al. Combined report on regular dialysis and transplantation in Europe, XIV, 1983. Proc Eur Dial