Assessment of iodine nutrition in populations: past, present,
and future
Michael B Zimmermann and Maria Andersson
Iodine status has been historically assessed by palpation of the thyroid and reported
as goiter rates. Goiter is a functional biomarker that can be applied to both
individuals and populations, but it is subjective. Iodine status is now assessed using
an objective biomarker of exposure, i.e., urinary iodine concentrations (UICs) in spot
samples and comparison of the median UIC to UIC cut-offs to categorize population
status. This has improved standardization, but inappropriate use of the crude
proportion of UICs below the cut-off level of 100
mg/L to estimate the number of
iodine-deficient children has led to an overestimation of the prevalence of iodine
deficiency. In this review, a new approach is proposed in which UIC data are
extrapolated to iodine intakes, adjusted for intraindividual variation, and then
interpreted using the estimated average requirement cut-point model. This may
allow national programs to define the prevalence of iodine deficiency in the
population and to quantify the necessary increase in iodine intakes to ensure
sufficiency. In addition, thyroglobulin can be measured on dried blood spots to
provide an additional sensitive functional biomarker of iodine status.
© 2012 International Life Sciences Institute
INTRODUCTION
Iodine is an essential nutrient for the synthesis of thyroid hormones that are critical for brain development. Iodine deficiency (ID) in utero and in early childhood damages the developing brain, leading to the loss of millions of IQ points globally, making it one of the most important pre-ventable causes of brain damage worldwide. Fortunately, through salt iodization, ID is among the simplest and least expensive of nutrient deficiencies to prevent. The annual costs of salt iodization are estimated at only $0.02–$0.05 per child covered, and the costs per child death averted are $1,000 and per disability-adjusted life year gained, $34–36.1
Control of ID is thus a critical and achievable devel-opment goal for national governments. In 1952, a World Health Organization (WHO) technical group recom-mended iodization of all “food salt” in iodine-deficient
areas.2 Forty years passed before this recommendation
was placed squarely on the global health agenda. In 1990, at the U.N. World Summit for Children and the World Health Assembly, and again in 1991 at the Conference on Ending Hidden Hunger, world leaders adopted the ambi-tious goal of eliminating ID as a public health problem.3–5
In 1993, WHO reaffirmed salt iodization as the central strategy to achieve this goal.6Recently, the International
Child Development Steering Group identified ID as one of four key global risk factors for impaired child devel-opment for which the need for intervention remains urgent.7
There has been remarkable progress in the global effort to eliminate ID over the past two decades. In 1993, WHO estimated that 110 countries were affected by goiter and ID.8 From 2003 to 2011, the number of
iodine-deficient countries decreased from 54 to 32 and the number of countries with adequate iodine intake
Affiliations: MB Zimmermann and M Andersson are with the Human Nutrition Laboratory, Institute of Food, Nutrition, and Health, ETH Zurich, CH-8092 Zurich, Switzerland, and the International Council for the Control of Iodine Deficiency Disorders (ICCIDD), CH-8092 Zurich, Switzerland.
Correspondence: MB Zimmermann, Human Nutrition Laboratory, Institute of Food, Nutrition, and Health, ETH Zurich, Schmelzbergstrasse 7, CH-8092 Zurich, Switzerland. E-mail: [email protected]. Phone:+41-44-632-86-57. Fax: +41-44-632-14-70.
Key words: estimated average requirement, goiter, iodine deficiency, iodine intake, prevalence, salt iodization, thyroglobulin, urinary iodine concentration
bs_bs_banner
increased from 67 to 105.9Currently, 71% of the global
population has access to iodized salt, up from 20% in 1990.10Because many countries have eliminated ID or are
approaching that goal, their emphasis is now shifting to sustaining these achievements. But salt iodization pro-grams are fragile and require a long-term commitment from governments. Initial enthusiasm may wane as other health problems (e.g., infectious diseases, obesity, and diabetes) move onto the health agenda. In several coun-tries in which ID had been eliminated, salt iodization programs fell apart and ID recurred.11Children in
iodine-deficient areas are vulnerable to even short-term lapses in iodized salt programs.12
Thus, salt iodization programs, like other public health interventions, require effective, long-term moni-toring systems. In 2005, the World Health Assembly called on national governments to report on their iodine nutri-tion every 3 years.13Periodic measurement of population
iodine status is important because both ID and iodine excess have adverse health effects. Monitoring of the salt iodization process and of household coverage with iodized salt are important to ensure that adequately iodized salt reaches at-risk populations. But monitoring must also assess what impact salt iodization and other iodine sources (recognized and unrecognized) are having on the iodine status of the population. This requires the collection of biological samples. The challenge is to choose and apply monitoring indicators that are valid and reliable while keeping costs to a minimum.
In this review to mark the 70thanniversary of
Nutri-tion Reviews, the evoluNutri-tion of iodine programs is dis-cussed and, specifically, how iodine monitoring of populations has changed over the past 70 years. The article covers how and why the time-honored method, the goiter rate (GR), was gradually superseded by measure-ment of urinary iodine concentration (UIC) and house-hold coverage with iodized salt. It also points out the limitations of these indicators and discusses the draw-backs of focusing only on school-aged children (SAC) and using the distribution of UICs to define the number of individuals affected. Finally, new approaches to assess-ing iodine nutrition are discussed, includassess-ing biomarkers of exposure (estimating intakes from UIC distributions) and function (dried blood spot thyroglobulin), and how these promise to provide a much more accurate and com-plete picture of iodine nutrition of populations.
THE PAST: THYROID SIZE AND GOITER RATE
Assessment of the size of the thyroid is the historical method by which iodine nutrition is evaluated. There are remarkably detailed descriptions of endemic goiter in dif-ferent Alpine regions of Europe dating back to the early 1500s. Inspection and palpation for goiter is simple and
quick. To assess goiter in field studies, children and adults are examined with the examiner sitting or standing directly in front of the subject, palpating the base of the neck with both thumbs simultaneously. The normal thyroid should not be visible with the neck in the normal position and the lateral lobes may be barely palpable beneath the strap muscles on both sides of the trachea. The surface of the thyroid is smooth and its consistency is firm but compressible, but often the normal thyroid is not palpable.
When is a thyroid a goiter?
There have been many attempts to try and objectively define when a thyroid is goitrous. In North American goiter surveys in the early 1900s, a normal-sized lobe of the thyroid was assumed to have the size of a lima bean (Phaseolus lunatus) and this was often used as a reference standard for comparison. Other early surveys found it practical to list as positive for endemic goiter a gland that was four to five times the normal size. However, the size of a normal thyroid can vary depending on the age and physical build of the individual. Identifying large visible goiters is straightforward, but experience is needed to accurately identify smaller goiters by palpation, and mis-classification is common.
In 1953, at the Food and Agriculture Organization/ WHO Third Conference on Nutrition Problems in Latin America, it was proposed that the dimensions of the thumbnail of the person being examined be used as an approximate reference of normal size of a lateral lobe.14
Thus, a gland with lateral lobes greater in size than the terminal phalanges of the thumbs of the person being examined could be considered goitrous. This practical standard was widely adopted for field surveys. In 1960, Perez et al.15 proposed a goiter rating scale, but it used
arbitrary grading definitions such as “recognized at a con-siderable distance” or “causes difficulty with respiration and the wearing of clothes.” At a Pan American Health Organization/WHO meeting in Lima in 1983, a new clas-sification system16for field studies was proposed that was
widely used for the next decade. It recommended the following staging: stage 0, no goiter; stage I, goiter detect-able only by palpation or visible when the neck is fully extended; stage II, goiter visible with the neck in a normal position; stage III, very large goiter recognizable at a dis-tance. The total GR was defined as the prevalence of stages I + II + III within a given region, and an area was empirically defined as endemic for goiter if the GR in primary school-aged children was>10%.
A decade later,WHO, together with UNICEF and the ICCIDD,6simplified the classification system to produce
the current grading system: grade 0 was defined as a thyroid that is not palpable or visible; grade 1 was defined
as an enlarged gland that is palpable but not visible when the neck is in the normal position (i.e., the thyroid is not visibly enlarged); and previous stages 2 and 3 were com-bined into a single new grade 2, defined as a thyroid that is clearly visible when the neck is in a normal position. At the same time, WHO/UNICEF/ICCIDD also revised downward the GR to be considered a public health problem because, in some populations, GRs of 5–10% were associated with low UICs and/or elevations of thyroid-stimulating hormone (TSH). It was recom-mended that the GR be used to define severity of ID in populations as follows:<5%, iodine sufficiency; 5–19%, mild deficiency; 20–29%, moderate deficiency; and>30%, severe deficiency.17 This system of goiter grading and
defining ranges of severity remains in use today. A sus-tained salt iodization program should decrease the GR to <5% in SAC, and this indicates disappearance of ID as a significant public health problem.17
From the 1960s to the 1990s, children of primary school age, usually defined as 6–12 year olds, increasingly became the preferred target group for goiter surveys. Goiter surveys were nearly always done in SAC for the following reasons: 1) they were readily accessible at schools; 2) samples were often representative because most children go to primary school even in low-income countries; 3) this age group is vulnerable to goiter; and 4) diffuse goiter in most SAC will regress with iodine treat-ment, whereas goiter in older individuals tends to be more fibrotic and less responsive to iodine. Although early authors suggested including pregnant women in goiter surveys because they were vulnerable to goiter even in areas of marginal ID, they were rarely included because representative sampling was more difficult to achieve in this group than in school-based surveys. This focus on SAC carried over into later surveys monitoring excretion of urinary iodine, and, as discussed below, only recently have the limitations of using iodine status in SAC as a proxy for the entire population become widely recognized.
Introduction of thyroid ultrasound
Assessing iodine status by goiter palpation in areas of moderate to severe ID where many goiters are easily visible is relatively straightforward. In contrast, in areas of mild ID where goiters are smaller, palpation of goiter has poor sensitivity and specificity, even when done by expe-rienced examiners. In such areas, measurement of thyroid volume by ultrasound may be preferable.18With
the development of portable, high-resolution equipment in the 1980s, using thyroid ultrasound became possible even in remote areas, where a generator or a car battery can provide electric supply. Experienced examiners can complete a measurement quickly, needing only 2–3 min
per subject. Because of its increased accuracy and preci-sion, thyroid ultrasound increased in popularity in the late 1990s, as visible goiter began to disappear with the spread of iodized salt. In 2003, WHO international refer-ence criteria for thyroid volume by ultrasound in SAC were published, with age- and body surface area-specific 97thpercentiles calculated for boys and girls.19In 2007,
WHO described a standard method.19,20 Despite this,
thyroid ultrasonography as a field tool has not been widely adopted. Thyroid ultrasound equipment is expen-sive, accurate measurement requires training, and differ-ences in technique can produce large interobserver errors.21For these reasons, and because the limitations of
using GRs to monitor the short-term impact of salt iodization are now widely recognized (discussed below), most countries do not routinely use thyroid ultrasound in iodine monitoring.
Potential for iodine deficiency prevalence to be overestimated by use of goiter rate measurement after iodized salt introduction
In the 1990s, as iodized salt programs were introduced in many countries, there were increasing reports from areas that were previously endemic for goiter that although thyroid size decreased as iodine intake increased, thyroid size did not return to normal for months or years after ID correction, and the GR remained elevated (>5%), particu-larly among older children and adults.22,23This problem
was already recognized in the early 1800s by Coindet in Geneva, who noted that goiterous thyroids often did not completely disappear even after long-term treatment with oral iodine. Because of this long lag-time in the resolution of goiter, the GR is difficult to interpret for several years after iodized salt introduction, because it reflects both a population’s history of iodine nutrition as well as its present status. Following recommendations from WHO in 1993,6most national monitoring programs were
mea-suring both the GR and the UIC, but in contrast to the sluggish response of the GR, UICs rapidly increased into the normal range after the introduction of adequately iodized salt because they reflect recent iodine intake (described below). This resulted in many programs reporting a discrepancy between the degrees of residual ID in the population, as indicated by the UIC compared to the GR. For example, in South African children, after 1 year of mandatory salt iodization, the median UIC was adequate, but the GR by palpation remained unchanged.24
A prospective study in West Africa described the time course and pattern of changes in thyroid size and GR in response to the introduction of iodized salt in an area of severe endemic goiter.23 Over a 5-year period in Côte
d’Ivoire, thyroid size by ultrasonography and UICs and thyroid hormone concentrations were measured in SAC
6 months before the introduction of iodized salt and annually for 4 years thereafter. The results showed that 4 years after the introduction of iodized salt and normal-ization of the median UIC, mean thyroid size had decreased by 56%. However, the GR in SAC remained clearly elevated 4 years after successful introduction of iodized salt, primarily because of persistent goiter in older children. Why do small goiters persist in many children? One possibility is that enlarged thyroids in children who grew up under conditions of ID have irreversible changes in thyroid structure that may not regress completely after the introduction of iodized salt.23 If true, achieving a
GR<5% in SAC may require that the children be born and grow up under conditions of iodine sufficiency. This implies that the lag time to normalization of thyroid size and GR in SAC after the introduction of iodized salt in an area of chronic ID could be a decade or more.
This discrepancy between the median UIC and the GR after the introduction of iodized salt was a source of confusion in many ID control programs. Encouraged by rapid improvements in salt iodine concentrations and the median UIC, governments and program managers moni-toring the effect of salt iodization expected a comparable improvement in the GR, but they were often disap-pointed. In response, monitoring guidelines were revised to emphasize the limitation of the GR in judging the short-term efficacy of salt iodization programs. In 2000, WHO recommended that the median UIC be used as the primary indicator of the impact of iodized salt and it rapidly supplanted the GR as the method of choice. Despite its current unpopularity, the GR in SAC remains an important and sensitive long-term indicator of the success of an iodized salt program. Palpation of goiter is also a useful tool in areas where iodized salt has not yet been introduced or when there is concern that ID may be re-emerging. In such cases, the selection of schools or communities for surveying can be purposive, i.e., on the basis of ID being suspected in that location.
THE PRESENT: MEASUREMENT OF URINARY IODINE CONCENTRATION, DIETARY ASSESSMENT OF
IODINE INTAKE, AND HOUSEHOLD COVERAGE WITH IODIZED SALT
Urinary iodine concentration
Already in the 1980s, expert groups working to control ID had recognized the limitations of focusing only on goi-ter.25 To emphasize that goiter was only one of many
sequelae of ID, Basil Hetzel proposed the term “iodine deficiency disorders (IDD)” to replace “endemic goiter” to describe the broad spectrum of adverse health effects of ID,26and the emphasis of iodine monitoring began to
swing toward measurement of urinary iodine (UI).
Moving from a subjective biomarker of function (goiter), to an objective biomarker of exposure (UI), was a step forward because it improved standardization and enabled comparisons to be made among studies.
UI is an excellent indicator of recent iodine intake because ⱖ92% of dietary iodine is absorbed and, in healthy, iodine-replete adults,>90% is excreted in the urine within 24–48 h.27,28UI can be expressed as a 24-h
excretion (UIE; mg/day), as a concentration (UIC; mg/L), or in relationship to creatinine excretion (mg iodine/g creatinine). But these are not interchangeable, as dis-cussed below. Because it is impractical to collect 24-h samples in field studies, UICs are usually measured in spot urine collections. In healthy well-nourished adults, daily creatinine excretion is fairly constant at about one gram, so expressing the UIE from spot samples in adults as mg iodine/g creatinine approximates the value in a 24-h collection and reduces variation due to hydration status.29
But in malnourished populations with poor protein intakes, daily creatinine excretion is more variable and often lower than 1 g.30In these settings, expressing
the UIE as mg iodine/g creatinine may introduce greater variation. Due to these limitations and the addi-tional expense of measuring creatinine, the routine co-measurement of creatinine fell out of favor and was replaced by the expression of UIC in mg/L. If a large number of samples are collected, variations in hydration among individuals and day-to-day variation in iodine intake generally even out, so that the median UIC in spot samples correlates well with the median from 24-h samples and with the estimated UIE from creatinine-corrected UICs.31
But establishing ranges and cut-offs for UICs to define ID in populations was not straightforward. In 1983, the Pan American Health Organization/WHO group recommended that goiter endemias be described by both the GR and by the severity of ID, as reflected in the excretion of UI.25If the GR in a population exceeded
10%, WHO recommended the mean UIE should be mea-sured, and the degree of ID in the population be graded according to the following scale. Grade 1: Goiter endemias with a mean UIE of greater than 50 mg/g crea-tinine. At this level of iodine intake, no thyroidal or devel-opmental abnormalities are anticipated. Grade 2: Goiter endemias with a mean UIE in the range of 25–50 mg/g creatinine. This group is at risk for hypothyroidism but not for overt cretinism. Grade 3: Goiter endemias with a mean UIE of<25 mg/g creatinine. There is a high risk for endemic cretinism in such a population.
Similarly, ICCIDD, at its founding meeting in 1986 in Katmandu, proposed that a mean UIC of<50 mg/L indi-cated ID and if the UIC level was<20 mg/L, severe ID.32,33
Then, in 1988, Pierre Bourdoux, from Brussels, published an article on the use of UI data to evaluate
population iodine status that proved influential.34 He
pointed out the inadequacies of the mg iodine/g creati-nine ratio and recommended the use of the concentration in mg/L in a “sufficient” number of spot urine samples (50–100 as a minimum). He showed that UIC distribu-tions in populadistribu-tions generally do not follow a normal distribution and the limitations of the use of the mean UIC to describe iodine status of a population. Instead, he suggested a simple empiric quantification of the severity of ID in a population by calculating the percentages of subjects with UICs<100, <50, and <20 mg/L.
Meanwhile, taking a more rigorous approach to defining UIC cut-offs, experts examined the limited data available on the association between goiter and UIC in populations before iodine prophylaxis. A key study was that of Ascoli and Arroyave (1970) that included data from 186 regions of Central America with goiter palpa-tion in 21,000 people (children and adults) and measure-ments of UIC and creatinine in over 3,000, with calculation of 24 h UIE based on urinary creatinine.35
This study found that endemic goiter (defined at that time as a GR>10%) was found in the following areas: 1) all areas in which the mean UIE was <25 mg/day; 2) most areas in which the mean UIE was 25–49 mg/day; 3) about
one-third of areas in which the mean UIE was 50–99 mg/ day; and 4) virtually none of the areas in which UIE was >100 mg/day (Figure 1).
Based largely on these data suggesting the GR was <10% when the mean UIE was >100 mg per day, WHO endorsed a median UIC of>100 mg per liter as an indica-tor of iodine sufficiency in a population (1993).6 But
clearly the UIC in mg/L is not necessarily interchangeable with the 24 h UIE (mg/24 h), as it depends on daily urine volume.36 If the daily volume of urine produced by a
group approximates 1 L/day, as it does in healthy primary SAC, then the UIC (mg/L) is interchangeable with the 24 h UIE (mg/24 h). But these two indices are not comparable in older adolescents and adults, in whom the mean daily urine volume approximates 1.5 L/day37; thus, the UIC
(mg/L) in spot samples is usually about 60–65% of the amount excreted in 24 h. Therefore, in adults, a UIE of 100 mg/24 h corresponds to a UIC of approximately 60–70 mg/L. Thus, the extrapolation from the observed association between increasing goiter and a UIE<100 mg/ 24 h35to a UIC below 100 mg/L as indicative of ID may
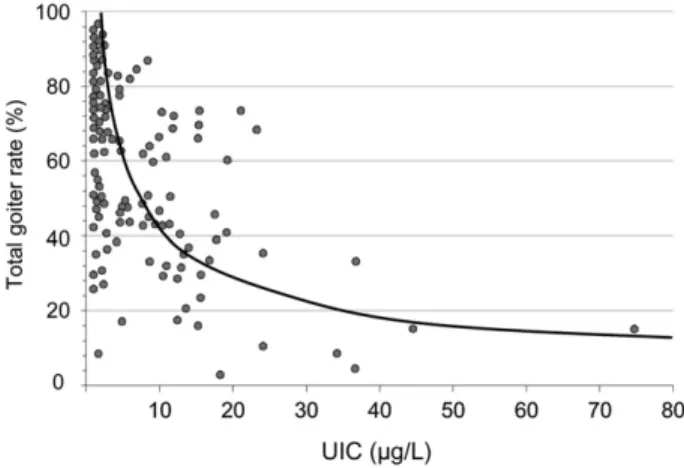
have been applicable in children but was not correct for adults. In practical terms, this resulted in an inappropriate increase in the recommended iodine intake for adults without any real evidence that this was needed to avoid ID. The proper interpretation of these data would have produced a cut-off for ID using the median UI in SAC of 100 mg/L and a cut-off of about 60–70 mg/L for adults. This adult cut-off is supported by a large study of young women in Slovakia conducted before the introduction of iodine prophylaxis; in this study, GRs were estimated by palpation in approximately 10,000 women and UICs in spot samples (expressed as mg/L) were measured in approximately 2,50038 (Figure 2). The results indicated
Figure 1 Correlation between goiter rate and urinary
iodine excretion (UIE) in the general population of 186 localities in Central America during the period 1965– 1967. Each point represents an average of values from
sub-jects of 20 randomly selected families. Goiter and UIE were measured in 21,611 and 3,181 subjects, respectively. Data from Ascoli and Arroyave.35Reprinted from Best
Prac-tice & Research Clinical Endocrinology & Metabolism, Vol 24, Iss 1. Laurberg, Cerqueira, Ovesen, Rasmussen, Perrild, Andersen, Pedersen, and Carlé. Iodine intake as a determi-nant of thyroid disorders in populations, pp13–27, (c) 2010, with permission from Elsevier.
Figure 2 Correlation between goiter and urinary iodine
concentration (UIC) in women of reproductive age (n= 2,484) from 86 villages in Slovakia. Each point rep-resents an average of values from 10 to 40 women. Adapted from Langer.38
there was no increase in goiter in areas where the mean UIC was >60 mg/L. This lower cut-off for the median UIC for adults is also supported by the EAR cut-point approach to define low iodine intakes, as discussed below. In 1992, at a joint WHO/UNICEF/ICCIDD consul-tation, it was first proposed that the goal of monitoring progress toward eliminating IDD as a public health problem was to achieve a median UIC of 100 mg/L in SAC, with less than 20% of subjects having UICs below 50 mg/L.6The UIC cut-off of 100 mg/L in SAC was
sup-ported by a multicenter study in which UIC and thyroid volume were measured in 5,709 European school chil-dren.39Although this study may have overestimated the
goiter prevalence,19 the authors concluded that goiter
begins to appear in SAC below the critical UIC threshold of 100 mg/L, and this agrees well with the earlier data from SAC in the report of Ascoli and Arroyave.35
By the mid-1990s, the median UIC<100 mg/L in SAC had become the most widely used biochemical measure of ID in a population. For national, school-based surveys of iodine nutrition, the median UIC from a representative sample of spot urine collections from approximately 1,200 children (30 sampling clusters ¥ 40 children per cluster) could be used to derive the median UIC used to classify a country’s iodine status (Table 1).6,17 In later
WHO recommendations,17,40 it was proposed that the
median UIC cut-off of 100 mg/L could also be applied to adults. But, as discussed above, this is incorrect: use of this cut-off in young women of reproductive age, although it is increasingly done, results in a falsely high prevalence of women with inadequate intakes. The correct cut-off for median UIC in adult women remains uncertain but is likely to be close to 60–70 mg/L.
Starting in the 1990s there was a remarkable expan-sion of coverage of the global population represented by UIC surveys. By 2011, UIC survey data covered 96.1% of the world’s population of SAC.9Although data are lacking
for 45 countries, these countries (mostly smaller islands) contain only 3.9% of the world’s population of SAC. Many regional and national laboratories were established that could accurately measure UICs, and over the past decade, the U.S. Centers for Disease Control and Preven-tion has provided rigorous external quality control through its international EQUIP program.41
Potential to overestimate the true prevalence of iodine deficiency when using crude UIC data distributions from spot samples to define the number of individuals affected by low intakes. Although the median UIC is a good popu-lation indicator of iodine status, the distribution of UIC around the median in iodine surveys is often misinter-preted in an attempt to define the number of individuals who are deficient. A common mistake is to assume that all subjects with a spot UIC<100 mg/L are iodine defi-cient. But dietary iodine intake and therefore UIC are highly variable from day to day. In iodine-sufficient countries where most iodine intake comes from iodized salt, UIC (both spot and 24-h urine collections) show an individual day-to-day variation of 30–40% (Figure 3a,b).29,31,42 Therefore, in an individual whose
average daily iodine intake is adequate to maintain normal thyroidal iodine stores, iodine intake will show wide daily variation that will result in many individual days when a UIC value will be less than adequate. Thus, even in populations in which iodized salt ensures adequate thyroid stores, there will nearly always be Table 1 Epidemiological criteria for assessing iodine status on the basis of median and/or range of urinary iodine
concentration values in a population.
Median UIC Iodine intake Iodine nutrition status School-aged children
<20 mg/L Insufficient Severe iodine deficiency
20–49mg/L Insufficient Moderate iodine deficiency
50–99mg/L Insufficient Mild iodine deficiency
100–199mg/L Adequate Optimal
200–299mg/L Above requirements Likely to provide adequate intake for pregnant/lactating women, but may pose a slight risk of more than adequate intake in the overall population
ⱖ300 mg/L Excessive Risk of adverse health consequences (iodine-induced hyperthyroidism, autoimmune thyroid disease) Pregnant women
<150 mg/L Insufficient Iodine deficiency
150–249mg/L Adequate Optimal
250–499mg/L Above requirements –
ⱖ500 mg/L Excessivea –
Lactating women
ⱖ100 mg/L Adequate Optimal
aIn excess of the amount required to prevent and control iodine deficiency.
individuals with a UIC<100 mg/L on the day of the survey, but they are not truly iodine deficient.
This common error in UIC interpretation was unfor-tunately indirectly endorsed by WHO. When pushed to define the number of individuals with low iodine intakes in order to give prevalence estimates, WHO made the decision to classify all children in iodine surveys with a spot UIC<100 mg/L as having low iodine intakes.43This
allowed WHO to generate regional and global prevalence data, but the approach also led to the apparent paradox that a country like Switzerland, with a model iodized salt program, a national median UIC of 120 mg/L and a GR of <3% in SAC,44is classified as having “optimal” country
iodine status, but at the same time 36% of the population is classified as having inadequate iodine intake.9
Since 2003, this approach has been used to monitor regional and global progress by estimating the number of individuals with low iodine intake.9,43,45It overestimates
the true prevalence of ID (see below) and has contributed to the perception of a global slowdown in progress to control ID when looking at trends in numbers affected rather than in changes in national iodine status based on the median UIC. Over the past decade, the number of countries with adequate iodine status based on the national median UIC has jumped from 67 to 105.9During
the same period, the global prevalence of SAC with low iodine intake has fallen only 6%, from 36% in 2003 to 30% in 2011. This method has resulted in the paradox that in 2011, 3 out of 4 children classified as having low iodine intake are living in countries that are iodine sufficient based on the national median UIC, while only 1 in 4 with low intakes are living in countries with inadequate national medians. In practical terms, continued use of this method to define the prevalence of ID will make the global goal of elimination of ID impossible to achieve.
This error in UIC interpretation may do harm in that it implies that countries with already adequate national median UICs should try and minimize the percentage of
the population with a UIC<100 mg/L by increasing the iodine content of salt and increasing intakes. But high intakes of iodine should be avoided, especially in popu-lations with a history of chronic ID, because a large increase in iodine intake may precipitate autoimmune thyroid disease and/or hyperthyroidism.46,47Based on the
national median UIC, in 2011, 11 countries have iodine intakes above the 300 mg/L threshold that WHO classifies as “excessive.”9,17These data emphasize the importance of
regular monitoring of iodine status to detect not only low but also excessive intakes of iodine.
A new approach is proposed below in which UIC survey data adjusted for intra-individual variation is extrapolated to iodine intakes and then interpreted using the EAR cut-point model. This approach may allow national programs to accurately define the prevalence of ID in the population and quantify the necessary increase in iodine intakes to ensure sufficiency.
Potential to miss iodine deficiency in vulnerable groups when focusing only on school-aged children. As discussed above, early goiter surveys focused on SAC, and if the GR in SAC was low, it was generally assumed that iodized salt was providing adequate iodine to the entire population. As assessment of iodine status using UICs gradually replaced goiter surveys, the target group in nearly all studies remained SAC. In 2011, an assessment of 148 countries with data showed that 107 estimates were based on national studies conducted in SAC.9 This focus on
SAC simplified iodine monitoring but it was too narrow, because the groups most vulnerable to irreversible damage from ID are developing fetuses (via pregnant women) and infants.48 Later studies demonstrated that
iodine status in pregnant women or in women of repro-ductive age are not necessarily represented by the iodine status of schoolchildren (Figure 4).49,50In some countries,
women can have low intakes even when SAC have optimal intakes. This may be particularly true in Figure 3a Day-to-day variation of urinary iodine
con-centration (UIC) in 24-h and spot samples from one healthy adult woman in an iodine-sufficient population obtained over a 9-day period.
Data adapted from König et al.31
Figure 3b Median urinary iodine concentration (UIC) in
spot samples from 22 healthy adult women in an iodine-sufficient population obtained over a 9-month period. Median UIC (95% CI, by bootstrap).
populations eating Western diets since a substantial pro-portion of total iodine intake in such diets comes from milk, and milk consumption is typically highest in children.51
Although monitoring of iodine status in pregnant women and in women of reproductive age is becoming increasingly popular,17,52only a limited number of
coun-tries have completed UIC surveys in these groups on the national or large subnational level. Because there are insufficient data to directly estimate the regional or global prevalence of low iodine intake in these important target
groups, the median UIC in SAC continues to be used as a proxy for the general population in most surveys.
Dietary iodine requirements
The dietary reference intakes (DRI) for iodine, set by the Institute of Medicine (IOM) in the United States, are pro-vided as three different measures to describe the distribu-tion of nutrient requirements; the estimated average requirement (EAR), the recommended dietary allowance (RDA), and the adequate intake (AI)53,54 (Table 2). The
DRIs apply to usual intakes over time and are intended for a generally healthy population.55The EAR for iodine
has been derived from balance studies56–60 and from
studies measuring the daily iodine uptake, accumulation, and turnover in the thyroid gland by using radioactive iodine in euthyroid adult subjects.61,62 The average
thyroidal iodine turnover in these studies was in the range of 91–97 mg/day, with a coefficient of variation of 20%, i.e., a standard deviation (SD) of 19 mg/day.53,62The EAR
for adults has, therefore, been set at 95 mg/day.53The RDA
of 150 mg/day is calculated from the EAR by adding 2 SD to the EAR and rounding to the nearest 50 mg.17,53 The
basis for the DRIs for iodine in other age and population groups has been reviewed elsewhere.48,53
Dietary assessment of iodine intake
Dietary sources of iodine. In countries in which salt is iodized, it is generally the main dietary source of iodine, i.e., household salt or salt used in food production.63,64
WHO recommends levels of 20–40 mg iodine per kg salt.65 Commercially available iodized salt contains
iodine in the range of 15–80 mg iodine per kg salt.63,66In
settings in which foods are mainly prepared at home, household (table) salt is the major iodine source. In con-trast, in industrialized countries, salt used in processed foods contributes approximately 60–80% of the total salt
Median UIC (µg/L) for school-age children
Median UIC (
μ
g/L) for pregnant women
0 100 200 300 400 500 0 100 200 300 400 500
Figure 4 Scatter plot of median urinary iodine
concen-tration (UIC) in pregnant women and school-age chil-dren (n= 48). Each point represents a survey pair. The horizontal dashed line indicates the cutoff value for inad-equate median UIC for pregnant women (<150 mg/L), and the vertical dashed line indicates the cutoff value for inad-equate median UIC for school-age children (<100 mg/L). The regression line equation is y= 44.59 + 0.59(x), and R2= 0.69.
Reprinted with permission from Wong et al., the Food and Nutrition Bulletin.50
Table 2 Recommended dietary intakes of iodine by age or population group.
Age or population group IOMa WHOb
EAR (mg/day) AI or RDA (mg/day) Tolerable UL (mg/day)
Age or population group RNI (mg/day)
Infants 0–12 months – 110–130c . . . Children 0–5 years 90
Children 1–8 years 65 90 200–300 Children 6–12 years 120
Children 9–13 years 73 120 600 . . . .
Adultsⱖ 14 years 95 150 900–1,100 Adults>12 years 150
Pregnant women 160 220 900–1,100 Pregnancy 250
Lactating women 200 290 900–1,100 Lactation 250
aData from the Institute of Medicine.53 bData from the World Health Organization.17 cValues are adequate intake.
Abbreviations: AI, adequate intake; EAR, estimated average requirement; RDA, recommended daily allowance; RNI, recommended
intake.67–69 The main salt sources from processed foods
in typical Western diets are bread, dairy products (see below), and processed meat.70–72 The total amount of
dietary iodine from salt in industrialized countries with iodized salt varies depending on the type of food prod-ucts produced with iodized salt and the level of iodine fortification.
However, in most countries, much of the salt used in food production is not iodized. In industrialized countries, where average daily salt consumption in adults is approximately 10 g/day but only 1–2 g/day is household salt, if the food industry were to use non-iodized salt and only household salt were to be non-iodized, then total iodine intake from iodized salt would only be about 40 mg/day, which is far below the daily require-ment for all age groups. But there are good examples of how the use of iodized salt by the food industry can contribute to iodine sufficiency. In Denmark and the Netherlands, for example, most salt used by the baking industry is iodized, and this is a major contributor to iodine sufficiency.73–75
Although their native iodine content is low, dairy products are other major sources of dietary iodine due to iodine fortification of cattle fodder and/or iodine residues remaining in milk from disinfecting agents (iodophors) used in dairying.76–80 Remarkably, in countries without
iodized salt, adventitious iodine in milk is the principal dietary source of iodine; e.g., in the United Kingdom and Norway.81,82 Milk and dairy products are particularly
important iodine sources for children.51,64,78,82,83Saltwater
fish and seafood have high natural iodine content,84but
their contribution to the overall dietary iodine intake is modest unless consumed every day.64,82 Some types of
seaweeds are high in iodine and the iodine intake in seaweed-consuming populations may consequently be high.85,86Drinking water drawn from certain aquifers or
water disinfected with iodine can also be rich in iodine.87,88
Variability of iodine intake. Individual levels of iodine intake can vary considerably from day to day, depending on the types of iodine-containing foods consumed and their iodine content. The main variation is due to daily differences in salt intake,89,90 i.e., decisions to consume
processed food products with iodized salt and the discre-tionary amount of iodized salt. The iodine content of other foods may vary due to natural variation in iodine content.77,78,91For example, milk iodine concentration can
vary between regions of origin,77,81,92 with season,76,92
between conventional milk and organic milk,81and with
fat content.92
Methods used to assess dietary iodine intake. Dietary assessment of iodine intake aims to measure the average
habitual long-term iodine intake from iodine-containing foods, i.e., food choices, amounts consumed, and fre-quency of consumption.93,94 The three major
instru-ments are food frequency questionnaires (FFQ),74,95,96
food diaries or 24-h food intake recalls,97
and weighed food records.64 FFQs assess the frequency and portion
sizes of iodine-containing foods and/or food groups consumed over a predefined time-frame (usually 1 year).93,94The FFQ method captures iodine-rich sources
that are irregularly consumed and accounts, to some extent, for day-to-day variation in the overall consump-tion patterns. Although an FFQ may include quesconsump-tions on discretionary salt added at the table or in cooking, it is difficult to accurately quantify the total amount of iodized salt consumed. Therefore, the FFQ method is not a reliable quantitative method for assessing total iodine intake. Food diaries or 24-h recalls measure short-term intakes.93,94To capture the day-to-day variation in dietary
iodine intake, at least 10 repeated assessment days and/or a large sample size is needed, as shown for 24-h UIC collections.31Dietary recall is often inaccurate with
regard to salt intake and it generally underestimates salt consumption.98,99 The lack of accuracy in measuring
iodine intake from iodized salt is, thus, a major limita-tion of dietary assessment.95,100,101
Food composition tables. All assessment methods require information on the iodine content of foods to calculate the iodine intake. Food iodine content can be accurately measured by inductively coupled plasma mass spec-trometry (ICP-MS).78 Unfortunately, only a limited
number of laboratories worldwide perform food analysis with ICP-MS. The quality of iodine data in food compo-sition tables depends on whether the food iodine analysis is up-to-date and to what extent natural variability in iodine content is taken into account. Food composition databases generally contain information on the salt content of foods, but they rarely specify if the salt used in processed foods is iodized or not. The food industry often fails to declare whether iodized salt has been used in food production and, even if they do, there may be differences in salt iodine content between brands of the same product or even for the same brand sold in differ-ent countries.
In summary, dietary assessment of iodine intake is challenging and the large day-to-day variation makes it difficult to quantify the “usual” iodine intake. However, dietary data can be used to identify the most significant food sources of iodine. This information is useful to design or adapt iodine intervention strategies. Simulation models can be used to predict anticipated effects of changes in the level of iodine fortification, the impact of reduced salt intake, and changes in food vehicles used for iodine fortification.63,75,102,103
Monitoring iodized salt programs by measuring the percentage of households using iodized salt
The iodization of household salt is monitored in stan-dardized household surveys in many lower-income coun-tries. Since the mid-1990s, UNICEF has assisted countries in collecting health data through its international house-hold survey initiative, the Multiple Indicator Cluster Surveys. Another example is the Demographic and Health Surveys program from the US Agency for Inter-national Development. These surveys have large sample sizes (usually between 5,000 and 30,000 households) and typically are conducted about every 5 years, to allow com-parisons over time to be made. The testing of household salt samples is usually done with simple rapid test kits (RTKs). A drop of starch-based solution placed onto salt produces a blue/purple color if the salt contains iodine. RTKs directly assess the penetration and coverage of a population by iodized salt. This approach has clear advan-tages in iodine monitoring. It is noninvasive, simple, and inexpensive, and it provides immediate visible results.
In low-resource settings, household coverage with iodized salt may be the only indicator used to monitor iodine status in a population. But this approach is inad-equate for several reasons. First, RTKs are qualitative not quantitative; they can detect the presence of iodine in a salt sample, but they cannot accurately quantify the amount. Thus, salt that is not adequately iodized (adequately iodized salt is usually defined as containing >15 and <40 ppm iodine) will test positive but will not deliver adequate iodine to populations. Second, in many middle- and high-income countries, salt intake comes mainly from purchased processed foods. Little salt is added in the home, so even if household coverage with adequately iodized salt is high, iodine intakes may not be adequate unless the food industry uses iodized salt. Finally, in some areas, other sources of iodine (such as iodine-rich groundwater) can contribute large amounts of dietary iodine, and iodine intakes may be excessive in a population, but household coverage data do not reflect this.
To ensure salt is adequately iodized and not over-iodized, it is now recommended that RTK data be backed up by quantitative titration. The iodine content of salt is measured by titrating the iodine with sodium thiosul-phate using starch as an external indicator. Although it is accurate and requires only basic equipment, titration is time-consuming and requires some scientific training.An alternative is to use a portable spectrophotometer, such as the WYD checker to back up RTK results, but it is much more expensive than titration. Titration is recommended for determining iodine in salt at points of the salt distri-bution system (e.g., import points, manufacturers) where accurate testing is required.
UNICEF uses the data from household surveys of iodized salt to estimate the number of newborns born each year who are protected against mental and physical impairment from in utero ID.104For example, in a country
known to be iodine deficient before the introduction of iodized salt, if 50% of households are using salt that tests positive with RTKs, then the yearly birth rate is multiplied by 0.5 to derive the number of newborns born protected against ID. Because the developing fetus is the life stage most vulnerable to irreversible damage from ID, if this number could be quantified, this would be an important, relevant index of the potential health benefits of iodized salt programs. However, because of the limitations dis-cussed above, it is problematic to extrapolate from house-hold coverage to newborns protected. If the dietary iodine intake of women of reproductive age and/or preg-nant women could be estimated and the prevalence of low intakes in these groups determined, this would likely provide a better index of the number of newborns pro-tected from ID by iodized salt. This may be possible using the EAR cut-point approach and the distribution of UICs in women, as described in the next section.
THE FUTURE: ESTIMATION OF IODINE DEFICIENCY PREVALENCE USING THE ESTIMATED AVERAGE REQUIREMENT CUT-POINT METHOD AND DRIED BLOOD
SPOT METHODS TO ASSESS THYROID FUNCTION
In healthy adults, the mean daily uptake and release (turnover) of iodine by the thyroid is approximately 95 mg.62,105Thus, to achieve iodine balance (sufficiency),
the daily iodine intake must be sufficient to enable the thyroid to turn over 95 mg iodine per day to maintain euthyroidism. Short-term deficits in iodine intake can be buffered by intrathyroidal stores (up to 20 mg in iodine-sufficient areas) and increased fractional clearance of circulating iodine.105 However, if iodine intakes are
chronically low, thyroidal iodine reserves will be gradu-ally depleted and iodine turnover will need to be increas-ingly covered by dietary iodine supply (Figure 5). Eventually, low dietary intakes will limit thyroid hormone synthesis.106 Thus, ID can be broadly defined in two
phases: 1) as inadequate iodine intake (assessed by expo-sure biomarkers such as UIC) that, when chronic, leads to 2) thyroid dysfunction (assessed by functional biomark-ers, e.g., thyroid size, thyroid hormones). Inadequate iodine intake in individuals is defined as that below the RDA/RNI, whereas inadequate intake of populations is defined as intakes below the EAR.55,107–109The next section
describes the principal ideas behind two new methods to monitor the two phases of ID in populations, i.e., 1) EAR cut-point estimates considering the iodine EAR (expo-sure) and 2) prevalence of thyroid dysfunction based on dried blood spot thyroglobulin (function).
Estimation of iodine intake in populations using urinary iodine concentration measurement
UIC is considered a reliable biomarker of recent iodine intake in populations at all levels of chronic iodine intake: in positive iodine balance, more than 90% of ingested iodine is excreted in the urine. A major advantage of UIC over dietary assessment and household salt consumption data is that UIC represents the total iodine intake from all dietary sources. The concentration of iodine in the urine depends on the urine volume, and the daily iodine intake can be estimated from spot UIC by estimating the daily UIE from the creatinine concentration.29,31The following
simplified equation to calculate daily iodine intake has been proposed by the IOM53:
Iodine intake g L UIC g L
L h kg h μ ⋅ μ
(
)
=(
⋅)
⋅ ⋅ ⋅ ⋅ − − − − 1 1 1 1 0 92 0 0009 24 . . ⋅⋅(
)
⋅( )
− d weight kg 1In this equation, 0.92 refers to 92% bioavailability and 0.0009 L•h-1•kg-1 refers to excreted urine volume
from studies in children. Although body weight is poorly correlated with urine volume in adults, the factor of 0.0009 L•h-1•kg-1is still a good approximation
consider-ing an average 24-h urine volume of 1.5 L/day in adults.37
For example, using this equation, the estimated dietary
intake for a hypothetical population of women with a mean UIC of 120 mg/L and an average body weight of 64 kg110is 180 mg/day.
Estimation of iodine intake in populations using the estimated average requirement cut-point method
Nutrient inadequacy of habitual dietary intakes, defined as the long-term average daily nutrient intakes of popu-lations, is conventionally assessed using the EAR cut-point method.107,108,111This method uses the population
distribution of nutrient intakes, rather than a single mean or median intake value. The percentage of individuals in a group with usual intakes below the EAR are at risk of nutrient inadequacy.111,112The nutrient intake is
satisfac-tory when most (97–98%) individuals within the popula-tion meet the EAR, i.e., the acceptable prevalence of inadequate intakes is 2–3%. The method assumes that the nutrient requirements in the population are normally dis-tributed, but it does not necessarily require the nutrient intakes to follow a normal distribution, as described below.107 The underlying assumption is that the
inter-individual variation in requirements is lower than the inter-individual variation in intakes.109 The EAR
cut-point method has been widely applied as an evaluation tool for nutrient intakes of groups55,113,114and to define
the optimal fortification level of nutrients in foods.115 Estimation of the prevalence of inadequate
iodine intake
The EAR cut-point method can be used to estimate the prevalence of ID based on UIC distributions, because UIC is a reliable biomarker of recent iodine intake. The population distribution of UICs is typically skewed towards lower intakes with a scattered tail of high intakes. This pattern is not only due to variations in iodine intake between individuals, but also to high day-to-day variabil-ity of the iodine intakes for each person in the studied population. The sample size of the group takes inter-individual variation into account (when properly powered), but does not account for individual day-to-day variations.31,42Therefore, before UIC data from a group
can be used for the EAR cut-point method, the UIC dis-tribution in populations with large variations in iodine intakes must be adjusted for intra-individual varia-tion.55,112 This can be done by collecting two or more
repeated samples from the same individual in a subset of the study population. The information on variability obtained can then be used to correct for within-person variation in the group.116This approach adjusts the intake
distribution closer to the mean, i.e., to more closely resemble a normal intake distribution of habitual intakes (Figure 6).109,112
Adequate iodine intake
Inadequate iodine intake (Negative iodine balance)
Thyroid dysfunction Iodine deficiency Thyroidal iodine clearance Normal thyroid function Thyroid hormone TSH Thyroid size, Thyroglobulin Iodine sufficiency
Thyroidal iodine stores
Decreasing habitual daily iodine intake
Figure 5 The physiological stages of iodine status. The graph illustrates a simplified model of human iodine and thyroid status at different stages (left to right) of iodine intake: sufficient iodine intake, low iodine intake without thyroid dysfunction, and, finally, low iodine intake with hypothyroidism. The three stages are separated by vertical dashed bars. The scientific evidence is limited with regard to the absolute levels of habitual daily iodine intake at which thyroid stores decrease and thyroid dysfunction occurs. Abbreviation: TSH, thyroid-stimulating hormone.
The prevalence of ID can then be defined as the proportion of the population below the EAR, from the adjusted distribution (Figure 6). Normalization of the distribution generates a prevalence estimate that is closer to the true prevalence. Adjustment will generally reduce the prevalence compared to non-corrected distributions, except in populations with low or homogeneous iodine intakes.107 In populations with low iodine intake (i.e.,
mean intakes below the EAR), the distribution is typically
skewed to lower intakes and adjustment may underesti-mate the prevalence. In countries with a well-functioning salt iodization program, the iodine intake is less variable and the population distribution is close to normal without correction, as observed, for example, in Swiss school children.44 A further advantage of collecting a
repeat urine sample and accounting for intra-individual variation is that the required sample size can likely be smaller than the 500 samples now recommended for population assessment.31,42
Several different statistical methods to adjust the population distribution of nutrient intake data have been proposed by Iowa State University (ISU),117–122the IOM,108
and the National Cancer Institute (NCI).123–125 The
strengths and limitations of the different method are out-lined in earlier reviews.126,127Tutorials to obtain estimates
of usual intakes are available online from ISU,128 the
Centers for Disease Control and Prevention,129 and
the NCI.130The NCI approach is currently used in the
ongoing NHANES study.129To our knowledge, only one
study has used an adjustment approach to quantify vari-ability for UIC data.131The EAR has been used to estimate
the prevalence of inadequate iodine intakes from 24-h urine collections,64but the EAR cut-point method has not
yet been evaluated for spot UIC collections.
Urinary iodine concentration thresholds for the estimated average requirement cut-point method
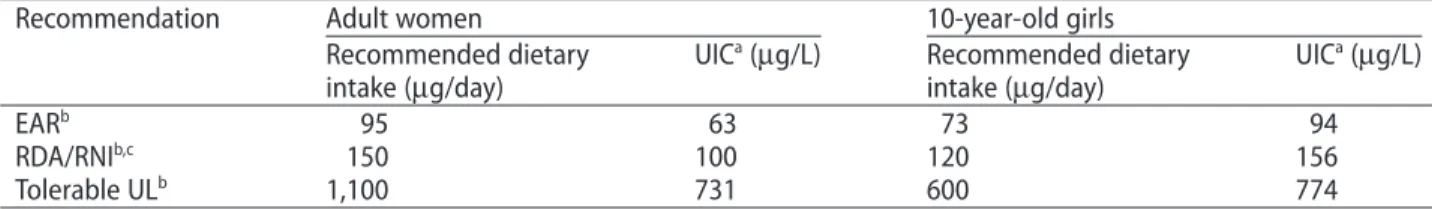
The UIC of each individual can be converted to daily iodine intake using the IOM formula described above and the intake distribution can be compared to the EAR. Alternatively, a UIC threshold corresponding to the EAR may be defined and used as a cut-off to estimate ID preva-lence directly from the UIC population distribution. The UIC thresholds corresponding to the EAR and RDA/RNI in an average female adult population with mean weight of 64 kg110are 63 mg/L and 100 mg/L, respectively, using
the simplified IOM formula (Table 3). Consequently, in a 0 50 100 150 200 250 300 0.02 0.01 0 UIC cut-off 63 µg/L4 UIC (µg/L)
Crude UIC (all subjects)1
Crude UIC (repeat subsample)2
Habitual UIC3
43%
7%
Figure 6 Population distribution of urinary iodine
con-centration (UIC) values in single spot urine samples (n= 683), repeat single spot urine samples (n = 145),
and after adjustment for intra- and inter-individual variation in a cross-sectional study of young Swiss women.
1Raw data UIC distribution of single individual spot urine
samples (n= 683).
2Raw data UIC distribution of repeat single spot urine
samples in a subsample (n= 145).
3Estimated habitual UIC distribution for the same group
(adjusted by the National Cancer Institute method, using one repeat single spot sample in a subsample).
4Estimated UIC cutoff corresponding to the estimated
average requirement.
Table 3 Recommended dietary intakes of iodine in adult women and 10-year-old girls, along with estimated
corresponding urinary iodine concentration values.
Recommendation Adult women 10-year-old girls
Recommended dietary intake (mg/day)
UICa(mg/L) Recommended dietary
intake (mg/day)
UICa(mg/L)
EARb 95 63 73 94
RDA/RNIb,c 150 100 120 156
Tolerable ULb 1,100 731 600 774
aValues calculated from dietary intake recommendations using the following equation: UIC (mg/l) = iodine intake (mg/day)/(0.0235 *
weight [kg])53in a population of women with a mean weight of 64 kg110or a population of 10-year-old girls with a mean weight of
33 kg.132
bData from the Institute of Medicine.53 cData from the World Health Organization.17
Abbreviations: EAR, estimated average requirement; RDA, recommended daily allowance; RNI, recommended nutrient intake; UL, upper
population with 2–3% of adult women with usual UICs below the EAR-UIC threshold of 63 mg/L, the mean/ median UIC will be around 100 mg/L, after adjustment for day-to-day variation.
Using the same approach, the UIC thresholds corre-sponding to the EAR and RDA/RNI in an average popu-lation of 10-year-old girls with a mean weight of 33 kg132
are 94 mg/L and 155 mg/L, respectively (Table 3). If the same IOM formula is applied to the male population with a mean weight of 81 kg110 the estimated EAR-UIC
cut-off is 50 mg/L. Adequate iodine intakes in a male popula-tion would then be defined as a mean/median UIC of>80 mg/L. However, weight is a poor indicator of urine volume and the average urine volume is 1.5 L/day for both men and women.37 The UIC-EAR cut off
corre-sponding to a urine volume of 1.5 L/day would be 57 mg/L for adults. However, the larger the urine volume, the lower the cut-off.
The UIC thresholds outlined here to define the prevalence of ID in an adult population are rough esti-mates calculated for illustrative purposes only. The optimal threshold remains to be defined based on popu-lation studies with actual data. However, the examples illustrate that the UIC threshold of 100 mg/L used by WHO to define ID is likely relevant to define iodine status of the population based on the median/mean UIC, but the 100 mg/L cut-off does not correspond to the EAR for adults. The present WHO threshold is too high to define ID in adult populations and clearly overestimates the prevalence of ID in adults.
At present, there are no UIC thresholds defined to estimate the prevalence of individuals with excessive iodine intakes. An approach similar to the EAR cut-point method may prove useful based on extrapolations from the upper tail of the UIC distribution and the tolerable upper intake level (UL).
The estimated average requirement cut-point method in practice: an example from Switzerland
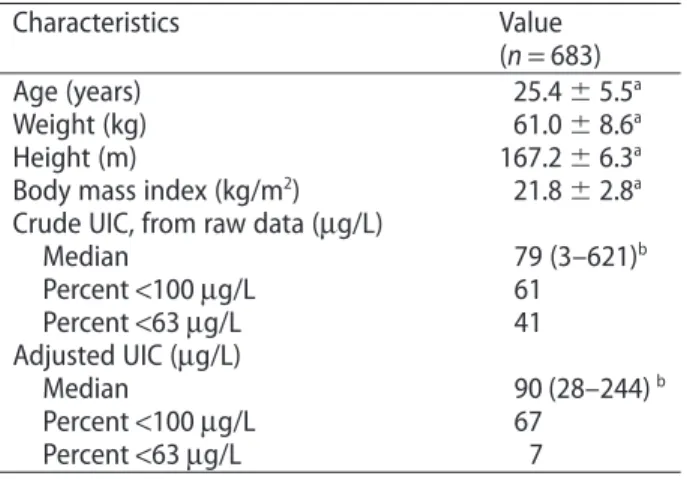
The practical application of the EAR cut-point method is illustrated by data from a cross-sectional convenience sample of 683 healthy young women in the Zurich area of Switzerland133(Table 4).All women provided a single spot
urine sample, and a subsample of 20% of the participants (n = 145) additionally provided a second urine sample. The median UIC was 79 mg/L (n = 683) for the first sample and 70 mg/L (n = 145) for the repeat sample (Figure 6). The UIC distribution of the two separate urine collections was skewed due to high day-to-day varia-tion.31However, since one repeat UIC was available for a
subsample of the study participants, the population-specific intra- and inter-individual variance could be
obtained and used to adjust the UIC distribution to reflect the habitual iodine intake.
We estimated the usual UIC in the study population using the NCI SAS method (SAS Institute, Inc., Cary, NC).123,130,134 The NCI method involves two steps. The
first step is a model for repeated measures (Mixtran macro) obtaining variance estimates and with the possi-bility to include covariates. The second step (Distrib macro) estimates the distribution of usual UIC using the variance from the first step and the prevalence below given thresholds. The NCI method (using the Indivit macro) can also be used to calculate the individual’s esti-mated usual UIC using parameters from the first step.135
The obtained UIC distribution resembled a normal distribution with an adjusted median/mean UIC of 90 mg/L (Figure 6). The proportion of women with a UIC<63 mg/L was 41% in the raw data, but reduced to 7% using the adjusted distribution. This means that 7% of the women have low iodine intakes and are iodine deficient. The proportion of individuals with a UIC<100 mg/L was 61% in the unadjusted and 67% in the adjusted distribu-tion, i.e., the WHO UIC cut-off overestimates the “true” prevalence of ID tenfold for both distributions. The iodine intake estimated from the median UIC of the usual UIC distribution was 135 mg/day, using the IOM formula. To achieve a population distribution with 2–3% below the EAR, the women would need to increase their iodine intake by 10 mg/day, on average, to 145 mg/day (Figure 7). This amount corresponds to the iodine content in one glass of milk.78 The resulting median UIC with extra
10 mg dietary iodine per day is 97 mg/L and agrees well with the WHO cut-off of 100 mg/L. But, as stressed above, the UIC depends on the urine volume and, in adults, the optimal median UIC corresponding to an adequate
Table 4 Urinary iodine concentration values in a
population of young Swiss women.
Characteristics Value
(n= 683)
Age (years) 25.4⫾ 5.5a
Weight (kg) 61.0⫾ 8.6a
Height (m) 167.2⫾ 6.3a
Body mass index (kg/m2) 21.8⫾ 2.8a
Crude UIC, from raw data (mg/L)
Median 79 (3–621)b Percent<100 mg/L 61 Percent<63 mg/L 41 Adjusted UIC (mg/L) Median 90 (28–244)b Percent<100 mg/L 67 Percent<63 mg/L 7 aMean⫾ SD. bMedian (range).
Values represent unpublished UIC data collected in the study by Andersson et al.133
iodine intake has to be revisited. None of the women had usual intakes above the UL, and the data illustrate that a well-functioning salt iodization program like the one in Switzerland can meet the iodine requirements and pose no risk for excessive iodine intakes.
Outlook for application of the EAR cut-point method
Applying the EAR cut-point method to UIC distributions may be a promising approach to improving iodine moni-toring in populations, but it needs to be validated, and studies to do this are underway. Testing of the different methods to adjust UIC distributions and evaluate the sample size and the number of repeated samples needed for adjustment will be conducted. Plans are also in place to validate the UIC distribution against 24-h urine collec-tions, UIE, urine volume, body weight, and dietary intake data in populations with different iodine status and to define the UIC cut-off corresponding to the EAR for dif-ferent age- and population groups. The threshold to define ID will additionally be validated against thyroid function.
Dried blood spot thyroglobulin
The ultimate goal of an iodized salt program is to correct thyroid dysfunction caused by ID in populations, and to ensure adequate thyroid hormone for optimal growth, development, and health. Although a low median UI and/or poor household coverage with iodized salt suggest a population is at higher risk of developing thyroid
dis-orders due to ID, these exposure markers do not provide direct information on thyroid function. A functional biomarker of thyroid status would complement the expo-sure biomarkers and would improve monitoring of ID.
Ideally, a functional biomarker of iodine status should be “field-friendly.” Most thyroid function tests can be measured in just a few drops of blood from a finger or heel stick. Dried blood spots (DBS) on filter paper are increasingly used in health surveys. This collection method eliminates the need for venipuncture and cold chain/refrigeration of specimens; it also simplifies field collection, storage and transport to the laboratory, and usually reduces costs.
Thyroglobulin (Tg) is synthesized only in the thyroid, and is the most abundant intrathyroidal protein. In iodine sufficiency, small amounts of Tg are secreted into the circulation, and serum Tg is normally <10 mg/ L.136In areas of endemic goiter, serum Tg increases due to
greater thyroid cell mass and TSH stimulation (Figure 5). Serum Tg is well correlated with the severity of ID, as measured by UI.137 Intervention studies examining the
potential of Tg as an indicator of response to iodized oil or iodized salt have shown that Tg falls rapidly with iodine repletion138,139and that Tg is a more sensitive
indi-cator of iodine repletion than TSH or T4. However, com-mercially available assays measure serum Tg, which requires venipuncture, centrifugation, and frozen sample transport, which may be difficult in remote areas.
A new assay for Tg has been developed for DBS, thereby simplifying collection and transport.139 In
pro-spective studies, DBS Tg has been shown to be a sensitive measure of iodine status and reflects improved thyroid function within several months after iodine reple-tion.139,140The method is simple and robust. A drop of
blood from a finger stick (or a venipuncture sample) is spotted onto filter paper and the spots are allowed to dry at room temperature before being stored in sealed low-density polyethylene bags; the bags are preferably refrig-erated at 4°C, but they can also be stored for several weeks at cool, dry room temperatures before analysis.
Standard reference material for the DBS-Tg assay is now available and DBS-Tg is stable when stored for up to 1 year at temperaturesⱕ -20°C.140An international
ref-erence range has been established in iodine-sufficient 5–14-year-old children that can be used for monitoring iodine nutrition.140 The DBS-Tg reference interval for
iodine-sufficient school-age children is 4–40 mg/L.17
WHO now recommends DBS Tg for the monitoring of iodine status in SAC.17However, several questions need
to be resolved before Tg can be widely adopted as an indicator of iodine status. First, it is unclear how the WHO reference range should be applied in the context of population iodine monitoring, and how varying severity of ID in populations affects the distribution of DBS Tg Figure 7 Cumulative probability of iodine deficiency
in young Swiss women at present borderline low iodine intakes and after a theoretical increase of 10mg/
day to an overall adequate iodine intake. UIC curves
represent measured and adjusted usual UIC (n= 683). The estimated UIC cutoff corresponds to the estimated average requirement.