HAL Id: tel-03139953
https://tel.archives-ouvertes.fr/tel-03139953
Submitted on 12 Feb 2021HAL is a multi-disciplinary open access archive for the deposit and dissemination of sci-entific research documents, whether they are pub-lished or not. The documents may come from teaching and research institutions in France or abroad, or from public or private research centers.
L’archive ouverte pluridisciplinaire HAL, est destinée au dépôt et à la diffusion de documents scientifiques de niveau recherche, publiés ou non, émanant des établissements d’enseignement et de recherche français ou étrangers, des laboratoires publics ou privés.
Virus-host interactions across a soil pH gradient at the
community and individual scale
Sungeun Lee
To cite this version:
Sungeun Lee. Virus-host interactions across a soil pH gradient at the community and individual scale. Autre. Université de Lyon, 2020. Français. �NNT : 2020LYSEC020�. �tel-03139953�
THÈSE
Présentée devant :
ÉCOLE CENTRALE DE LYON
Pour obtenir le grade de :
DOCTEUR
De l'école doctorale :
Électronique, électrotechnique, automatique
UNIVERSITÉ DE LYON
Spécialité : Ingénierie pour le vivant
Par
Sungeun LEE
Virus-host interactions across a soil pH gradient at the community
and individual scale
soutenue le 23 Septembre 2020 devant le jury composé de:
Graeme W. NICOL
Directeur de Thèse
Professeur, Ecole Centrale de Lyon, Ecully, France
Christina HAZARD
Co-directeur de Thèse
Docteur, Ecole Centrale de Lyon, Ecully, France
Michael DUBOW
Rapporteur
Professeur, Institut de Biologie Intégrative de la Cellule, Gif-sur-Yvette, France
Tim URICH
Rapporteur
Professeur, Universitat Greifswald, City, Allemagne
Sophie ABBY
Examinateur
Docteur, Laboratoire TIMC-IMAG, La Tronche, France
Joanne EMERSON
Examinateur
Assistant Professeur, University of California, Davis, CA, Etats-Unis
Timothy M. VOGEL
Examinateur
Professeur, Université Claude Bernard Lyon 1, Ecole Centrale de Lyon, Ecully, France
N° d’ordre NNT : 2020LYSEC20
Acknowledgments
First of all, I would like to thank my great supervisors Dr. Christina HAZARD and Prof. Graeme W. NICOL for kindly answering my many questions with their scientific expertise and for their patience, support, valuable advice and endless encouragement through the years, as well as for the many fortuitous research opportunities.
I would also like to thank my adviser Prof. Timothy M. VOGEL who taught us how to be a critical scientist and for introducing me to Dr. Christina HAZARD.
I thank the members of my PhD jury, Joanne EMERSON, Michael DUBOW, Sophie ABBY, Tim URICH and Timothy VOGEL for evaluating my work. I would like to thank Marie ROBIN and Rosaria FERRIGNO for the committee meetings. I would also like to acknowledge all of my past and present colleagues at the Laboratoire Ampère, Ecole Centrale de Lyon: Romie, Concepcion, Rose, Benoı̂t, Adrien, Arthur, Eva, Marion, all fellow PhD students, as well as Cécile, Laure, Christoph, Catherine, Pascal, Sébastien, Richard, Gilles, David, Alexiane and Agathe who have given me advice, support and friendship over the years. I would particularly like to thank Romie who always motivated me and for our many stimulating conversations, Concepcion for our co-working days with many discussions and Christoph for his sequencing help. A special thanks to Laure for her valuable feedback for manipulating soil viruses. I also thank Edith who supported me a lot with their smile. I thank Laurent POUILLOUX for his patience and help with solving server and computing problems.
I wish to thank the team of the Mary Firestone Lab, University of Berkeley for fruitful and fascinating collaborations, especially Alexa NICOLAS, Ella SIERADZKI and Mary K. FIRESTONE for their welcome during our visit. Also, thanks to Lucas P. P. BRAGA and Laurent PHILLIPOT from INRAE in Dijon for teaching me virus infection assay methods, and the crew of the Centre d'Imagerie Quantitative Lyon-Est (CIQLE) from the University of Lyon, Elisabeth ERRAZURIZ-CERDA who helped me with TEM. Thank you to Dr. Robin Walker at SRUC Craibstone Aberdeen for access to the pH plots at the Woodlands Field Experiment. I am very grateful to the AXA Research Fund, the France Berkeley fund and the JGI CSP program for supporting this work. Finally, I thank my family, my dad and uncle in heaven, my aunt and my husband Tommy who always stands by my side and my mom who has always encouraged me with her endless love.
Abstract
Soil viruses have potential to influence microbial community structure and subsequent ecosystem functioning by directly affecting the abundance of host cells by lysis and through their ability to transfer genes between hosts. Although our understanding of soil viral diversity and functioning has increased, the role of viruses and their interactions with prokaryotes in soil is limited. To gain a better understanding of virus-host interactions in soil, a long-term pH-manipulated soil gradient, which microbial community structure changes across, was investigated. The main objectives of this thesis were to 1) determine the influence of microbial community structure and soil pH on viruses using metagenomics and viromics (Chapter II), 2) determine the infectivity of soil viral populations from co-localized and foreign pH soil niches using a plaque assay approach combined with hybrid metagenomics sequencing (Chapter III) and 3) identify virus populations infecting specific soil microbial functional groups, specifically methanotrophs (Chapter IV) and nitrifiers (Chapter V), using DNA stable isotope probing combined with metagenomic deep sequencing. Viral community structure was found to change with soil pH, demonstrating that viral communities are tightly linked to host populations, but also may have narrow host ranges. Analysis of clustered regularly interspaced short palindromic repeats (CRISPR) arrays revealed dynamic virus-host interactions, with the number and size of CRISPR arrays distinct across contrasting pH soil. Profiling of the host-virus linkages between soil pH, suggests that viruses play a critical role in shaping the composition and function of the soil prokaryotic community. Surprisingly, greater infectivity of a host bacterium by virus populations was found when viruses and host bacterium were not co-localized in the same pH soil. Coevolutionary processes between the host and virus populations, such as restriction modification/virus-encoded methyltransferase and CRISPR-Cas system/spacer mutation, provide evidence for local adaptation, and that virus-bacterial host interactions play an integral part in the susceptibility of a host to infection and consequently in the regulation of soil bacterial populations. Targeting specific microbial functional groups via stable isotope probing allowed analysis of individual host-virus populations. Tracking carbon flow through prokaryotic and viral populations revealed active interactions between viruses and methanotroph and nitrifier hosts, and soil pH niche preferences. Evidence of horizontal gene transfer and virus-encoded auxiliary metabolic genes, such as glycoside hydrolase families, peptidases, particulate methane monooxygenase subunit C (pmoC), nitrogenase (nifH) and cytochrome cd1-nitrite reductase, supports that viruses are significant contributors to host functioning and carbon and nitrogen cycling in soil. Overall, this work demonstrated that soil viruses are important regulators of microbial communities through specific host lysis and dynamic virus-host interactions.Table of Contents
Acknowledgments ... i Abstract ... ii Table of Contents ... iii List of Figures ... viii List of Tables ... xi List of Supplementary Tables and Figures ... xii Abbreviations ... xiii CHAPTER I. General introduction: Viruses, host interactions and the use of metagenomic approaches to understand their ecology ... 1 1.1. Overview ... 2 1.1.1. Biology of viruses and their life cycle ... 2 1.1.2. Abundance and diversity of prokaryotic viruses in soil ... 3 1.1.3. Virus-host interactions ... 5 1.1.3.1. Interactions between bacteria and viruses ... 5 1.1.3.2. Interactions between archaea and viruses ... 6 1.1.3.3. The co-evolution ‘arms race’ between host cells and viruses ... 7 1.1.3.4. Auxiliary metabolic genes ... 9 1.2. Using metagenomics for studying viral communities in soil ... 9 1.2.1. Metagenomics ... 9 1.2.2. High throughput sequencing ... 10 1.2.3. Bioinformatic tools used in metagenomic analyses ... 10 1.2.3.1. Quality trimming ... 10 1.2.3.2. Contig assembly ... 11 1.2.3.3. Binning ... 11 1.2.3.4. Functional and taxonomic annotation of assembled contigs or bins ... 12 1.2.3.5. Quantification of bins or specific genes ... 13 1.2.4. Virus sequence analyses ... 13 1.2.4.1. Virus prediction ... 14 1.2.4.2. Virus populations ... 14 1.2.4.3. Virus-host linkage ... 15 1.2.5. High performance computing ... 16 1.3. The model soil pH gradient ... 17 1.4. Overview of research aims ... 18 CHAPTER II. Prokaryotic and viral community structure, functional diversity and host-virus interactions in contrasting pH soils ... 20 2.1. Abstract ... 21 2.2. Introduction ... 21 2.3. Materials and Methods ... 24 2.3.1. Soil sampling and physicochemical analyses ... 24 2.3.2. Virus isolation from soil samples ... 24 2.3.3. DNA extraction and sequencing ... 25 2.3.4. Bioinformatic analyses of metagenomes and viromes ... 26 2.3.4.1. Sequence quality filtering, contig assembly and annotation ... 28 2.3.4.2. Comparison of viral recovery between metagenomes and viromes ... 28 2.3.4.3. Analysis of microbial and viral diversity and community structure ... 292.3.4.4. Functional comparative analysis of metagenomes and viromes ... 30 2.3.4.5. Linking viruses to hosts using CRISPR array and ONF analysis ... 30 2.3.4.6. Analysis of gene homology ... 31 2.4. Results ... 31 2.4.1. Sequence summary of metagenomes and viromes ... 31 2.4.2. Comparison of viral recovery between metagenomes and viromes ... 32 2.4.3. Microbial and viral diversity and community structure ... 35 2.4.4. Comparison of functional diversity between metagenomes and viromes ... 47 2.4.5. Host-virus linkage ... 49 2.4.5.1. CRISPR array analysis ... 49 2.4.5.2. ONF analysis ... 49 2.4.6. Gene homology ... 53 2.4.6.1. Auxiliary metabolic genes ... 53 2.4.6.2. Gene homology between viruses and their associated hosts ... 55 2.4.6.3. Gene homology of host-linked viruses to other prokaryotes ... 62 2.4. Discussion ... 64 2.5. Conclusion ... 67 CHAPTER III. Diversity and abundance of viral populations across a soil pH gradient that infect an individual host ... 68 3.1. Abstract ... 69 3.2. Introduction ... 69 3.3. Materials and Methods ... 72 3.3.1. Soil sampling and physicochemical analyses ... 72 3.3.2. Isolation of plaque-forming bacteria ... 72 3.3.3. Enrichment of virus populations ... 73 3.3.4. Plaque assay ... 73 3.3.5. Visualization of virus populations by transmission electron microscopy ... 74 3.3.6. Hybrid sequencing of host bacterium and virus populations ... 74 3.3.7. Bioinformatic analyses ... 75 3.3.7.1. Genomic analysis of host bacterium ... 75 3.3.7.2. Metagenomic analysis of virus populations ... 76 3.3.7.3. Analysis of horizontal gene transfer ... 77 3.4. Results ... 77 3.4.1. Infectivity of virus populations across the soil pH gradient ... 77 3.4.2. Morphology of virus populations ... 79 3.4.3. Bacillus sp. S4 genome ... 80 3.4.4. Virus populations ... 82 3.4.5. Horizontal gene transfer ... 90 3.5. Discussion ... 91 3.6. Conclusion ... 94 CHAPTER IV. Linking virus-host interactions in a methane-fueled trophic network using stable-isotope probing ... 95 4.1. Abstract ... 96 4.2. Introduction ... 96 4.3. Materials and Methods ... 99 4.3.1. Soil sampling and physicochemical analyses ... 99 4.3.2. Soil microcosm incubations ... 102
4.3.3. DNA extraction and density gradient centrifugation ... 102 4.3.4. Quantitative PCR and metagenomic sequencing ... 102 4.3.5. Bioinformatic analyses ... 103 4.3.5.1. Sequence quality filtering, contig assembly and co-assembly ... 103 4.3.5.2. Metagenomic assembled genomes ... 105 4.3.5.3. Virus prediction ... 105 4.3.5.4. Linking viruses to hosts using CRISPR array and ONF analysis ... 106 4.3.5.5. Analysis of gene homology ... 106 4.4. Results ... 107 4.4.1. Distribution of prokaryotic genomes in DNA-SIP fractions ... 107 4.4.2. Summary of metagenome sequencing ... 109 4.4.3. Metagenomic community structure ... 109 4.4.4. Metagenomic assembled genomes ... 112 4.4.5. Virus prediction ... 116 4.4.6. Host-virus linkage ... 117 4.4.6.1. CRISPR array analysis ... 117 4.4.6.2. ONF analysis ... 122 4.4.7. Gene homology ... 123 4.4.7.1. Auxiliary metabolic genes ... 123 4.4.7.2. Gene homology between viruses and their associated hosts ... 124 4.4.7.3. Gene homology of host-linked viruses to other prokaryotes ... 131 4.4.7.4. Gene homology between methanotroph-associated viruses ... 133 4.4.8. Soil microbial food web ... 134 4.5. Discussion ... 137 4.6. Conclusion ... 139 CHAPTER V. Linking viruses to autotrophic nitrifier hosts in acidic and neutral pH soils using DNA stable-isotope probing with 13CO2 ... 141 5.1. Abstract ... 142 5.2. Introduction ... 142 5.3. Materials and Methods ... 144 5.3.1. Soil sampling and physicochemical analyses ... 144 5.3.2. Soil microcosm incubations ... 144 5.3.3. Nitrification assay ... 145 5.3.4. DNA extraction and density gradient centrifugation ... 145 5.3.5. Real-time quantitative PCR and metagenomic sequencing ... 146 5.3.6. Bioinformatic analyses ... 146 5.3.6.1. Sequence quality filtering, contig assembly and co-assembly ... 146 5.3.6.2. Metagenomic assembled genomes ... 148 5.3.6.3. Analysis of %GC coverage and selection of 13C-enriched populations ... 148 5.3.6.4. Virus prediction ... 149 5.3.6.5. Linking viruses to hosts using CRISPR array and ONF analysis ... 149 5.3.6.6. Analysis of gene homology ... 150 5.4. Results ... 150 5.4.1. Nitrification in soil microcosms ... 150 5.4.2. Distribution of prokaryotic communities in DNA-SIP fractions ... 151 5.4.3. Summary of metagenome sequencing ... 153 5.4.4. Metagenomic assembled genomes ... 153 5.4.5. 13C-enriched populations ... 157
5.4.6. Virus prediction ... 166 5.4.7. Host-virus linkage ... 167 5.4.7.1. CRISPR array analysis ... 167 5.4.7.2. ONF analysis ... 167 5.4.8. Gene homology ... 172 5.4.8.1. Auxiliary metabolic genes ... 172 5.4.8.2. Gene homology between viruses and their associated nitrifier hosts ... 172 5.4.8.3. Gene homology of host-linked viruses to other prokaryotes ... 174 5.4.8.4. Gene homology between nitrifier-associated viruses ... 175 5.4.9. Distribution of the nitrifier-associated viruses across soil pH ... 178 5.5. Discussion ... 180 5.6. Conclusion ... 183 CHAPTER VI. General discussion: Host-virus interactions in soil ... 184 6.1. Overview ... 185 6.2. Challenges in soil virus metagenomics ... 185 6.3. Virus host dynamics in soil ... 190 6.4. Virus host-ranges ... 192 6.5. Auxiliary metabolic genes ... 193 6.6. Critique of experiments and future work ... 194 6.7. Conclusion ... 195 Synthèse en français ... 197 Résumé ... 198 Introduction générale : Les virus, les interactions hôte-virus et l’approche métagénomique pour comprendre leurs écologie ... 199 1.1. Contexte ... 200 1.1.1. Biologie des virus et cycle de vie des virus ... 200 1.1.2. Abondance et diversité des virus infectant les procaryotes dans le sol ... 202 1.1.3. Interactions virus-hôte ... 203 1.1.3.1. Interactions entre les bactéries et les bactériophages ... 204
1.1.3.2. Interactions entre les archées et les virus d’archées ... 205
1.1.3.3. "Course à l’armement" entre les cellules hôtes et les virus ... 206 1.1.3.4. Gènes métaboliques auxiliaires ... 208 1.2. Approche métagénomique pour l'étude des communautés virales du sol ... 208 1.2.1. Métagénomique ... 208 1.2.2. Séquençage à haut débit ... 209 1.2.3. Bio-informatiques utilisées pour les analyses métagénomiques ... 209 1.2.3.1. Contrôle de la qualité des données de séquençage ... 210 1.2.3.2. Assemblage des séquences ... 210 1.2.3.3. Binning ... 211 1.2.3.4. Annotation taxonomique et fonctionnelle des contigs ou des bins ... 211 1.2.3.5. Quantification des bins ou des gènes spécifiques ... 213 1.2.4. Analyses des séquences virales ... 213 1.2.4.1. Prédiction des contigs viraux ... 213 1.2.4.2. Populations virales ... 214
1.2.5. Calcul haute performance ... 216 1.3. Modèle de gradient de pH du sol ... 217 1.4. Objectifs de la recherche ... 218 Discussion générale : Interactions hôte-virus dans le sol ... 221 2.1. Vue d'ensemble ... 222 2.2. Défis de la métagénomique des virus du sol ... 223 2.3. Dynamique des virus-hôtes dans le sol ... 226 2.4. Gammes d'hôtes du virus ... 229 2.5. Gènes métaboliques auxiliaires ... 230 2.6. Perspectives des expériences ... 231 2.7. Conclusion ... 233 References ... 234 Appendix (Supplementary tables and figures) ... 260
List of Figures
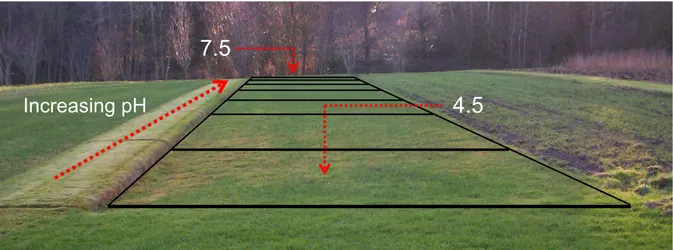
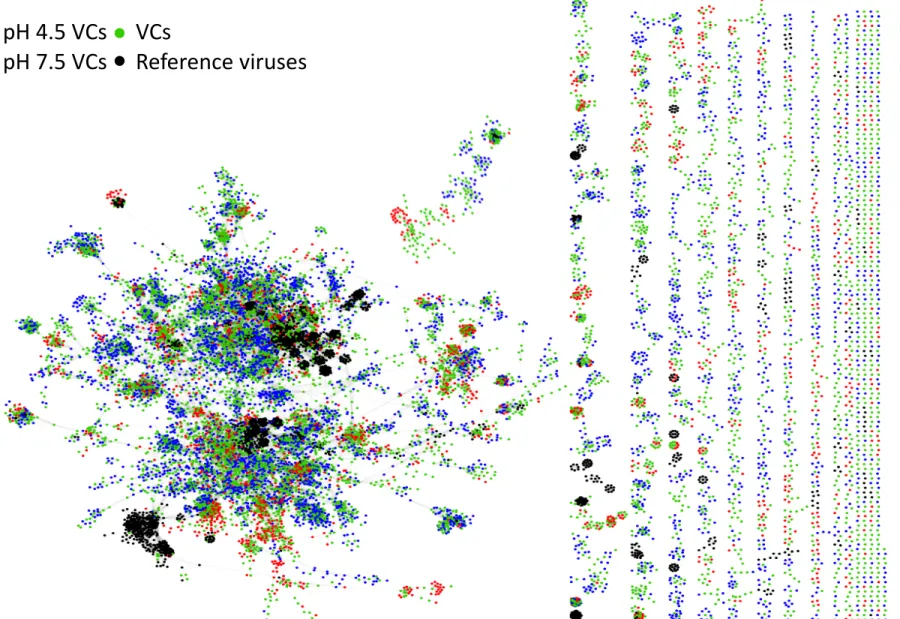
Chapter I Figure 1.1. Schematic representation of the lytic and lysogenic cycles. ... 3 Figure 1.2. Schematic representation of the CRISPR/Cas mechanism. ... 8 Figure 1.3. Craibstone pH-controlled plots at the Scottish Agricultural College, Scotland. ... 18 Chapter II Figure 2.1. Schematic overview of the bioinformatics workflow. ... 27 Figure 2.2. Venn diagram showing the number of metagenomic viral contigs (mVCs) from the pH 4.5 and 7.5 soil found in the viral contigs (VCs) databases. ... 34 Figure 2.3. Taxonomic annotation of the metagenomic viral contigs (mVCs) that were not found in the viral contigs (VCs) databases. ... 34 Figure 2.4. Taxonomic annotation of the pH 4.5 and 7.5 soil metagenomes ... 36 Figure 2.5. Relative abundance of the pH 4.5 and 7.5 soil microbial communities ... 37 Figure 2.6. Microbial diversity, a) Shannon’s index and b) Simpson’s index, and c) Richness of the pH 4.5 and 7.5 soil metagenomes. ... 38 Figure 2.7. The normalized relative abundance of metagenomic contigs (MCs) in the pH 4.5 and 7.5 soil metagenomes. ... 39 Figure 2.8. Relative abundance of the unique metagenomic contigs (MCs) in the pH 4.5 and 7.5 soil metagenomes. ... 40 Figure 2.9. Taxonomic annotation of the virome contigs (VCs) from the pH 4.5 and 7.5 soils ... 41 Figure 2.10. Network of shared predicted protein content among the specific pH 4.5 and 7.5 viral contigs (VCs), non-pH specific VCs and reference viruses. ... 42 Figure 2.11. Viral diversity, a) Shannon’s index, b) Simpson’s index, and c) Richness, of the pH 4.5 and 7.5 soil. ... 43 Figure 2.12. The relative abundance of virome contigs (VCs) in the pH 4.5 and 7.5 soils. ... 44Figure 2.13. Non-metric multidimensional scaling plot of the a) microbial and b) viral communities of the pH 4.5 and 7.5 soil. ... 45 Figure 2.14. %GC – coverage plots of the prokaryotic, viral populations and host-virus linked populations in the pH 4.5 and 7.5 soil replicates. ... 46 Figure 2.15. Relative abundance of the COG categories of metagenomes and viromes from pH 4.5 and 7.5 soil. ... 48 Figure 2.16. Number of genes coding for glycoside hydrolase (GH) families and peptidases in the viral contigs (VCs) of the assembled pH 4.5 and 7.5 viromes, and the VCs of the co-assembled viromes. ... 55
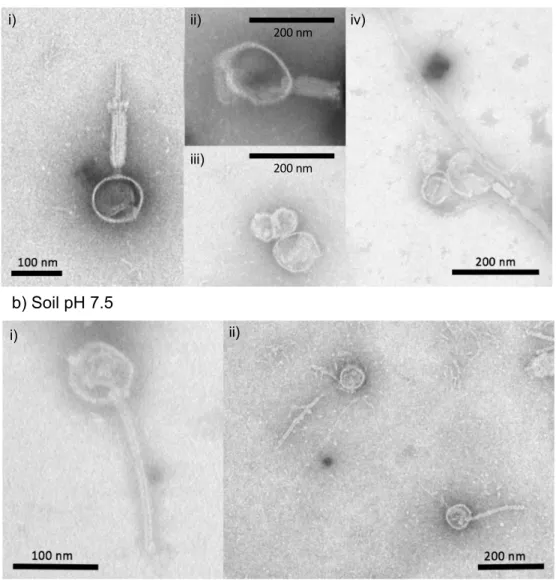
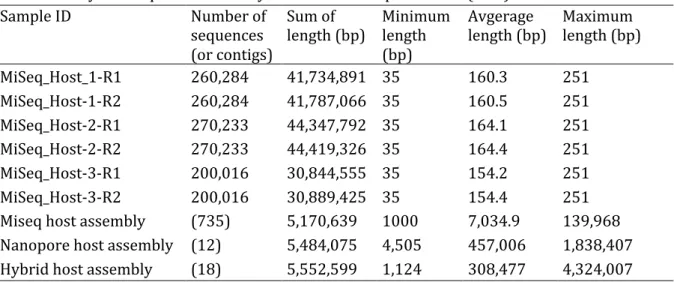
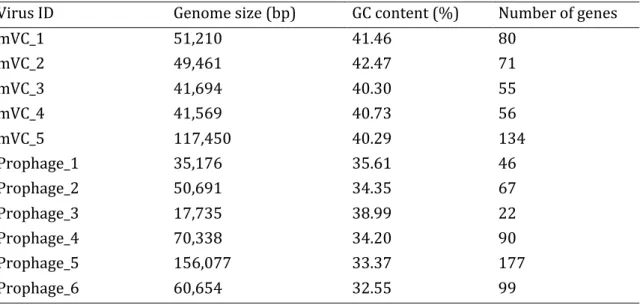
Chapter III Figure 3.1. Image of formed plaques in petri dishes containing virus populations from the pH 4.5 and pH 7.5 soil. ... 78 Figure 3.2. Quantification of plaque-forming units derived from the virus populations of pH 4.5, 5.5, 6.5 and 7.5 soil that infected Bacillus sp. S4 strain. ... 79 Figure 3.3. Transmission electron microscopy images of viral particles that infected the Bacillus sp. S4 strain from the pH 4.5 and 7.5 soil. ... 80 Figure 3.4. Predicted CRISPR array in the genome of the Bacillus sp. S4 strain. ... 82
Figure 3.5. Proteomic tree showing the five lytic viruses and six prophages that infected the Bacillus sp. S4 strain with the most closely related reference viral genomes. ... 86
Figure 3.6. Genome map of the lytic virus populations (mVCs) of Bacillus sp. S4. ... 87
Figure 3.7. Genome map of the prophages of Bacillus sp. S4. ... 88
Figure 3.8. Normalized relative abundance of lytic viruses and prophages across the soil pH gradient. ... 89 Chapter IV Figure 4.1. Schematic overview of the experimental workflow. ... 101 Figure 4.2. Schematic overview of the bioinformatics workflow. ... 104 Figure 4.3. Distribution of the prokaryotic 16S rRNA and pmoA gene copy numbers across the entire buoyant density gradient of the fractionated DNA derived from pH 4.5 and 7.5 soils incubated with either 12C-CH4 or 13C-CH4 for 30 days. ... 108
Figure 4.4. Relative abundance of the most abundant taxa from the co-assembled contigs of the pH 4.5 and pH 7.5 soil metagenomes. ... 110 Figure 4.5. Taxon annotated %GC coverage plots of the co-assembled contigs from the pH 4.5 and 7.5 soil metagenomes. ... 111 Figure 4.6. Normalized relative abundance of the metagenomic assembled genomes in the pH 4.5 and pH 7.5 soil metagenomes. ... 114 Figure 4.7. Contig-GC coverage plots of the metagenomic assembled genomes from the pH 4.5 and 7.5 soil metagenomes. ... 115 Figure 4.8. Normalized relative abundance of 13C-enriched metagenomic viral contigs (mVCs) and prophages in the pH 4.5 and 7.5 soil. ... 116
Figure 4.9. Taxonomic annotation of all 13C-enriched metagenomic viral contigs (mVCs) and prophages of the pH 4.5 and 7.5 soil. ... 117
Figure 4.10. CRISPR arrays screened from a) bin.2_Methylosinus, b) bin.14_Methylocystis and c) bin.21_Methylocystis. ... 119
Figure 4.11. Proteomic tree containing the six methanotroph-associated metagenomic viral contigs (mVCs) with the most closely related reference viruses. ... 120 Figure 4.12. Normalized relative abundance of the hosts (bin) and associated viruses (mVCs) in the pH 4.5 and 7.5 soil. ... 121 Figure 4.13. Two examples of metagenomic viral contigs (mVCs) that contain auxiliary metabolic genes (AMGs) involved in the methane oxidation. ... 124 Figure 4.14. Network analysis showing homologous auxiliary metabolic genes (AMGs) of the six methanotroph-associated metagenomic viral contigs (mVCs) with their hosts. ... 126 Figure 4.15. Genome map of the six metagenomic viral contigs (mVCs) ... 133 Figure 4.16. Microbial food web in the soil established by following 13C-carbon flow. ... 135 Figure 4.17. Virus – host linkage based on CRISPR array and ONF analysis. ... 136
Chapter V
Figure 5.1. Schematic overview of the bioinformatics workflow. ... 147 Figure 5.2. Concentration of a) ammonium and b) nitrate in the pH 4.5 and 7.5 soil microcosms
across 30 days of incubation. ... 151 Figure 5.3. Distribution of the prokaryotic 16S rRNA, archaeal and bacterial amoA gene copy numbers across the entire buoyant density gradient of the fractionated DNA derived from pH 4.5 and 7.5 soil incubated with either 12C-CO2 or 13C-CO2 for 30 days. ... 152 Figure 5.4. GC – coverage plots of the metagenomic assembled genomes (MAGs) for the 12C- and 13C-pH 4.5 and 7.5 soil. ... 155 Figure 5.5. Normalized relative abundance of the metagenomic assembled genomes (MAGs) of the 12C- and 13C-pH 4.5 and 7.5 soil. ... 156 Figure 5.6. Taxon annotated GC – coverage plots of the co-assembled contigs across the 12C and 13C-samples of the pH 4.5 and 7.5 soil. ... 159 Figure 5.7. Relative abundance of the annotated contigs for the 12C- and 13C-pH 4.5 and 7.5 soil. ... 160 Figure 5.8. Relative abundance of the nitrifying community for the 12C- and 13C-pH 4.5 and 7.5
soil. ... 161 Figure 5.9. Non-metric multidimensional scaling plots of a) total, b)% GC < 50 and c) 50 <% GC < 63 populations of the 12C- and 13C-pH 4.5 and 7.5 soil. ... 163 Figure 5.10. Relative abundance of nitrifiers in the% GC < 50 population of the 12C- and 13C-pH 4.5 and 7.5 soil. ... 164 Figure 5.11. Relative abundance of nitrifiers in the 50 <% GC < 63 population of the 12C- and 13 C-pH 4.5 and 7.5 soil. ... 165 Figure 5.12. Normalized relative abundance of metagenomic viral contigs (mVCs) of the 12C- and 13C-pH 4.5 and 7.5 soil. ... 166 Figure 5.13. Taxonomic annotation of the metagenomic viral contigs (mVCs) of the 12C- and 13 C-pH 4.5 and 7.5 soil. ... 167 Figure 5.14. Proteomic tree containing the 15 nitrifier-associated metagenomic viral contigs (mVCs) with the most closely related reference viral genomes. ... 171 Figure 5.15. Genome map of the AOA-associated metagenomic viral contigs (mVCs). ... 176 Figure 5.16. Genome map comparing soil AOA-associated viral contig derived from soil viromes with short AOA-associated metagenomic viral contigs (mVCs). ... 177 Figure 5.17. Genome map of the NOB-associated metagenomic viral contigs. ... 178 Figure 5.18. Relative abundance of representative enriched metagenomic viral contigs (mVCs) of the 12C- and 13C-pH 4.5 and 7.5 soil. ... 179
Chapter VI
Figure 6.1. Network of shared predicted protein content among pH gradient co-assembled
viromes, viral contigs from pH 4.5 and pH 7.5, predicted metagenomic viral contigs from CH4-SIP
and CO2-SIP metagenomes and RefSeq prokaryotic viral genomes. ... 189
List of Tables
Chapter I. Table 1.1. Information about the reference databases. ... 12 Chapter II. Table 2.1. Sequencing summary data of pH 4.5 and 7.5 soil metagenomes and viromes. ... 32 Table 2.2. Assembly summary data of pH 4.5 and 7.5 viromes ... 32Table 2.3. Number of predicted viral contigs from the pH 4.5 and 7.5 soil metagenomes and viromes. ... 33 Table 2.4. Summary data of the CRISPR array analysis. ... 50 Table 2.5. Spacer sequences matching to viral contigs (VC). ... 51 Table 2.6. Direct repeat (DR) sequences matching to metagenomic contigs (MC). ... 52 Table 2.7. Virus- host linkage between co-assembled viral contigs (VCs) and prokaryotic contigs of the soil metagenomes. ... 53 Table 2.8. Gene homology between the WIsH predicted viral contigs (VC) and host metagenomic contigs (MC). ... 56 Table 2.9. Gene homology of the viral contig (VC) with the same genus as their predicted host. ... 62 Chapter III. Table 3.1. Hybrid sequence summary for the Bacillus sp. S4 strain. ... 81 Table 3.2. Read mapping of 16S rRNA sequences of soil pH gradient to the 16S rRNA gene of the Bacillus sp. S4 strain. ... 81 Table 3.3. Host genes coding for enzymes involved in restriction-modification systems. ... 82 Table 3.4. Hybrid sequence summary for the infecting virus populations from the pH 4.5, 5.5, 6.5 and 7.5 soil. ... 84 Table 3.5. Lytic viruses that infected the Bacillus sp. S4 strain and identified prophages. ... 85 Table 3.6. Genes involved in viral counterdefense mechanisms that were found within the viruses infecting Bacillus sp. S4 strain. ... 86 Table 3.7. Protein assignment of viral genes to the Bacillus sp. S4 strain. ... 90 Chapter IV. Table 4.1. Sequence summary for the 13C-pH 4.5 and 7.5 soil metagenomes. ... 109 Table 4.2. Summary statistics, taxonomic classification and presence of the MMO enzyme for the metagenomic assembled genomes (MAGs). ... 112
Table 4.3. Genetic information of the methanotroph-associated metagenomic viral contigs (mVCs). ... 118
Table 4.4. Host-virus linkages. ... 122
Table 4.5. Gene homology of the six methanotroph-associated mVCs, determined through CRISPR array analysis, to host metagenomic assembled genomes (MAGs). ... 125
Table 4.6. Protein assignment of viral genes to the methanotroph metagenomic assembled genomes (MAGs). ... 127
Table 4.7. Gene homology of the methanotroph-associated metagenomic viral contigs (mVCs) to host contigs and bins, and database prokaryote taxa of the same genera. ... 129
Table 4.8. Gene homology of the six methanotroph-associated metagenomic viral contigs (mVCs) to database prokaryotes. ... 131
Chapter V.
Table 5.1. Sequence summary for the 12C- and 13C-pH 4.5 and 7.5 soil metagenomes. ... 153 Table 5.2. Summary statistics and taxonomic classification of the metagenomic assembled genomes (MAGs). ... 154 Table 5.3. Sequence summary information for the% GC < 50 population. ... 162 Table 5.4. Sequence summary information for the 50 <% GC < 63 population. ... 162 Table 5.5. Summary information of the predicted nitrifier-associated metagenomic viral contigs (mVCs) and their host contigs. ... 169 Table 5.6. Summary information of the predicted ammonia-oxidizing archaea (AOA)-associated metagenomic viral contigs (mVCs) and their host contigs of the% GC < 50 population. ... 170
Table 5.7. Gene homology between nitrifier host contigs and associated metagenomic viral contigs (mVCs). ... 173 Table 5.8. Gene homology between the nitrifier-associated metagenomic viral contigs (mVCs) and database prokaryotes with the same taxa as the host and those of ammonia oxidizers (AO). ... 175
List of Supplementary Tables and Figures
Supplementary Table 2.1. Summary statistics of the metagenomic assembled genomes. ... 294 Supplementary Table 2.2. Auxiliary metabolic genes (AMGs) of viral contigs (VCs) encoding for the glycoside hydrolase families and peptidases. ... 294 Supplementary Table 2.3. Auxiliary metabolic genes (AMGs) of viral contigs (VCs) encoding for ATPase, ABC transporter and other membrane transporters. ... 296 Supplementary Table 3.1. Soil pH and moisture content across the soil pH gradient. ... 298 Supplementary Table 3.2. Gene annotation of the metagenomic viral contigs (mVCs) and prophages. ... 298 Supplementary Figure 3.1. Impact of soil pH (4.5 and 7.5) and growth stages (exponential phase and grown overnight) on the growth of Bacillus sp. S4 strain. ... 300 Supplementary Figure 3.2. KEGG pathway reconstructions of Bacillus sp. S4 strain. ... 300 Supplementary Table 4.1. Spacer sequences matching to VirSorter predicted metagenomic viral contigs (mVCs). ... 301 Supplementary Table 4.2. Taxonomic annotation of the contigs that contained CRISPR arrays. ... 310 Supplementary Table 4.3. BLASTp alignment between protein sequences of metagenomic assembled genomes (MAGs) and protein sequences from methanotroph-associated metagenomic viral contigs (mVCs). ... 311 Supplementary Table 4.4. Gene annotation of the metagenomic viral contigs (mVCs) that were linked to metagenomic assembled genomes (MAGs) via CRISPR arrays. ... 314 Supplementary Table 4.5. Host-virus linkage using the WIsH tool. ... 324 Supplementary Table 5.1. Summary information for the metagenomic viral contigs (mVCs) and their predicted host contigs using the WIsH tool. ... 333 Supplementary Table 5.2. Gene homology of nitrifier-associated metagenomic viral contigs (mVCs) against the NCBI nr and Interproscan 5 database. ... 337Abbreviations
General abbreviations Organisms 13C: carbon-13 AO: Ammonia oxidizer ANI: Average nucleotide identity AOA: Ammonia oxidizing archaea AT: Adenine tymine AOB: Ammonia oxidizing bacteria ATP: Adenosine triphosphate Ca.: Candidatus BLAST: Basic local alignment search tool Comammox: complete ammonia oxidizers C: Carbon MOB: Methane oxidizing bacteria CH4: Methane NOB: Nitrite oxidizing bacteria CO2: Carbon dioxide NSV: Nitrosopumilus spindle-shaped virus CRISPR: Clustered Regularly Interspaced Short Palindromic Repeats sp.: species DB: Database DNA: Deoxyribonucleic acid Genes or proteins SIP: Stable isotope probing 16S rRNA: 16S ribosomal RNA dNTP: Deoxyribonucleotide triphosphate AMO: Ammonia monooxygenase DR: Direct repeat amoA: gene encoding alpha subunit of AMO ds: double stranded GH: Glycoside Hydrolase dTMP: deoxythymidine monophosphate MDH: Methanol dedydrogenase FAD: Flavin adenine dinucleotide MMO: Methane monooxygenase GC: Guanine cytosine NXR: Nitrite oxidoreductase H: Hydrogen pMMO: Particular methane monooxygenase HMM: Hidden Markov model pmoA: gene encoding alpha subunit of pMMO ICTV: International Committee on Taxonomy of Viruses sMMO: soluble methane monooxygenase JGI: Joint Genome Institute MAG: Metagenomic assembled genome Chemical buffers MC: Metagenomic contig APC: amended potassium citrate Mtase: Methyltransferase CsCl: Cesium chloride mVC: metagenomic viral contigs CTAB: cetyltrimethylammonium bromide N: Nitrogen PC: Potassium citrate PEG: polyethylene glycerol N2O: Nitrous oxide SDS: sodium dodecyl sulfate NAD: Nicotinamide adenine dinucleotide SM: Storage medium NC: Negative Control SP: Sodium pyrophosphage NCBI: National Center for Biotechnology Information TSA: Tryptic soy agar NGS: Next generation sequencing TSB: Tryptic soy broth NH4+: Ammonium NMDS: Non-metric multidimensional scaling Units NO2-: Nitrite bp: base pair NO3-: Nitrate CFU: Colony forming unit NR: Non-rebundant protein sequences CPM: Copies per million reads NT: Non-redundant nucleotide sequences Gb: GigabyteOD: Optical Density kb: kilo-base pair ONF: Oligonucleotide frequency PFU: Plaque Forming Unit ORF: Open reading frame RPK: Read per kilobase PCR: Polymerase chain reaction Tb: Terabyte PC: Positive Control QC: Quality control qPCR: Quantitative polymerase chain reaction Rease: Restriction endonuclease RM: Restriction modification RNR: Ribonucleotide reductase ss: single stranded TEM: Transmission electron microscopy VC: Viral contig vVC: Viromic viral contig
CHAPTER I
General introduction:
Viruses, host interactions and the use of metagenomic approaches to
understand their ecology
1.1. Overview
Viruses are an integral part of every environment and can infect all the primary domains of life (Clokie et al. 2011). Viruses in the marine environment are well recognized as important drivers of microbial community structure and ecosystem functioning through directly affecting the abundance of host cells by lysis and through their proficiency in transferring genes between hosts (Wommack and Colwell 2000; Weinbauer et al. 2003; Weinbauer and Rassoulzadegan 2004; Suttle 2005). In the oceans, viruses are responsible for killing approximately one-third of prokaryotic cells per day, and thereby altering carbon (C) and nutrient cycling at the global scale (Fuhrman 1999). In addition, marine viruses can impact productivity in a given ecosystem by manipulating host metabolic functions after viral infection via the expression of virus-encoded auxiliary metabolic genes (AMGs) (Breitbart et al. 2007). In comparison to the relatively homogeneous marine environment, there are more diverse habitats for microorganisms in soil due to the wide variation in their composition, spatial heterogeneity and physicochemical properties (Williamson et al. 2017). In one gram of soil up to 10 billion prokaryotes can be found (Raynaud and Nunan 2014). Similarly, viruses in soil may be as abundant and equally diverse, and therefore potentially play important roles in influencing microbial community structure and ecosystem functions (Williamson et al. 2017). Although our understanding of the scale of viral diversity and functioning in soil has increased, knowledge on virus-bacterial host interactions in soil remains limited (Han et al. 2017; Trubl et al. 2018; Graham et al. 2019; Emerson 2019). In this chapter, the biology and interactions of viruses and the current state of knowledge on soil viruses, metagenomic approaches used to study viral communities and the model soil pH gradient system that was studied, along with the specific research aims, is presented below. 1.1.1. Biology of viruses and their life cycle Viruses are intracellular obligate parasites, meaning that they are completely dependent on their living host for replication, have no intrinsic metabolism and are dormant when not infecting a suitable host (Gelderblom 1996). All viruses consist of the same fundamental constituents, a protein capsid and a nucleic acid genome (King et al. 2011). The capsid describes the protein coat that surrounds the genome of the virus and is constructed of identical monomer proteins (capsomers) that self-assemble. Together, the capsid and the genome compose the virion, which is generally referred to as the infectious particle (King et al. 2011). The majority of characterized capsids have either a cubic or helical symmetry. However, some viruses, primarily those infecting bacteria or archaea, can contain more complex capsids (King et al. 2011). Virus genomes are either composed of DNA or RNA (Gelderblom 1996; King et al. 2011). DNA viruses can be either single stranded (ssDNA) or double stranded (dsDNA) and linear or circular. RNA viruses can also be single stranded (ssRNA) or double stranded (dsRNA) and unsegmented or segmented (Lodish et
al. 2000). Viruses of bacteria are typically referred to as bacteriophages (or phages), although these terms are not routinely used for the description of viruses that infect archaea. According to the International Committee on Taxonomy of Viruses (ICTV), viruses are taxonomically classified into orders, families, subfamilies, genera, species, isolates and variants of a host (Kuhn et al. 2010). There are two main virus reproduction cycles, the lytic and lysogenic cycles (Figure 1.1). First, the virus attaches itself to the surface of the host cell through specific binding between viral surface glycoproteins and specific receptor molecules (Aswad and Katzourakis 2018). The virus then inserts its genetic material into the host cell via receptor-mediated endocytosis or other mechanisms. Viral or host enzymes degrade the viral capsid. In the lytic cycle, the viral genome induces the synthesis of viral constituents, assembly of new viral particles, and lysis of the infected cell, releasing new viruses that will spread and infect other host cells (Clokie et al. 2011). In the lysogenic cycle the viral genome is incorporated into the host cell’s genome, or remains as a plasmid and thus reproduces as a prophage (Weinbauer et al. 2003; Weinbauer and Rassoulzadegan 2004). This is a latent form, in which the viral genes are present in the host without causing disruption of the cell (Clokie et al. 2011). Prophages are replicated and maintained in the following generations until an environmental stress of the host cell triggers a switch to the lytic cycle (Weinbauer et al. 2003). Lysogeny is an effective strategy for viral populations to persist when the abundance of host cells is low (Williamson et al. 2002; Weinbauer et al. 2003; Mann 2003; Chibani-Chennoufi et al. 2004; Kimura et al. 2008) or when host survival depends on periods of inactivity (Pantastico-Caldas et al. 1992; Kimura et al. 2008). Protein coat Core Cell wall Bacterial DNA Bacterial DNA Bacterial
DNA Bacterial DNA
a) Lytic cycle b) Lysogenic cycle Figure 1.1. Schematic representation of a) the lytic and b) lysogenic cycles. The lytic cycle ends by releasing the mature viruses and the lysogenic cycle where viral DNA is incorporated into the host chromosome.
1.1.2. Abundance and diversity of prokaryotic viruses in soil
Prokaryotic viruses have been shown to be more abundant than prokaryotes, and are the most abundant and diverse biological entities in the biosphere (Fuhrman 1999; Williamson et al. 2013). It has been extrapolated from direct counts of virus-like particles in different environments that
the global virosphere may contain up to ~1031 viral particles (Edwards and Rohwer 2005;
Breitbart and Rohwer 2005; Suttle 2005; Silveira and Rohwer 2016). Several studies measuring viral abundance in soils by transmission electron microscopy (TEM) or epifluorescent microscopy
have shown large numbers of viral particles ranging from 107 to 1010 per gram of dry weight soil
(Williamson et al. 2003, 2017; Han et al. 2017). In a recent study, viral particle abundance of four soil types was found to be similar but the different morphological groups of viruses had different relative abundances across the soil types (Reavy et al. 2015). Viral and bacterial abundance has been shown to increase with ecosystem productivity, generally lowest in dry, arid soils and greatest in moist soils rich in organic matter (Williamson et al. 2017). However, while viral abundance can vary between soils of different composition and geographic location (Williamson et al. 2005), soil viral abundance is comparatively stable relative to marine ecosystems. Viral abundance in marine environments has been shown to change over 2000-fold through the water column (Srinivasiah et al. 2008). However, comparison of viral abundances in soil is confounded by various parameters, including viral particle extraction and detection, and effects of soil properties (Trubl et al. 2016; Williamson et al. 2017). Counts may be greatly underestimated due to the difficulty of extracting all viruses present. The total number of free viruses in soil is probably 1 – 2 orders of magnitude greater than that of bacterial populations, and thus their relative abundance in comparison to prokaryotic cell numbers may be comparable to marine ecosystems (Watt et al. 2006; Trubl et al. 2018).
Viruses can be classified by morphology (van Regenmortel et al. 2000) with TEM the most
extensively used technique for characterizing into morphotypes (Ackerman et al. 1978). Tailed phages constitute the order Caudovirales, accounting for 95% of all phages, and likely make up the majority of the viruses on the planet (Ackermann 1998; Maniloff and Ackermann 1998). The
Myoviridae have a contractile tail, the Siphoviridae have a long non-contractile tail and the Podoviridae have a short non-contractile tail (Fauquet et al. 2005). Based on TEM and
metagenomic analysis, viruses belonging to the order Caudovirales have been shown to dominate in soil (Zablocki et al. 2014; Ballaud et al. 2016; Han et al. 2017). Based on ICTV and the Virus-Host Database, there are currently 21 families, 57 subfamilies and 797 genera of bacterial viruses, and 19 families and 24 genera of archaeal viruses (Adriaenssens et al. 2020; Mihara et al. 2016). Based on cultivated viruses, archaeal viruses are morphologically more diverse than bacterial viruses, despite being underrepresented (Pietilä et al. 2014; Snyder et al. 2015). Viral metagenomics analyses suggest that global environmental viral diversity is vast and that the
majority of viral diversity has yet to be characterized (Angly et al. 2006; Mokili et al. 2012; Roux et al. 2015b). Between 60 to 99% of sequences within a virome typically have no significant similarity to sequences within a reference database, and is referred to as “viral dark matter” (Brum et al. 2015; Roux et al. 2015b). Although most research has focused on dsDNA viruses, recent work has also revealed distinct circular ssDNA viruses, and diverse and abundant RNA viruses in soil (Reavy et al. 2015; Starr et al. 2019).
1.1.3. Virus-host interactions
Viruses infect all types of cellular life that are present in soil, including eukaryotes and prokaryotes (Weinbauer and Rassoulzadegan 2004). Through both the lytic and lysogenetic cycle, viruses interact with their hosts resulting in impacts on microbial communities and nutrient cycling. As viruses cause cell lysis and the release of proteins and nucleic acids, they may have an important direct role in the cycling of carbon, nitrogen, sulfur and phosphorus in soil (Williamson et al. 2017). Soil viruses may increase the amount of available carbon which can influence microbial production and respiration (Williamson et al. 2017). The release of microbial cellular material via viral lysis, commonly referred to as the viral shunt, are reused by microorganisms and in part of the microbial loop (Suttle 2005). In marine systems, viruses were estimated to kill up to 40% of marine bacteria per day and to contribute to the viral shunt (Suttle, 2005). Although similar roles for soil viruses has been suggested, there is a lack of information about the contributions of the viral shunt in the soil food-web (Kuzyakov and Mason-Jones, 2018; Emerson et al. 2019).
The transfer of genetic material between viruses and hosts and then between microorganisms has important consequences. During the lysogenic cycle, prophages can alter host metabolism and the host phenotype, resulting in a change of fitness, and the expression of prophage genes can even protect their hosts from additional phage infection (Williamson et al. 2017). An additional role of viruses is transduction between prokaryotes mediated by viruses (Canchaya et al. 2003a). In the soil environment this is an important mechanism for transferring genes, resulting in host diversification and speciation (Wiedenbeck and Cohan 2011). In soil microcosms, transduction between introduced bacteria and phages has been observed although it has not yet been shown to occur in situ in indigenous soil bacteria, likely due to the technical
difficulties of detecting rare transduction events in soil (Elsas et al. 2003).
1.1.3.1. Interactions between bacteria and viruses
The study of bacteriophage-host interactions remains a challenge because many host bacteria remain uncultured and techniques used for the isolation and characterization of phages is limited to those associated with cultured organisms (de Jonge et al. 2019). Based on infection assays, the
host range of bacteriophages is on a continuum, from broad to extremely narrow (Ross et al. 2016).
For example, isolated bacteriophages from Vibrio parahaemolyticus were shown to not infect
other strains of this species or other Vibrio species (Weinbauer and Rassoulzadegan 2004). In contrast, other bacteriophages have been shown to infect both multiple strains of the same species and multiple species (Greene and Goldberg 1985; Vinod et al. 2006; Uchiyama et al. 2008; Gupta and Prasad 2011; Khan Mirzaei and Nilsson 2015; Yu et al. 2016). For example, species of
Escherichia coli, Citrobacter freundii, Shigella sonnei, Enterobacter and Erwinia were all found to
be infected by the bacteriophage Mu (Ross et al. 2016). In soils, an understanding of infectivity rates and those of key functional microbial groups, such as methanotrophs and nitrifiers which directly regulate carbon and nitrogen cycling, is limited. However, viruses infecting methanotrophs have been isolated in several environments (Tiutikov et al. 1976; Tyutikov et al. 1980, 1983) and viruses from a recent soil metagenomic study have been predicted to associate with methanotroph hosts (Emerson et al. 2018).
Based on sequenced bacterial genomes, it has been estimated that 60 – 70% have prophages (Paul 2008). It has been proposed that lysogeny occurs during times when nutrients are scarce and host population sizes are small, and when environmental factors become favorable, the bacteriophage can extract itself from the host genome and enter into the lytic pathway (Williamson et al. 2002; Kimura et al. 2008). During lysogeny, a symbiotic relationship between the prophages and its bacterial host can promote the fitness of both prophages and host by expressing genes that increase the fitness of the host cell (Canchaya et al. 2003b). This process is known as lysogenic conversion (van Houte et al. 2016). For example, temperate bacteriophages may influence root nodule colonization, N-fixation efficiency and crop productivity by altering phenotypes of rhizobium through lysogenic conversion (Kimura et al. 2008). Also hosts and phages develop antiviral defense mechanisms and viral counterdefense mechanisms, respectively (Abedon 2012; Vasu and Nagaraja 2013). Many bacteria also have the clustered regularly interspaced short palindromic repeats (CRISPR)-Cas system as an adaptive defense against viruses (Bhaya et al. 2011). These mechanisms are further discussed in section 1.1.3.3.
1.1.3.2. Interactions between archaea and viruses
Most of the present knowledge on archaeal viruses is built on extremophiles, with characterized viruses infecting either hyperthermophilic Crenarchaeota, or halophilic or methanogenic
Euryarchaeota (Snyder et al. 2015; Albers 2016; Quemin et al. 2016). However, the genomes of a
number of marine archaeal viruses predicted to infect members of the Euryarchaeota and
Thaumarchaeota have been assembled (Uchiyama et al. 2008; Philosof et al. 2017; Prangishvili et
al. 2017; López-Pérez et al. 2019; Ahlgren et al. 2019). For example, the magrovirus group that infects the ubiquitous but uncultured marine group II Euryarcheota was recently discovered
(Philosof et al. 2017). In addition, viruses that infect ammonia oxidizing archaea (AOA) belonging to the phylum Thaumarchaeota, have also been assembled from metagenomic samples (López-Pérez et al. 2019; Ahlgren et al. 2019). These AOA viruses are most closely related to members of the order Caudovirales (Suttle 2005; Labonté et al. 2015; López-Pérez et al. 2019; Ahlgren et al. 2019). In some AOA viral genomes the presence of AMGs encoding for ammonia monooxygenase subunit C (amoC), a subunit of ammonia monooxygenase (AMO), was found, suggesting the potential role of Thaumarchaeota viruses in modulating nitrification in oceans (Roux et al. 2016; Ahlgren et al. 2019). Additionally, putative proviruses have been retrieved within the genome of the marine thaumarchaeon Candidatus Nitrosomariuns catalina SPOT01, and the genome of
Nitrososphera viennensis EN76, the first isolated soil AOA (Krupovic et al. 2011; Ahlgren et al.
2019). Recently, three Nitrosopumilus spindle-shaped viruses (NSVs) were isolated from suspended particulate matter-rich seawater samples with a host AOA strain (Kim et al. 2019). These NSVs have a narrow host range and display high rates of adsorption on to their host cells, indicating efficient infectivity of the Nitrosopumilus host strain (Kim et al. 2019). Previous metagenomic studies have suggested that viruses infecting Thaumarchaeota have a major impact on thaumarchaeal functioning and mortality by cell lysis, and hence, modifying nitrogen and carbon cycles (Danovaro et al. 2016; López-Pérez et al. 2019; Ahlgren et al. 2019). Nevertheless, most marine AOA viruses have yet to be isolated due to difficulty in obtaining host cells in pure culture. Currently, no AOA virus has been isolated from soil. 1.1.3.3. The co-evolution ‘arms race’ between host cells and viruses Host-virus interactions during virus replication involve virus adsorption to cell receptors and the entry of viral DNA into the host cell, resulting in a constant evolutionary arms race to change cell structures limiting viral infection and subsequent evolution of viruses to overcome these defensive adaptations (Golais et al. 2013). During virus replication the host cell can use antiviral defense mechanisms including the restriction-modification system, the CRISPR-Cas systems and abortive infections (Deveau et al. 2010; Labrie et al. 2010; Stern and Sorek 2011; tenOever 2016). The restriction-modification system is found in prokaryotes and provides a defense against foreign DNA through the action of restriction endonuclease and methyltransferases (Tock and Dryden 2005; Vasu and Nagaraja 2013). Endonucleases are proteins that recognize foreign DNA and cleave at specific palindromic DNA sequences (i.e. restriction sites) (Vasu and Nagaraja 2013). Unlike host bacterial DNA, viral DNA is not methylated by methyltransferase and therefore viral DNA is unprotected and cleaved by restriction endonucleases (Wilson and Murray 1991). Subsequently, viruses evolve mechanisms to counteract this form of protection. For example, the incorporation of unusual bases, such as 5-hydroxymethyluracil instead of thymine, into their genomes can modify restriction sites (Krüger and Bickle 1983). Some phages can code for their
own methyltransferase, incite the production of the host methyltransferase or possess genes encoding proteins that bind to restriction sites or mimic DNA proteins that can neutralize endonuclease action (Stern and Sorek 2011; Golais et al. 2013).
Nearly all of archaea and approximately half of all bacteria have been found to possess CRISPR arrays, which cooperate with CRISPR-associated proteins (encoded by Cas genes) to form the basis of the CRISPR-Cas adaptive immune systems in prokaryotes (Figure 1.2) (Jansen et al. 2002; Terns and Terns 2011). Host cells continuously acquire CRISPR spacer sequences from viruses to facilitate recognition and evasion of future viral infection. To evade newly acquired spacers, the viruses can mutate the targeted spacer sequence or phosphorylate the Cas proteins to evade the CRISPR-Cas system (Horvath and Barrangou 2010; Golais et al. 2013). Conversely, CRISPR repeats and their associated proteins evolve to escape a shut-down mechanism for the CRISPR system encoded by viruses (Wang et al. 2020). Thus, bacteria and viruses are locked in an arms race. The coevolution between host and viruses in the same habitat commonly occurs and is a key regulator of ecological and evolutionary processes in microbial communities (Koskella and Brockhurst 2014). The arms race may have long-term evolutionary consequences on the host population, and in an apparent compromised state, lysogeny may occur (Golais et al. 2013; Koskella and Brockhurst 2014). Figure 1.2. Schematic representation of the CRISPR-Cas mechanism. a) CRISPR adaptation where a new spacer sequence (S) from a phage genome is incorporated into the CRISPR system, adjacent to the leader sequence; b) CRISPR RNA (crRNA) biogenesis where spacer transcripts from the CRISPR array are transcribed into RNA and maturation into crRNA; and c) crRNA-guided interference where foreign DNA is recognized and silenced by the crRNA-guided surveillance
a) CRISPR adaptation Bacteriophage Bacteria cell S DR S DR S DR S DR DR S DR Cas protein cas operon Leader b) crRNA biogenesis c) crRNA-guided interference
crRNA-guided surveillance complexes
Transcription and maturation
S
DR Direct repeat sequence
1.1.3.4. Auxiliary metabolic genes Viruses often acquire host genes facilitating horizontal gene transfer between hosts (Hendrix et al. 2000; Miller et al. 2003; Lindell et al. 2004). Viral genomes include genes encoding proteins involved in the production of phage progeny, including DNA replication, nucleotide production, and RNA transcription (Lindell et al. 2004). Viral genes that do not contribute to viral replication, but have functions that alter host metabolism and may aid in the production of new viruses are termed auxiliary metabolic genes (AMGs) (Breitbart et al. 2007; Crummett et al. 2016; Jin et al. 2019). The AMGs of marine cyanophages have been the most studied (Mann 2003; Lindell et al. 2004; Sullivan et al. 2005; Millard et al. 2010). AMGs may be considered common or rare, with common AMGs among various lineages of hosts encoding metabolic functions that are essential under a range of conditions, whereas rare AMGs may be involved for only particular conditions (Crummett et al. 2016). For example, a recent analysis of virome data derived from the Pacific Ocean identified niche-specialized AMGs that contribute to depth-stratified host adaptation, such as those for high pressure deep-sea survival (Hurwitz et al. 2015). A large number of AMGs have also been identified that are associated with carbon metabolism in soil metagenomic analyses, including genes encoding glycoside hydrolases, endomannanases and chitosanases, suggesting the potential impact of viruses on carbon cycling in soil ecosystems (Emerson et al. 2018; Trubl et al. 2018; Graham et al. 2019; Emerson 2019; Li et al. 2020). However, the adaptive significance of most soil viral AMGs is generally unclear. 1.2. Using metagenomics for studying viral communities in soil 1.2.1. Metagenomics Research on the diversity and ecology of viruses in the ecosystems has been revolutionized by molecular based approaches (Mokili et al. 2012). Metagenomics can be described as the analysis of genomic DNA from environmental communities (Riesenfeld et al. 2004). The characterization of viral diversity in soil is challenging as most prokaryotic hosts are not cultivable and there are no universal marker genes common to all viral genomes, unlike for prokaryotic and eukaryotic communities, that allow for taxonomic discrimination (Edwards and Rohwer 2005). However, metagenomics can be used to describe the uncultured majority of organisms, and in combination with the development of bioinformatics tools, can be utilized to identify and provide genetic information about the viruses present in an environmental sample (Breitbart et al. 2002; Edwards and Rohwer 2005; Roux et al. 2015a; Ren et al. 2017). However, due to the complexity of soil which contains a vast microbial diversity, metagenomics typically only recovers complete or partial microbial genomes of the most abundant organisms given enough sequencing depth (Liolios et al. 2008; Mende et al. 2012). Therefore, generating samples enriched in viruses before performing metagenomic analysis (i.e. viromes) may facilitate more in-depth analysis of the viral
community composition. In order to produce soil viromes, viruses are typically extracted within a buffer, concentrated through filtering to remove large prokaryotic cells, and then precipitated (Trubl et al. 2016).
1.2.2. High throughput sequencing
High throughput sequencing (HTS) is massively parallel sequencing of millions of individual fragments of DNA (Tucker et al. 2009). Over the last two decades there have been many different HTS systems developed using a variety of different sequencing chemistries and approaches, with those of the various Illumina (e.g. MiSeq, HiSeq and NovaSeq) and Oxford Nanopore technologies commonly used today, and in this thesis.
Illumina sequencing is based on sequencing-by-synthesis, where single bases are detected
via reversible dye terminators as they are incorporated into strands of DNA (Ambardar et al. 2016). In contrast, Oxford Nanopore sequencing directly detects the nucleotides without active DNA synthesis, and measures the change in electrical current of a nanopore as a single-stranded DNA strand is passed through (Branton et al. 2008; Feng et al. 2015). Sequencing systems vary in the number of sequences and the length of DNA fragments that can be processed. For example, the Illumina MiSeq and NovaSeq platforms can be used for sequencing amplicons or extracted genomic DNA, generating up to 15 GB or 6 TB data via 50 million or 20 billion paired-end reads, respectively. In contrast, the Oxford Nanopore platform is capable of producing long reads from a much-reduced number of DNA fragments. Nanopore sequencing has a relatively high error rate compared to short read sequencing, therefore the combination of both approaches where error correction of longer reads is performed using short read sequence data is commonly performed (Kono and Arakawa 2019). 1.2.3. Bioinformatic tools used in metagenomic analyses The analysis of metagenomic sequencing data undergoes five basic steps: 1) quality trimming of output sequencing reads, 2) contig assembly, 3) binning, 4) functional and taxonomic annotation of the assembled contigs or bins and 5) quantification of bins or specific genes. In this section, each step is described, and the associated bioinformatic tools that were utilized throughout this thesis are presented. 1.2.3.1. Quality trimming Sequenced reads contain adaptor sequences (added to DNA fragments to identify the sample) and the base sequence quality often decreases over the read. In addition, in paired-end sequencing, the quality of the second read can be low (Tan et al. 2018). As these errors in the sequence reads can compromise downstream analysis, it is necessary to filter the data to ensure any low-quality
reads and adaptor sequences are removed. The Phred scale is most commonly used to calculate quality scores (Ewing et al. 1998). A base call quality is assigned to each base call, which estimates the likelihood that the base call is incorrect. Generally, a median quality score greater than Q20, 1 in 100 chance of incorrect base call, is regarded as acceptable, and above Q30, 1 in 1000 chance
of incorrect base call, is good. Two command line tools were used for quality trimming, the FASTX-Toolkit (http://hannonlab.cshl.edu/fastx_toolkit/) and Trimmomatic (Bolger et al. 2014). The
former has the advantage of providing QC metrics graphically but can result in a number of unpaired sequences after trimming unlike the latter which maintains read pairs (i.e. paired-end mode) and can efficiently find adapter sequences.
1.2.3.2. Contig assembly
Assembly involves the joining of short and long reads from the same genome into longer single contiguous sequences, called contigs. As de-novo assembly is not biased towards a reference genome, it is generally used to assemble novel genomes (Baker 2012). Three command line tools were used: MEGAHIT (Li et al. 2016), metaSPAdes (Nurk et al. 2017) and UniCycler (Wick et al. 2017). MEGAHIT is optimized for large and complex metagenomics reads, and therein the “meta-large” preset parameter was utilized. Like MEGAHIT, metaSPAdes constructs a De Bruijn graph (i.e. identification of sequence overlaps) of all reads, and transforms it into an assembly graph using several graph simplification procedures, and from the assembly graph reconstructs paths that correspond to long contigs within a metagenome (Bankevich et al. 2012; Nurk et al. 2013, 2017). MetaSPAdes is a commonly used assembler, for example, it is used in the Joint Genome Institute (JGI) bioinformatics pipeline. The efficiency of MEGAHIT and metaSPAdes assemblers was tested using virome data in Chapter II. UniCycler was utilized to produce a hybrid assembly using both Illumina reads and Nanopore long reads in Chapter III. Unicycler first produces an Illumina assembly graph using SPAdes, and then uses Nanopore long reads to build bridges that can resolve repeats in the genome, yielding a complete genome assembly. 1.2.3.3. Binning
Binning involves the clustering of contigs with similar sequence attributes, such as k-mer composition, codon usage and similar read coverages into the same bin (Uritskiy et al. 2018). In this thesis, the modules implemented in the MetaWRAP tool were largely used, as this tool performs all of the main procedures of metagenomic analysis (read-quality control, assembly, taxonomic profiling, binning, functional annotation, visualization and quantification). In addition, MetaWRAP uses three metagenomic binning software: MaxBin2, metaBAT2 and CONCOCT, and then performs a hybrid approach considering the three bin sets to produce a consolidated improved bin set. The CheckM tool implemented in MetaWRAP was used to assess the quality of
genomes recovered from the metagenomes (Parks et al. 2015). It provides robust estimates of the completion and contamination of each genome by using collected sets of genes that are ubiquitous and single-copy genes within a phylogenetic lineage. Bins can be defined as a high-quality metagenomic assembled genome (MAG), completeness > 90% and contamination < 5%, medium-quality MAG, completeness > 70% and contamination < 10%, and partial genome, contamination > 50% and contamination < 4%. However, it is important to note that using MAGs can lead to the loss of information, as only a relatively small proportion of reads are successfully assembled and binned in complex metagenome datasets (Maguire et al. 2020). Bins were visualize using the tool Anvi’o (Eren et al. 2015). 1.2.3.4. Functional and taxonomic annotation of assembled contigs or bins For analyzing contigs, the basic local alignment search tool (BLAST) can be used to perform local alignments to find regions of local similarity between sequences. BLASTn and BLASTp can be used to compare query nucleotide or protein sequences to sequence databases, respectively, and provide the statistical significance of matches. A disadvantage of this method is in long processing times, and even with high computing servers, it can take numerous days to weeks. Alternatively, Diamond BLASTp can quickly align query protein sequences against a non-redundant (nr) sequence database (Madden et al. 1996; Buchfink et al. 2015). The National Center for Biotechnology Information (NCBI) hosts a non-redundant nucleotide (nt) and protein (nr) sequence collection that is commonly used as the reference database in BLAST searches. Additionally, the curated protein sequence database Swiss-Prot, which is part of the UniProt database collection, was utilized (Table 1.1).
To annotate the taxonomy and function of contigs, the tools Kaiju and InterProScan 5 are commonly used, respectively (Jones et al. 2014; Menzel et al. 2016). Kaiju is a program for taxonomic classification sequence reads or contigs from whole metagenomic sequencing (Menzel et al. 2016). Each read (or contig) is translated into an amino acid sequence, which is searched for in the reference database. The reference sequence (RefSeq) collection, hosted by NCBI, provides an inclusive, non-redundant well-annotated set of sequences, including proteins (Table 1.1).
Table 1.1. Information about the reference databases used within this thesis.
Database Host Type Number of sequences Length of sequences (bp)
nt NCBI Nucleotide 53,777,267 237,410,501,766
nr NCBI Protein 115,570,790 42,364,384,627
Refseq NCBI Protein 49,770,189 15,556,247,796
Swiss-Prot UniProt Protein 560,823 201,585,439
viruses NCBI Nucleotide 12,156 317,115,877
protein signature databases, including CATH-Gene3D, CDD, HAMAP, PANTHER, Pfam, PIRSF, PRINTS, ProDom, SFLD and SMART (Jones et al. 2014). This tool provides protein families and domains, and the gene ontology and pathways (KEGG, MetaCyc and Reactome).
The taxonomic and functional analysis of MAGs is different from that of contigs. Taxonomic identification can be carried out using the genome taxonomy database tool kit (GTDB-Tk) (Chaumeil et al. 2020). This tool uses a set of 120 bacterial marker genes and 122 archaeal marker genes and the FastANI tool to estimate the average nucleotide identity (ANI) between a MAG and reference genome. If the ANI between the MAG and genome is > 95% and the alignment fraction is > 0.65, then the MAG is classified as belonging to a species. Gene prediction of MAGs can be performed with the prokaryotic dynamic programming gene finding algorithm (Prodigal) (Hyatt et al. 2010) and functional analysis with Diamond BLASTp, Kyoto encyclopedia of genes and genomes (KEGG) Mapper (Kanehisa and Goto 2000) and InterProScan 5 (Jones et al. 2014). The contig annotation tool (CAT) and bin annotation tool (BAT) are also commonly used for classifying the taxonomy of long DNA sequences and MAGs (Meijenfeldt et al. 2019). 1.2.3.5. Quantification of bins or specific genes The process of aligning short reads to a reference sequence of a complete genome or de-novo assembly is called read mapping (Schatz et al. 2010). Many programs have been developed to map reads to a reference sequence, and which vary in their algorithm. Read mapping allows to define the mean coverage of each contig and provides input for binning through clustering algorithms that use contig coverage patterns across samples (Eren et al. 2015; Uritskiy et al. 2018). The resulting abundances from read mapping can be normalized by the coverage and the genome size. Here, the Salmon mapper implemented in the metaWRAP tool (Patro et al. 2017) and the Bowties2 tool implemented in Anvi’o were utilized (Langdon 2015). 1.2.4. Virus sequence analyses As viral sequences can have higher homology to prokaryotic or eukaryotic genes (Breitbart et al. 2002, 2003; Angly et al. 2006; Schoenfeld et al. 2008; Blomström et al. 2010), when processing viromes it is important to remove microbial contaminated sequences by mapping to prokaryotic or eukaryotic reference genomes. After assembly of metagenomic or viromic data, viral contigs can be predicted through either a reference-based or reference-free approach. Predicted viral contigs can then be classified into viral proteomic trees based on genome-wide similarity, and different approaches can be used to try and link viruses to their hosts, such as CRISPR arrays, genomic similarity and gene homology (Sanguino et al. 2015; Ahlgren et al. 2017; Galiez et al. 2017).