HAL Id: hal-02406608
https://hal-amu.archives-ouvertes.fr/hal-02406608
Submitted on 12 Dec 2019HAL is a multi-disciplinary open access archive for the deposit and dissemination of sci-entific research documents, whether they are pub-lished or not. The documents may come from teaching and research institutions in France or abroad, or from public or private research centers.
L’archive ouverte pluridisciplinaire HAL, est destinée au dépôt et à la diffusion de documents scientifiques de niveau recherche, publiés ou non, émanant des établissements d’enseignement et de recherche français ou étrangers, des laboratoires publics ou privés.
Unusual behaviour of the dissolutions kinetics of one
monolayer of Si in Cu(001)
B. Lalmi, C Girardeaux, A. Portavoce, J. Bernardini, B. Aufray
To cite this version:
B. Lalmi, C Girardeaux, A. Portavoce, J. Bernardini, B. Aufray. Unusual behaviour of the dissolutions kinetics of one monolayer of Si in Cu(001). Defect and Diffusion Forum, Trans Tech Publications, 2009, 289-292, pp.601-606. �10.4028/www.scientific.net/DDF.289-292.601�. �hal-02406608�
Unusual behaviour of the dissolutions kinetics of one monolayer
of Si in Cu(001)
B. Lalmi
1,2 *, C. Girardeaux
1,2 ¤, A. Portavoce
1,2, J. Bernardini
1,2, B. Aufray
31
Aix-Marseille Université, IM2NP, Faculté des Sciences et Techniques, Campus de Saint-Jérôme F-13397 Marseille cedex 20, France
2
CNRS, IM2NP (UMR 6242), Faculté des Sciences et Techniques, Campus de Saint-Jérôme F-13397 Marseille cedex 20, France
3
CINaM-CNRS Campus de Luminy Case 913 ; 13288, Marseille cedex 09, France
* [email protected]; ¤ [email protected]
Keywords: AES, LEED, Surface and Interfaces, Copper-silicides, Diffusion, Reaction
Abstract.-We present an experimental study by Auger electron spectroscopy (AES) and low energy electron diffraction (LEED) of the dissolution of about one monolayer of silicon previously deposited at room temperature on Cu (001). The isochronal dissolution has been recorded in the temperature range [50-320°C] (annealing rate 1.5°C/min). The plateau observed in the kinetics dissolution for temperatures between 95°C and 240°C, reveals the formation of an intermetallic two dimensional superficial phase thermally stable in this range of temperature. On the plateau, LEED patterns show the formation of a (5x3) superstructure. Above 255°C, we observe a very fast dissolution of the surface alloy characteristic of a first-order surface transition. Isothermal dissolutions kinetics have been recorded above and under the surface transition temperature (250°C and 270°C). From these measurements, we have evaluated bulk diffusion coefficients of Si in Cu assuming a local equilibrium. The diffusion coefficients measured within this hypothesis at 250°C and 270°C are respectively higher and lower than those extrapolated from high temperature measurements for Ge in Cu.
1. Introduction
Many metal-semiconductor interfaces have been studied in the past in order to develop a more complete description of the Schottky-barrier formation [1] and surface-sensitive techniques such as Auger electron spectroscopy revealed deeper insights into the problem of metal-semiconductor contact [2]. While most experiments dealt with metal deposition on semiconductor surfaces, some more recent studies explored the initial stages of the interface formation by investigating the deposition behaviour of semiconductor on metal [3-7]. The Cu-Si is one of these systems which is still a subject of several scientists’ efforts. In this system, the nature and the structure of the surface alloys (silicides) formed after reaction between an adsorbed silicon thin film and a copper substrate were studied [8-12]. Generally, such surface alloys can be formed during growth as well as during dissolution processes of the deposited silicon. During the growth of Si onto Cu(110) surface some special features are observed: (i) An ordered surface alloy c(2x2)-Si/Cu(110) is formed for Si coverage below 0.5ML; (ii) For Si coverage of 0.7 ML, (2x2) Si atomic chains considered as a one-dimensional superstructure are observed [8,9]. On Cu (111), a surface alloy which exhibits a ( 3 x 3 R30) structure has been observed at elevated temperatures [10, 11].
Recently, we have studied the growth mode of Si thermally evaporated onto Cu (001) and the different properties (nature, structure) of the copper silicide formed after annealing at low temperatures of a very thin film of silicon deposited onto Cu(100) [12].We have demonstrated that, at RT the silicon grows layer by layer on copper (001) and for a weak coverage of silicon deposit, the ordered surface alloy induced by annealing treatment displays a (5x3) superstructure with a Cu2Si stoichiometry.
In this paper we present an AES-LEED investigation of the dissolution kinetics of about one monolayer of silicon previously deposited at room temperature on Cu (001). From both the isochronal and the isothermal dissolution kinetics, i) we determine the temperature range of stability of the surface alloy and ii) we discuss the limits of the local equilibrium assumption in the low temperature range where the superficial 2D phase disappears.
2. Experimental
All experiments were performed in an ultrahigh vacuum (UHV) chamber with a base pressure below 2x10⁻⁹ Torr measured by an ion gauge. The UHV chamber was equipped with instruments for AES and LEED analyses. The Auger intensities were acquired in a derivative mode and the data were computerised which allow us to record the surface concentrations of the different elements as a function of annealing time or temperature.
The Cu(001) surface was cleaned by cycles of Ar+ ion bombardment (5x10⁻⁵ Torr at 500 eV) and subsequent annealing were done at 550°C. The sample temperature was measured with a thermocouple spot-welded to the edge of the crystal. The sputtering-annealing cycles were performed until a well-ordered (1x1) LEED pattern with sharp spots and a low background were observed. The chemical purity of the surface was checked by AES. The silicon is deposited in situ by thermal evaporation method. The deposition consisted to expose the surface of the sample in front of the Si vapour for a constant time then to the Auger spectrometer to get the surface concentrations (estimated from the CuLMM-60eV and SiLMM-92eV signals) and then to the LEED
optics in order to follow the surface structure evolution.
After deposition of (~1ML) Si/Cu(001) at room temperature (cf. ref 12), the isochronal dissolution kinetics was recorded from 50 to 320°C with an annealing ramp of 1,5°C/min. During these thermal treatments, the evolution of both Cu and Si Auger signals were recorded. The isothermal dissolutions consisted to follow at constant temperature the evolution of both Si and Cu Auger intensity signals as a function of time.
All the dissolution kinetics were done after deposition of about one monolayer of silicon on Cu (001). Note that the Cu (001) surface was carefully cleaned after each dissolution experiment.
3. Results and discussion a- Isochronal dissolution
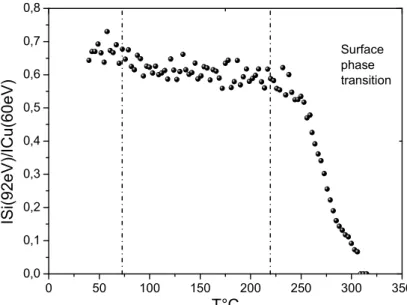
After deposition of (~1 ML) silicon on Cu (001) at room temperature, we performed isochronal dissolution kinetics in the temperature range [50–320°C] (annealing rate of 1. 5°/min). Fig.1 shows the variation of the Si (92eV) to (60eV) Auger signals ratio versus annealing temperature.
In this curve, one can delimit three domains. First, at the beginning of the dissolution, a slow decrease of the auger signal is observed; then, a plateau region is reached where the intensities of both Auger signals are quite constant appears over the range of temperature [95-240°C]; finally, increasing the temperature, the ISi/ICu ratio decreases very fast which corresponds to a very fast
decrease of the Si signal until total extinction and to an increase of the Cu signal until a plateau region is reached.
0 50 100 150 200 250 300 350 0,0 0,1 0,2 0,3 0,4 0,5 0,6 0,7 0,8 IS i( 9 2 e V )/ IC u (6 0 e V ) T°C Surface phase transition
Fig. 1: variation of the Auger peak-to-peak intensity ratio (ISi/ICu) versus temperature during
isochronal dissolution of 1ML Si/Cu (001)
During the annealing treatment, the evolution of the surface structure was investigated by LEED. At the beginning of the dissolution, only the p(1x1) surface structure of the Cu(100) substrate is observed. On the plateau, a (5x3) superstructure, which appears at about 95°C, remains up to 240°C. Beyond this temperature, the extra spots corresponding to the (5x3) superstructure rapidly disappear as the LEED spots of the (1x1) become brighter, which is also a signature of the silicon dissolution.
These results clearly indicate that after a first reorganisation of the deposited silicon, the 2D copper silicide which forms a (5x3) superstructure is stable up to 255°C. Above this temperature, the rapid variations of the surface concentration looks like a first order transition leading to a fast dissolution of the superficial 2D compound. This kind of discontinuity in the solute/solvent surface composition with the temperature was experimentally yet observed and theoretically explained for nearly immiscible systems for which the solute presents a strong tendency to surface segregation [13, 14]. This kind two-dimensional phase transition is so-called “surface miscibility gap transition” and was mainly observed and characterised in Cu-Ag alloys [15, 16]. In the Si-Cu system, if we can also assume a strong surface segregation tendency of silicon on copper surface (at least in relation to the difference in their surface energy of pure elements) the tendency to the order of this system does not favour this kind of surface transition and, from this point of view, the observed one is quite surprising. The isothermal dissolutions kinetics recorded above and under the transition temperature and presented in the following clearly show the strong role played by this surface transition.
b- Isothermal dissolutions
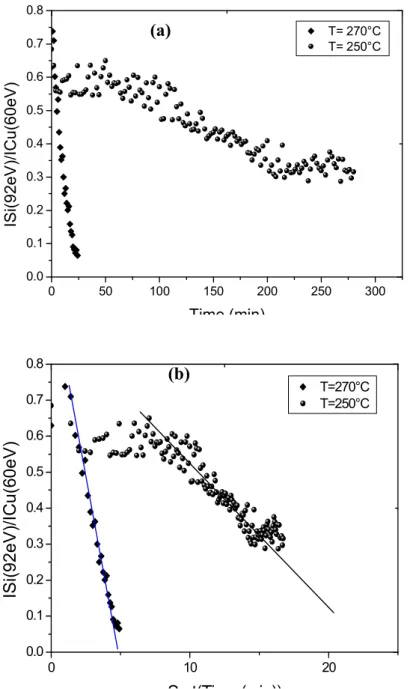
After deposition of (~1 ML) silicon on Cu (100) at room temperature, we performed two isothermal dissolution kinetics at 250 and 270°C (Fig 2a and 2b), i.e. just after the end of the plateau observed during the isochronal dissolution (Fig. 1) and 20°C above.
0 50 100 150 200 250 300 0.0 0.1 0.2 0.3 0.4 0.5 0.6 0.7 0.8 IS i( 9 2 e V )/ IC u (6 0 e V ) Time (min) T= 270°C T= 250°C 0 10 20 0.0 0.1 0.2 0.3 0.4 0.5 0.6 0.7 0.8 IS i( 9 2 e V )/ IC u (6 0 e V ) Sqrt(Time (min)) T=270°C T=250°C
Fig. 2: variation of the Auger peak-to-peak intensity ratio (ISi/ICu) (a) versus time and (b) versus
square root of time during isothermal dissolutions of 1ML Si/Cu(001)
Qualitatively, the evolution with time of the Auger signals is strongly different for a difference of T of 20°C. Such a behaviour indicates that the dissolution is not regulated by the bulk diffusion since diffusion coefficients cannot vary so strongly over this small temperature range. Quantitatively, the evaluation of the bulk diffusion coefficients (table I), which can be estimated from the slope of the Auger peak to peak intensity ratio versus square root of time curve (Fig. 2b) using the relation:
π Dt t x C t C t CS( =0)− S( )=2 v( =0, ) (1)
whereCS(t) is the superficial silicon concentration as a function of time, CS( =t 0) is the initial
superficial concentration of deposited silicon and Cv(x=0,t) is the limit of the bulk solubility of
the Si in Cu [17], confirms this assumption.
(a)
Table 1: Estimation of the diffusion coefficients of Si in Cu (001)
T (°C) Cv(x=0,t)(atom/cm3) Ddiss (cm2/s)
250 5,690 1021 1,073 10-20
270 5,813 1021 8,597 10-18
As observed in Fig. 3, these coefficients are indeed respectively higher and lower than those which can be extrapolated from high temperature measurements previously published in the literature for germanium in copper (as usual, germanium coefficients are used in absence of suitable silicon radioisotopes). Their values reflect the fact that equation 1 is inadequate (for both temperature) to describe the dissolution process which is governed by the segregation isotherm and the transition phase and not by the bulk diffusion which assumes a local equilibrium in the surface selvedge [18, 19]. At low temperature (below the transition temperature) the diffusion rate is lower than the expected one due to the surface segregation phenomenon and to the stability of the 2D compound. At higher temperature (above the transition temperature), the rapid diffusion of silicon atoms in the bulk close to the surface could be due to the non stability of the 2D compound. Other experiments are going on to confirm these assumptions increasing the range of temperature belong and below 250°C. 0.0010 0.0012 0.0014 0.0016 0.0018 0.0020 0.0022 -50 -45 -40 -35 -30 -25 -20 Surface phase transition Si in Cu (AES) Ge in Cu (radiotracer) L n (D) 1/T (K-1) Ge diffusion In Cu [18] Si diffusion in Cu(001)
Fig 3: Diffusion coefficients of Ge and Si in Cu as a function of temperature: comparison with radiotracer data previously published [20, 21]
4. Conclusion
In this work, we have studied the dissolution kinetics of about 1ML of silicon deposited at RT onto Cu(001) using two surface sensitive techniques, LEED and AES. We find that the dissolution process of silicon in copper is strongly dependant of the surface copper-silicide compound. In the temperature range [95-240°C], there is no silicon dissolution in Cu in relation to the formation of a stable 2D ordered compound forming a (5x3) superstructure. Above a critical temperature (Tc=255°C), there is a rapid dissolution of silicon and a disappearance of the (5x3) LEED pattern. Such behaviour has been interpreted by a surface phase transition. Isothermal dissolutions kinetics recorded above and under this critical temperature (250°C and 270°C), confirm the discontinuity observed in the dissolution process i.e. the bulk diffusion coefficients of Si in Cu evaluated from these measurements are strongly different. The set of the experimental results shows that the dissolution process of one Si ML in Cu(100) is strongly driven by the segregation phenomenon and the surface phase transition.
5. References
[1] For a review see L.J. Brillson, In Handbook on synchrotron radiation, edited by G.V. Marr (Elsevier, Amsterdam, 1987)
[2] G. Rossi, T. Kendelewiez, I. Lindau, and W. E. Spicer, J.Vac.Sci.Technol.A1, 987 (1983) [3] Y. Chang, Y. Hwu, J.Hanson, F. Zanini, and G. Margaritondo, Phys. Rev. Lett.63, 1845 (1989) [4] Y. Chang, Y. Hwu, J.Hanson, F. Zanini, and G. Margaritondo, J. Vac. Sci. Technol. A7, 717
(1989)
[5] D. W. Niles, N. Tache, D.G. Kilady, M. K. Kelly , and G. Margaritondo, Phys. Rev. B34, 967 (1986)
[6] C. Léandri, H. Oughaddou, J.M. Gay, B. Aufray, G. Le Lay, J.P. Bibérian, A. Ranguis, O. Bunk, R.L. Johnson, Surface Science, 573-2, 369 (2004)
[7] C. Leandri, G. Le Lay, B. Aufray, C. Girardeaux, J. Avila, M.E. Dávila, M.C. Asensio, C. Ottaviani, A. Cricenti, Surface Science, 574-1, 9 (2005)
[8] C. Polop, C.Rojas, J. A. Martin-Gago, R. Fasel, J. Hayoz, D. Naumovi and P. Aebi, Phys. Rev. B63, 115414 (2001)
[9] C. Rojas, F. J. Palmares, M. F. Lopez, A.Goldoni, G. Paolucci and J. A. Martin-Gago, Surf. Sci 454-456, 778 (2000)
[10] J. S. Tsay, A. B. Yang, C. N. Wu, F. S. Shiu, Thin solid films (2007). [11] H. Menard, A.B. Hom, S.P. Tear, Surf. Sci. 585, 47 (2005).
[12] B. Lalmi, C. Girardeaux, A. Portavoce, J. Bernardini, B. Aufray, J. Nanosci. Nanotechnol. 8, 1-5 (2008)
[13] C. R. Helms, Surf. Sci. 69, 689 (1977).
[14] Paul Wynblatt, Wei-Chun Cheng, and Yinshi Liu, Prog. in Surf. Sci. 48, 261 (1995).
[15] J. Eugène, B. Aufray and F. Cabané, Surface Science, 241, 1 (1991)
[16] G. Tréglia, B. Legrand, J. Eugène, B. Aufray, F. Cabané, Phys. Rev. B 44, 5842 (1991)
[17] C.S. Smith, “Constitution and microstructure of Copper-rich-Silicon alloys” Trans. AIME, 137, 313 (1940)
[18] M. Laguës, J.L. Domange, Surf. Sci. 47, 77 (1975)
[19] Z. Erdelyi , A. Taranovskyy and D.L. Beke, Surface Science 602, 805 (2008) [20] F.D.Reinke, C.E.Dahlstrom Phil. Mag. 22, 57 (1970)
[21] S.M.Klotsman, Ya.A.Robovskiy, V.K.Talinskiy, A.N.Timofeyev, Phys. Met. Metallogr. 31/2, 214 (1971)
Diffusion in Materials
doi:10.4028/www.scientific.net/DDF.289-292
Unusual Behaviour of the Dissolutions Kinetics of one Monolayer of Si in Cu(001) doi:10.4028/www.scientific.net/DDF.289-292.601
References
[1] For a review see L.J. Brillson, In Handbook on synchrotron radiation, edited by G.V. Marr (Elsevier, Amsterdam, 1987)
[2] G. Rossi, T. Kendelewiez, I. Lindau, and W. E. Spicer, J.Vac.Sci.Technol.A1, 987 (1983)
doi:10.1116/1.572019
[3] Y. Chang, Y. Hwu, J.Hanson, F. Zanini, and G. Margaritondo, Phys. Rev. Lett.63, 1845 (1989)
doi:10.1103/PhysRevLett.63.1845 PMid:10040688
[4] Y. Chang, Y. Hwu, J.Hanson, F. Zanini, and G. Margaritondo, J. Vac. Sci. Technol. A7, 717 (1989)
doi:10.1116/1.575872
[5] D. W. Niles, N. Tache, D.G. Kilady, M. K. Kelly, and G. Margaritondo, Phys. Rev. B34, 967 (1986)
doi:10.1103/PhysRevB.34.967
[6] C. Léandri, H. Oughaddou, J.M. Gay, B. Aufray, G. Le Lay, J.P. Bibérian, A. Ranguis, O. Bunk, R.L. Johnson, Surface Science, 573-2, 369 (2004)
[7] C. Leandri, G. Le Lay, B. Aufray, C. Girardeaux, J. Avila, M.E. Dávila, M.C. Asensio, C. Ottaviani, A. Cricenti, Surface Science, 574-1, 9 (2005)
[8] C. Polop, C.Rojas, J. A. Martin-Gago, R. Fasel, J. Hayoz, D. Naumovi and P. Aebi, Phys. Rev. B63, 115414 (2001)
doi:10.1103/PhysRevB.63.115414
[9] C. Rojas, F. J. Palmares, M. F. Lopez, A.Goldoni, G. Paolucci and J. A. Martin-Gago, Surf. Sci 454-456, 778 (2000)
doi:10.1016/S0039-6028(00)00183-7
[10] J. S. Tsay, A. B. Yang, C. N. Wu, F. S. Shiu, Thin solid films (2007). [11] H. Menard, A.B. Hom, S.P. Tear, Surf. Sci. 585, 47 (2005).
[12] B. Lalmi, C. Girardeaux, A. Portavoce, J. Bernardini, B. Aufray, J. Nanosci. Nanotechnol. 8, 1-5 (2008)
doi:10.1166/jnn.2008.N03 PMid:18468051
[13] C. R. Helms, Surf. Sci. 69, 689 (1977). doi:10.1016/0039-6028(77)90143-1
[14] Paul Wynblatt, Wei-Chun Cheng, and Yinshi Liu, Prog. in Surf. Sci. 48, 261 (1995). doi:10.1016/0079-6816(95)93433-8
[15] J. Eugène, B. Aufray and F. Cabané, Surface Science, 241, 1 (1991) doi:10.1016/0039-6028(91)90204-6
[16] G. Tréglia, B. Legrand, J. Eugène, B. Aufray, F. Cabané, Phys. Rev. B 44, 5842 (1991) doi:10.1103/PhysRevB.44.5842
[17] C.S. Smith, “Constitution and microstructure of Copper-rich-Silicon alloys” Trans. AIME, 137, 313 (1940)
[18] M. Laguës, J.L. Domange, Surf. Sci. 47, 77 (1975) doi:10.1016/0039-6028(75)90273-3
[19] Z. Erdelyi, A. Taranovskyy and D.L. Beke, Surface Science 602, 805 (2008) doi:10.1016/j.susc.2007.12.013
[20] F.D.Reinke, C.E.Dahlstrom Phil. Mag. 22, 57 (1970)
[21] S.M.Klotsman, Ya.A.Robovskiy, V.K.Talinskiy, A.N.Timofeyev, Phys. Met. Metallogr. 31/2, 214 (1971)
![Fig 3 : Diffusion coefficients of Ge and Si in Cu as a function of temperature: comparison with radiotracer data previously published [20, 21]](https://thumb-eu.123doks.com/thumbv2/123doknet/14664202.740341/6.892.246.616.511.774/diffusion-coefficients-function-temperature-comparison-radiotracer-previously-published.webp)