HAL Id: tel-01205722
https://tel.archives-ouvertes.fr/tel-01205722
Submitted on 27 Sep 2015HAL is a multi-disciplinary open access archive for the deposit and dissemination of sci-entific research documents, whether they are pub-lished or not. The documents may come from teaching and research institutions in France or abroad, or from public or private research centers.
L’archive ouverte pluridisciplinaire HAL, est destinée au dépôt et à la diffusion de documents scientifiques de niveau recherche, publiés ou non, émanant des établissements d’enseignement et de recherche français ou étrangers, des laboratoires publics ou privés.
Metastable β Ti-Mo Based Alloys with TRIP and TWIP
Effects
Jinyong Zhang
To cite this version:
Jinyong Zhang. Mechanical Behavior and Microstructural Evolution in Metastable β Ti-Mo Based Alloys with TRIP and TWIP Effects. Materials. Université Pierre et Marie Curie - Paris VI, 2014. English. �NNT : 2014PA066313�. �tel-01205722�
THESE DE DOCTORAT DE L’UNIVERSITE PIERRE ET MARIE CURIE
Ecole doctorale de chimie-physique et chimie analytique de paris-centre
Spécialité : science de matériaux Présentée par
M. JINYONG ZHANG
Pour obtenir le grade deDOCTEUR de l’UNIVERSITÉ PIERRE ET MARIE CURIE
Mechanical behavior and microstructural evolution in
metastable
Ti-Mo based alloys with TRIP and TWIP effects
Soutenue le 22 septembre 2014
Devant le jury composé de :
M. Yannick Champion Rapporteur
M. Eric Fleury Rapporteur
M. Thierry Gloriant Examinateur
M. Philippe Vermaut Examinateur
M. Fan Sun Encadrant
M. Frédéric Prima Directeur de thèse
M. Yvon Millet Invité
i
Table of contents
Table of contents ... List of Figures ... v List of Tables ... xi General introduction ... 1 Chapter 1 ... 7Metallu gi al a d ph si al a kg ou d of etasta le β tita iu allo s ... 7
1.1 Introduction ... 7
1.2 The alloying elements and the phases i etasta le β Ti-alloys ... 9
1.2.1 Alloying elements ... 9
. . Phases i Metasta le β tita iu allo s ... 11
. . . The β a d α phase ... 11
. . . The a te site phase α˝ ... 13
. . . The ω phase ... 14
. Phase t a sfo atio i etasta le β Ti-alloys ... 17
. . β to ω t a sfo atio ... 17
. . ω to α t a sfo atio ... 20
. . β to α t a sfo atio ... 22
. Defo atio e ha is i etasta le β tita iu allo s ... 23
1.4.1 Stress-induced martensitic transformation ... 24
1.4.2 Mechanical twinning ... 26
1.4.3 Dislocation slip ... 28
References: ... 28
Chapter 2 ... 33
Design of metastable β tita iu allo s sho i g TRIP/TWIP effe ts ... 33
2.1 Introduction ... 33
2.2 The d-electron alloy design method ... 34
2.3 Design of new metasta le β Ti-alloys with TRIP and TWIP effects ... 37
References: ... 42
Chapter 3 ... 43
Experimental procedure ... 43
3.1 Introduction ... 43
3.2 Fabrication and cold-rolling process ... 43
3.2.1 Ti-12Mo binary model alloy ... 43
3.2.2 Ti-9Mo-6W and Ti-12Mo-xZr ternary alloys ... 44
3.2.3 Cold-rolling procedure ... 45
3.3 Thermo-mechanical treatment and thermal analysis ... 46
3.3.1 Thermal treatment procedure ... 46
ii
3.4 Microstructural characterization methods ... 50
3.4.1 Optical microscope and mechanical polishing ... 50
3.4.2 X-ray diffraction ... 50
3.4.3 Electron backscattered diffraction (EBSD) ... 51
3.4.4 Transmission electron microscopy (TEM) ... 51
3.5 Mechanical Testing Tools ... 52
3.5.1 Vickers hardness Testing ... 52
3.5.2 Tensile Testing ... 52
References: ... 53
Chapter 4 ... 55
Me ha i al eha io a d i ost u tu al e olutio i etasta le β Ti-12Mo titanium alloy showing combined TRIP/TWIP effects ... 55
4.1 Introduction ... 55
4.2 Results ... 56
4.2.1 Tensile behaviour ... 56
4.2.2 Phase transformation characterization ... 59
4.2.3 Microstructural evolution ... 62 4.2.3.1 OM observations ... 62 4.2.3.2 EBSD analysis ... 65 4.2.3.3 TEM investigation ... 67 4.3 Discussion ... 75 4.3.1 Deformation mechanisms ... 75
. . . Defo atio i du ed ω phase ... 75
. . . “IM α’’ t a sfo atio a d e ha i al t i i g ... 77
4.3.2 Activation of deformation mechanism during three stage work-hardening process ... 79
4.4 Conclusion ... 82
References ... 84
Chapter 5 ... 87
Microstructural characterization and mechanical behavior of Ti-12Mo alloy subjected to low temperature aging treatment ... 87
5.1 Introduction ... 87
5.2 Experimental results ... 89
5.2.1 Investigation of Ti-12Mo mechanical behavior after LTA treatment .. 89
5.2.2 Phase transformation during LTA treatments ... 93
5.2.3 Deformation products ... 96
5.3 Discussion ... 101
5.4 Conclusion ... 104
References ... 105
Chapter 6 ... 107 Development of ternary Ti-Mo based alloys showing combined TWIP/TRIP effects 107
iii
6.1 Introduction ... 107
6.2 Results and discussions ... 108
6.2.1 Development of Ti-9Mo-6W ternary alloy ... 108
6.2.1.1 Tensile performances ... 108
6.2.1.2 Microstructural evolution ... 110
6.2.2 Ternary Ti-Mo-Zr alloys ... 117
6.2.2.1 Mechanical behavior ... 117
6.2.2.2 Phase constitutions and microstructure feature ... 119
6.3 Conclusion ... 129
References ... 130
Conclusions ... 131 Abstract ... 错误!未定义书签。
v
List of Figures
Figure page
Figure 1.1 Pseudo-binary phase diagram of Ti-alloys with the decomposition products of the β-phase. He e, β is the iti al i i u β sta ilize a ou t fo ea β o etasta le β allo s to etai β o pletel o ue hi g f o β phase field a d βs is the i i u a ou t of β sta ilize fo sta le β allo s; Tβ, RT, Ms and Mf refer to
the β-transus temperature, room temperature, martensite start and finish temperatures, respectively. ... 8 Figu e . The s he ati diag a of stal st u tu e of β a d h p α phase, their
lattice parameters and most densely packed planes and directions are also illustrated [1]. ... 12 Figure 1.3 The schematic diag a of ω phase diff a tio spot o the a < >β a d
< >β zo e... 15 Figure 1.4 The typical TEM micrographs and corresponding diffraction patterns of three
t pes ω phase. a e fi e a o-size ω pa ti les i the ate -quenched Ti-Mo alloys; (b) Plate-shaped ω i the ate -quenched Ti–30Nb–3Pd alloy [42]; (c) ellipsoidal ω pa ti les i Ti-Mo allo s; d u oidal ω pa ti les in Ti-V alloys; (e) and (f) the plate-like defo atio i du ed ω phase i the Ti-12Mo alloy upon strain. 17 Figure 1.5 (a) and (b) the three-di e sio s he ati diag a of latti e of β a d ω
phase, espe ti el ; Pla a a a ge e t of the β ato i pla es i the lattice. The 0, 1, 2, . . . sequences of atomic plane arrangements can be seen. (d) The planar arrangement of the ω ato i pla es i the ω latti e. As a e see the ω-lattice can be obtained from the bcc lattice by collapsing a pair of planes (1 and 2) to the middle (marked as 1.5) while keeping the third one (0 and 3) undisturbed. (e) the schematic figures fo the ideal otifs of β, pa tiall ollapsed ω a d full ollapsed ω st u tu es. The ABCABC sta ki g of pla es i the β a d AB'AB' sta ki g i the ollapsed ω st u tu es a e highlighted. Co pletel ollapsed {222} planes form a six-fold symmetry, whereas an incomplete collapse forms a three-fold symmetry along the <111> axis. (f) The displacement of {222} planes can also be visualized in terms of a sinusoidal displacement wave where upward movement is seen as a positive displacement and downward as negative displacement... 19 Figure 1.6 High-esolutio TEM i ages sho i g the u leatio of α f o ω a d ω/β
interface. (a) nucleatio of a α phase platelets i the o e of a ω pa ti le i LCB Ti- ased allo s; the pla a ohe e t i te fa e et ee α a d ω; u leatio of a α phase lath at a ω/β i te fa e i Ti-10-2-3 alloy. ... 21 Figu e . Nu leatio a d g o th odel of α-phase: a ω phase a ti g as
hete oge eous u leatio , α g o th f o ω o su ptio , ω disappea a e a d d α g o th f o β consumption [53]. ... 22
vi
Figu e . a the s he ati diag a of Bu ge s o ie tatio et ee α a d β phase; β/α t a sfo atio a cording to Burgers relationship ... 23 Figu e . A s he ati diag a of the effe t of β allo s o te t o β phase defo atio
mechanism. ... 24 Figu e . A s he ati illust atio e hi iti g latti e o espo de e et ee β a d a˝
phases. ... 25 Figure 1.11 Typical stress-strain curve for an alloy undergoing SIM (number donate
various stages during tensile test). ... 26 Figure 1.12 The schematic diagram of diffraction spot of {332}<11�> twinning and
{112}<11 > t i i g ith β zo e, espe ti el . ... 27 Figure 2.1 The general Bo–Md map with alloy vector ... 36 Figure 2.2 The magnified area in Bo-Md map presents different zones of deformation
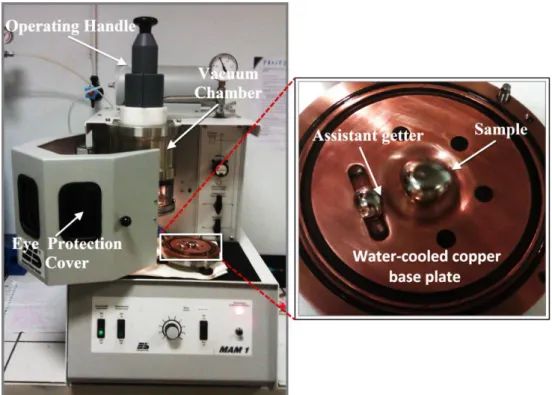
mechanisms. Ti-Mo/W vectors and the formulated chemical compositions are indicated in the map. ... 40 Figure 3.1 The simple procedure diagram of research route for investigated alloys. .... 44 Figure 3.2 The photograph of the vacuum arc melting furnace and melted sample. .... 45 Figure 3.3 (a) the scheme of rolling process; (b) as-quenched ingot and as-rolled sheet
of Ti-12Mo alloy. ... 46 Figure 3.4 (a) the water-quenched furnace apparatus and (b) the corresponding
schematic diagram of the water-quenched furnace. ... 47 Figure 3.5 Schematic illustration of the thermo-mechanical process for LTA treatment. ... 48 Figure 3.6 Circuit diagram of the experimental set-up for 4-point resistivity
measurements ... 49 Figure 3.7 (a) the tensile test device (INSTRON 5966) and (b) the dimension of the
sample for testing. ... 53 Figure 4.1 Tensile true strain/true stress curve of solution treated Ti-12Mo alloy is
shown in black line. The corresponding work-hardening ate, d /dε, is plotted i black cycles and the smoothed curve is shown in red. The monotonic raising of work-hardening rate reaches maximum value of about 2000 MPa from elastic limit to ε= . , the ea l stage of the plasti defo atio . ... 57 Figure 4.2 The stress-strain curve of first cyclic loading-unloading test is presented,
so e ha a te isti e ha i al data su h as the elasti st ai εe), the recovered
strain via reverse transformation after discharge εR, the plasti st ai εp) are also
indicated. ... 58 Figure 4.3 Three types of strain determined from the cyclic loading-unloading curves of
ST Ti- Mo allo a e plotted as a fu tio of st ai . The appa e t You g’s odulus at every loading cycle is calculated and also presented versus the strain. ... 59 Figure 4.4 In-situ synchrotron x-ray diffraction (SXRD) results. (a) SXRD patterns
corresponding to increasing deformation levels as well as before and after loading. The stress/strain curve is shown in the inset; (b) Final Pawley refinement on the “XRD p ofile afte elease f o . % st ai ; The shifti g of the ajo peaks of ω a d α’’ phases as a fu tio of applied defo atio ; d The e olutio of the
vii
i te sit of the ha a te isti peaks ω a d α’’ as a function of applied strain. ... 61 Figure 4.6 Some typical OM micrographs of the ST Ti-12Mo alloy at strains of 0, 0.02,
0.05, 0.15 and 0.25, respectively. ... 63 Figure 4.7 The area fraction of deformation bands is described as a function of strain in
tensile. The work-ha de i g ate, d /dε, is also plotted. ... 64 Figure 4.8 EBSD inverse pole figure maps shows complex deformation patte s at ε= %
a d ε= %. a T o t a sg a ula < > t i s i diffe e t o ie tatio s; Needle-like α’’ a te sites i β at i a e i di ated la k a o , a d a pie e of α’’ a te site i side the t i a d is i di ated hite a o ; “e e al pieces of < > t i s a e lo ated i o ple defo atio a ds; d T o ki ds of α’’ martensites in different orientations are shown in the deformation bands. Needle-like α’’ a te sites i β at i a e i di ated la k a o ; e I de tified {332 < > t i s i the o ple defo atio patte at ε= %; f T o ki ds of α’’ a te sites i the o ple defo atio patte at ε= %. A eas of u ide tified dark clusters and deformation bands with complex substructures are indicated by black arrows and white arrows respectively. ... 66 Figure 4.9 TEM images of the deformation-i du ed ω phase at ε= . a d ε= . . a
Bright-field image at ε= . . Da k-field image of the deformation-i du ed ω la ellae at ε= . . Da k-field image of the deformation-i du ed ω la ella at ε= . %. The o espo di g diff a tio patte s a e p ese ted i the i sets of ea h dark-field image, showing a difference of the diffraction intensity between the two a ia ts ω a d ω of the fou a ia ts of ω p e ipitates. ... 67 Figure 4.10 Bright-field TEM i age of a defo atio featu e ide tified as a luste of α’’
variants. The corresponding SAED pattern is given in the inset. ... 69 Figu e . TEM i ages of a sa ple defo ed to ε= . . a Diff a tio patte
exhibiting multiple phases; (b) corresponding dark-field image of the deformation products by selecting the diffraction spots highlighted in (a). Three morphologies of the deformation products are revealed, labelled as Z1, Z2 and Z3. (c) Indexed diag a o espo di g to β t i i g, ω phase a d t o ki ds of a a te site, oted as α’’ V a d α’’ V . ... 69 Figure 4.12 TEM images and schematic illustrations of the deformation induced α’’
a te sites ε= . % . a Da k field i age of t o ki ds of α’’ a te sites ε= . % , labeled by α’’V a d α’’V ; Da k field i age at the dash s ua e i a sho s the morphology of α’’V ; Da k field i age at the dash s ua e i a illust ates the twinned variant of α’’V , de oted α’’V ; d The diff a tio patte of a sho s orientation relationships among β, ω, α’’V a d α’’V ; e The diff a tio patte of the dash square area in (a) shows a twinning relationship between α’’V a d α’’V ; f The s he ati i de atio of d ; g The s he ati i de atio of e ... 70 Figure 4.13 TEM images of major deformation features. (a) Bright-field image of a set of
{332} <113> twin bands. (b) The corresponding SAED pattern illustrates twinning plane and twinning axis. (c) The magnified region shows the sub-structures of fine internal bands. (d) Bright-field image of the region after rotating and tilting the
viii
specimen. The corresponding SAED pattern is shown in the inset. Nanobeam diffractions (NBDs) were performed on the nanobands indicated by red dots. (e) Dark-field image in twin spot (DF) of the secondary twins marked by T2nd. (f) A schematic stereo projection figure to illustrate the crystallographic relationship of internal {332} <113> twin layers along the zone axis [010]//[1- β. ... 73 Figure 4.14 TEM images of the internal substructures in a primary twinning band. (a)
Bright-field image of the primary twinning band (T) with internal plate-like substructures. The corresponding diffraction pattern of the twin (inset) indicates spots of α’’ phase; Da k-field image illustrates two different kinds of the i te al plates, hi h a e se o da “IM α’’ α’’2nd) and secondary mechanical
twinning (T2nd), respectively; (c) Nano-beam diffractions (NBD) indicates a {332}
type twinning relationship between the primary twin (T) and secondary twin (T2nd); (d) Schematic indexation of superposed NBD patterns demonstrates the twinning relationship by sharing (3-2-3) plane. ... 74 Figure 4.15 TEM images of microstructures after tensile fracture. (a) Bright-field image
illustrates fine fragments of the mechanical twins; (b) Bright-field image shows thi α’’ “IM plates i the defo ed β at i . The o espo di g diff a tio patte is shown in the inset. ... 74 Figure 4.16 Schematic illustration of the evolution of the microstructure of the Ti–12Mo
alloy when deformed in tension. The activation sequence of different deformation mechanisms is shown from the ST state to the early deformation stages (Stages I and II), i.e. deformation-i du ed ω phase, e ha i al t i i g a d “IM a″. The secondary deformation twins and SIM α" phase a e de oted ith su s ipt d . ... 80 Figure 5.1 Tensile performances of the ST specimen and LTA specimens, (a) true strain –
true stress curves of the specimens at ST state and after 60s LTA treatments, (b) specimens at ST state and after 600s LTA treatments. ... 90 Figure 5.2 Summary of tensile properies of the ST specimen and LTA specimens, (a)
plotting of yield stress and plastic strain of LTA specimens as a function of aging temperature, (b) plotting of work-hardening strength versus uniform plasticity. 3 groups of LTA specimens are divided by their apparent tensile performances. ... 92 Figure 5.4 Relative electrical resistivity measurements on ST Ti-12Mo material, (a)
non-isothermal scanning from room temperature to 500°C at a heating rate of 2°C/minute, (b) isothermal aging for 600s at 110°C, 160°C and 260°C, respectively, show the thermal induced phase evolution at each LTA process. ... 95 Figure 5.5 XRD profiles of the specimens after tensile deformation, (a) after LTA 60s, (b)
after LTA 600s. ... 97 Figure 5.6 TEM observations of deformation mechanisms in LTA 160°C/60s specimen
after strain. (a) Bright-field i age of defo atio i du ed α’’ phase at a g ain boundary (GB) with the corresponding SAED pattern (inset) at a zone axis of < >β, da k-field image of the SIM α’’ plates. B ight-field i age of a β matrix (M) with stress-induced ω la ellas, SIM α’’ plates a d a < > β t i (T). The corresponding SAED pattern is shown with a schematic illustration of the
ix
twinning configuration, (d) the dark-field image of stress-induced ω la ellas. e Bright-field i age of a p i a < > β t i T st ith i te al sub-structures. A diffraction pattern on the selected area (SA) at the twinned zone shows secondary twinning (T2nd) feature of {112}<111> configuration and SIM α’’ signature, (f) the corresponding dark-field image of {112}<111> T2nd morphology. ... 99 Figure 5.7 TEM observations of deformation mechanisms in LTA 160°C/600s specimen
afte st ai . a “AED patte i set at < >β zo e a is sho i g sig atu es of ω phase a d α’’ phase. The o espo di g da k-field image of stress-induced ω lamellas, (b) the corresponding dark-field of SIM α’’ plate. B ight-field image of < > β t i s. A “AED patte at < >β zo e a is sho s the s he ati twinning configuration, (d) dark-field i age of the < > β t i s. ... 100 Figure 5.8 TEM observations of deformation mechanisms in LTA 260°C/60s specimen
after strain. (a) Bright-field image shows stress-induced ω plates ith p e ipitate obstacles on the edges, (b) the corresponding dark-field image of the stress-induced ω plates. ... 100 Figu e . The d-ele t o design map with Ti-Mo/W vectors presents different zones
of deformation mechanisms. And the formulated chemical compositions of so-designed ternary alloys are indicated in the map. ... 108 Figure 6.2 (a) True strain-stress curves of Ti-9Mo-6W and Ti-12Mo under uniform
plastic deformation, (b) plots of work-ha de i g ate d /dε as a fu tio of t ue stress of two alloys... 110 Figure 6. 3 The XRD profiles of Ti-9Mo-6W deformed samples at different strain levels. ... 111 Figure 6.4 EBSD mapping of the Ti-9Mo-6W alloy after deformation, (a) orientation
appi g of β phase, o ie tatio appi g of defo atio i du ed α’’ phase. Three grains of interest are labelled by A, B and C. The maximum resolved shearing di e tio s o the appi g pla e a e sho τ a d τ , espe ti el . ... 112 Figure 6.5 TEM investigations on a zone similar to the marked area in Grain B (Fig. 2). (a)
TEM bright field image; (b) a {332}<113> twinning interface with (c) identification o sele ted a ea diff a tio patte “ADP ; d ACOM TEM appi g o α’’ phase distribution and orientation; (d) misorientation measured between 1st α’’ a d nd
α’’. ... 115 Figure 6.6 TEM investigations on a band similar to the marked area in Grain A and C (Fig.
2). (a) TEM bright field image of the band; (b) ACOM TEM appi g o α’’ phase distribution; (c) a schematic drawing of the deformation bands, formed in olle ti e ethod a o g ω la ellas, t i i g a d α’’ a te sites. Th ee nano-beam diffraction patterns (NBD1, NBD2 and NBD3) are presented correspond to the locations marked in (a) and (b). ... 116 Figure 6.7 (a) True strain-stress curves of Ti-12MoXZr (X=1, 3, 5) and Ti-12Mo under
uniform elongation, (b) plots of work-ha de i g ate d /dε as a fu tio of t ue stress of two alloys... 118 Figure 6.8 The XRD profiles of the Ti-12Mo-xZr materials at as-quenched state. ... 119
x
Figure 6.9 The TEM images of the deformation-i du ed ω phase at the o set of plastic deformation. (a) Bright-field image and (b) Dark-field i age of the ω phase i matrix, respectively. The corresponding diffraction patterns are presented in the insets of dark-field image. ... 120 Figure 6.10 (a) The X-ray diffraction profiles of the deformed samples of Ti-12Mo-xZr
allo at ε= . . The X-ray diffraction profile of the deformed sample of Ti-12Mo material is also plotted as a reference; (b) The integrated XRD intensity of residual “IM α˝ as a fu tio of o te t of ) ele e t, the lue li e is the XRD i te sit atio et ee α˝ a d β, the la k li e is the XRD i te sit atio et ee α˝ a d β. ... 121 Figure 6.11 The TEM images of primary {332}<113> twinning of the Ti-12Mo-1Zr
sa ple st ai ed at ε= . . a the ight field of the {332}<113> twinning and matrix, three selected areas were plotted by dash solid which taken from the boundary region of the deformation plates and the matrix. The trace of two variants of {332}<113> twinning were also indicated; (b-d) the diffraction patterns of “A , “A a d “A , espe ti el . The zo e a is of the “AD is β. ... 123 Figure 6.12 The TEM images of secondary {332}<113> twinning of the Ti-12Mo-1Zr
sa ple st ai ed at ε= . , he e is take f o o e of defo atio plates at site SA1 in Figure 6.11. (a) and (b) the bright and dark field image of the secondary {332}<113> twinning, respectively; (c) the corresponding diffraction pattern of the sele ted a ea i a , the zo e a is is β; d the s he ati diag a of ... 124 Figure 6.13 The TEM images of substructure of the Ti-12Mo-5Zr sample strained at
ε= . . a a d the ight a d da k field i ages of su st u tu e, espe ti el . Two selected areas (SA) were also indicated on the bright field image; (c) the corresponding diffraction pattern of SA1; (d) the corresponding diffraction pattern of SA2. ... 125 Figure 6.14 The recovery strain determined from the reversible “IM α" as fu tio of
strain are plotted for the Ti-Mo based alloys. ... 126 Figure 6.15 The evolution of relative electrical resistivity of Ti-12Mo-xZr materials as a
function of temperature. The cooling process (black dash curve) and heating process (color curve) were also presented. ... 129
xi
List of Tables
Table page
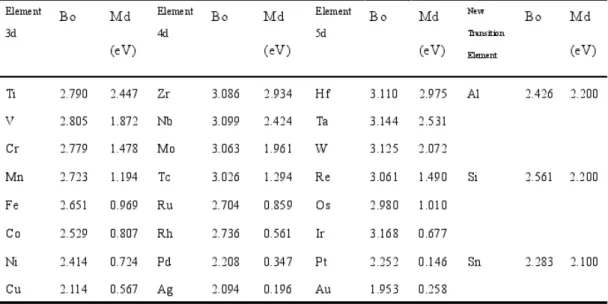
Ta le . list of Bo a d Md alue fo β-Ti alloys ... 35 Table 2.2 The composition, Bo and Md, e/a and [Mo]eq for designed alloys ... 41 Table 3.1 Ingot chemical composition (wt.%). ... 43 Table 4.1 Microstructural features for Ti-12Mo alloy during uniform plastic deformation
... 80 Table 5.1 Tensile properties and Vickers hardness of the heat-treated specimens for Ti-12Mo alloy. ... 91 Table 6.1 Tensile properties and Vickers hardness of the Ti-Mo-Zr alloys ... 118
1
General introduction
Titanium and its alloys have been extensively used in numerous application fields in the last ten years, due to their unique feature of properties such as high strength, low density, excellent biocompatibility and good corrosion resistance. However, both their low ductility (total elongation typically less than 0.20) and their lack of work-hardening when compared with steels or Co-Cr alloys, limit their use in advanced applications where superior combinations of strength and ductility are required. As a consequence, it is necessary to develop new Ti-alloys with combination of high strength, large ductility and a high work-hardening rate. Therefore, inspired from the superior mechanical properties of TRIP/TWIP steels (TRIP for Transformation Induced Plasticity and TWIP for Twinning Induced Plasticity), we proposed a new type of metastable β Ti-alloys showing combined TRIP/TWIP effects. This alloy was designed based on the d-electron alloy design method and controlling of electron/atom ratio (e/a).
The preliminary experimental results show that the so-designed alloy at as-quenched state displays high strength, large plasticity and an improved work-hardening rate thanks to simultaneous TRIP and TWIP effects. In order to fu the i estigate the elatio et ee the β sta ilit a d TRIP/TWIP effe ts, t o strategies were applied on the binary model alloy. One is thermal-treatment, i.e. Low temperature aging (LTA), which is carried out on the binary model alloy to a ipulate β/ω phase t a sfo atio . The o je ti e of this st ateg is to o t ol the ω phase t a sfo atio ithout e essi e odifi atio of β at i he i al composition, keeping the possibility for combined TRIP and TWIP effects to occur. The other is chemical composition modification, i.e. alloying development of ternary compositions by adding third alloying elements into the binary model alloy, which is proposed to shift the alloying position along the model alloy design route. The objective is to enlarge the titanium TRIP/TWIP family of alloys to ternary metastable
2
β Ti-alloys. Two sets of ternary alloys were designed. The first one is Ti-9Mo-6W (wt. %) alloy, in which the Bo and Md of this alloy located in the line with the same stability of designed binary alloy. The second one is Ti-12Mo-xZr (x=1, 3, 5) (wt. %) alloys to investigate the influence of the neutral element Zr on mechanical and microstructural behavior. The mechanical behavior and microstructural evolution were investigated for these ternary alloys.
This dissertation is organized into six chapters.
Chapter 1 provides a general introduction of physical metallurgy of metastable β Ti-alloys. At the beginning of this chapter, alloying elements were classified based on their influence on the β transus temperature (Tβ) and martensite start temperature (Ms) in metastable β Ti-alloys. With respect to influence for the β transus (Tβ), alloying elements are usually classified into neutral, α-stabilizers, o β-stabilizers. However, the influence of alloying elements on martensite start temperature (Ms) is still of conflict, due to so-called α-stabilizers or neutral elements decreased the martensite start temperature (Ms) and worked as the β-stabilizing elements. Then, an overview is given about different phases and their transformation in metastable β Ti-alloys. There are many phases and phase transformation involved. These phase can be classified into equilibrium phase (α and β phase) and non-equilibrium (i.e. ω) depending on whether enough time has been allowed to reach steady state condition. The corresponding phase transformation, such as β->α, β->ω, ω->α and β->α″ (stress-induced martensite), will occur during the thermo-mechanical treatment. Finally, the deformation mechanism occurred in etasta le β Ti-alloys, e.g. dislocation slip, mechanical twinning and stress-induced phase transformation, are provided. The activation of such deformation mechanisms completely depends on the sta ilit of the β phase.
In Chapter 2, we firstly introduce several alloy design strategies often used in designing the tita iu allo s, su h as trial-and-e o method, the empiric Mo
3
equivalent and the semi-empiric d-electron alloy design method . Espe iall , the dele t o allo desig ethod was in detail given (called the Bo–Md map). Based on the Bo–Md map, a binary model alloy was designed to be Ti-12Mo (wt. %). The model of binary Ti-12Mo alloy shows high strength, large ductility and high work-hardening rate due to combined TRIP and TWIP effects.In order to further enlarge the titanium TRIP/TWIP family of alloys to ternary metastable β Ti-alloys, the third alloying elements were added into the Ti-12Mo alloy based on the design route of Ti-12Mo alloy. Thus, the ternary Ti-Mo based alloys (Ti-9Mo-6W and Ti-12Mo-xZr (X=1, 3, 5)) were designed, and the designed procedure was also introduced in detail in this chapter.
In Chapter 3, we introduce experimental techniques and analytical software used for elaboration, manufacturing, heat-treatment and characterization of the designed alloys. The alloys were melted by vacuum arc melting furnace. Then, the ingots were homogenized at 900°C for 24h under high vacuum of 10-6 Pa using our laboratory self-designed device, followed by water quenching. Subsequently, the as-quenched ingots were cold-rolled into sheets with the thickness of 0.5mm. Taking from the sheets, tensile samples were prepared and heat-treated based on different heat-treatment strategies. Finally, several characterized tools, such as conventional X-ray diffraction (XRD), In-situ Synchrotron X-ray diffraction (SXRD), electron backscatter diffraction (EBSD), electrical resistivity measurements (ERM), transmission electron microscopy (TEM) and Automatic crystal orientation measurements (ACOM) TEM, were carried out to investigate the deformation mechanisms, phase transformation and microstructure evolution sequence.
The Chapter 4 described the mechanical behavior and microstructural evolution of the binary model Ti-12Mo alloy. The tensile experimental results display that the model alloy exhibits excellent mechanical performances: high strength (~1000MPa), large uniform ductility (ɛ=0.38) and a significant work-hardening effect close to the
4
theoretical limit. The uniform plastic deformation was separated into three stage based on the evolution of the work-hardening rate. In the early deformation stage, p i a st ai /st ess i du ed phase t a sfo atio s β->ω a d β->α’’ a d p i a mechanical twinning ({332}<113> and {112}<111>) are simultaneously activated. Secondary martensitic phase transformation and secondary mechanical twinning are the t igge ed i the t i ed β zo es. At the e d of the u ifo plasti defo ation, a complex deformation microstructure was observed, showing highly disturbed matrix induced by a high volume fraction of twins and occurrence of multiples secondary mechanisms. The evolution of the deformation microstructure results in a high work-hardening rate (~2GPa) bringing about high tensile strength (~1GPa) and large uniform elongation (> 0.38).
In Chapter 5, Low temperature aging (LTA) treatments were performed on the model Ti-12Mo alloy and the influence of on mechanical performance and microstructure was studied. The aim is to improve the mechanical property by controlling the activation of various deformation mechanisms, i.e. stress-induced phase transformations and mechanical twinning. A set of short-time LTA treatments were applied at 110°C, 160°C, 260°C and 310 °C for 60 and 600s, respectively. At LTA < Tωiso, e ha i al pe fo a es a e la gel e ha ed f o solutio -treated (ST) state. A superior combination of high strength (close to 1200MPa of true stress) and a stable plasticity of ɛ=0.4 (true strain) was achieved with a significant work-hardening effe t. At LTA > Tωiso, the work-hardening effect and uniform plasticity are gradually ceased with increasing of tensile strength. The investigation of deformation mechanisms revealed the key role of deformation induced ω precipitation played in the activation of different deformation modes. Due to the precipitation of isothermal phases induced by LTA, the progressive inhibition of deformation induced ω led to important variations of tensile behaviors.
Chapter 6 presented the mechanical and microstructural behaviors of the ternary Ti-Mo based alloys. The chapter also discussed the effect of the third alloying
5
element (W or Zr) on the TRIP and TWIP effects. There were two objectives of adding third alloying elements into the model Ti-12Mo: (1) to validate the possibility of theo eti al p edi tio f o d--electron design method in the ternary composition about practical alloying developments and performance optimization; (2) to investigate the relationships between stress-induced phase transformations and mechanical twinning in the new ternary system.
Finally this work ends with conclusion of the relationship between alloying design method and deformation mechanism, where microstructural evolution in Ti-12Mo alloy, the influence of LTA treatments on evolution of deformation modes and effects of third alloying elements in mechanical and microstructural behaviors are discussed in detail.
7
1
Chapter 1
Metallurgical and physical background of metastable
β
titanium alloys
1.1
Introduction
Titanium and its alloys have been more and more used in numerous application fields in recent several decades. Generally, Ti-alloys are classified into three main categories: α, α+β and β alloys, depending on their composition, thermo-mechanical processing and their final microstructure [1, 2]. The change of the Ti-alloys type depending on the β-stabilizer content is shown schematically in Figure 1.1. At the beginning, the β-stabilizer content is negative (α-Stabilizers), only α phase structure occurs. And with β-stabilizer content increasing, a α + β st u tu e de elops. Then the metastable β phase structure occurs when adding higher β-stabilizer content, located between βc a d βs. Here, βc is the minimum critical level of β stabilizer for etasta le β allo s to etai β o pletel upon ue hi g f o β phase field, and βs is the minimu a ou t of β sta ilize fo sta le β allo s. The metastable β phase is still within the two-phase region, although it can quench to retain 100% β phase in such alloys. The metastable β-type alloys will precipitate a second phase (usually α phase) upon aging. Finally, o l sta le β-phase presents when a o e βs. The metastable β-type Ti-alloys and stable β-type Ti-alloys, both are included in the β-type Ti-alloys [3].
Compared with α+β allo s, β alloys seem be the most versatile class of Ti-alloys due to their increased heat treatability, wide and unique range of strength-to-weight
8
ratios, deep hardening potential, and improved ductility [1, 4]. In addition, they also possess superior fatigue resistance as compared to α+β alloys [1, 4]. As shown in Figure 1.1, β-type alloy is defined as a titanium alloy with sufficient β-stabilizer content to suppress the martensitic transformation when quenching to room temperature. This means that 100% β phase is retained. “i e the ’s, the development and application of the β-type alloys has been described in the literature [1, 5]. Recently, these alloys can be found in aerospace, sporting goods, automotive, orthopedic implant, and oil well systems [1, 3, 4]. For example, Ti-10-2-3, Beta C, Ti-15-3, TIMETAL 21S, and BT22 [6] are used for structural components; Ti17 is used for gas turbine engine compressor discs [6]; and Gum metal alloy is used in implant materials [7].
Figure 1.1 Pseudo-binary phase diagram of Ti-alloys with the decomposition products of the β-phase. Here, β is the iti al i i u β sta ilize a ou t fo ea β o etasta le β allo s to etai β o pletel o ue hi g f o β phase field a d βs is the i i u a ou t of β sta ilize fo sta le β allo s; Tβ, RT, Ms and Mf refer to the β-transus temperature, room temperature, martensite start and finish temperatures, respectively.
9
Ti-alloys seem to attract more interest because of their superior properties such as the superelasticity, shape memory effects, low You g’s odulus and better formability [8-10]. The mechanical properties of metastable β Ti-alloys depend st o gl o the p ese e of se e al phases e.g., ω phase a d a te siti α" phase) in them. The appearance of these phases could be controlled by either the optimized alloy design [7, 8] or the materials processing [11]. The phases presented in the alloy are related to the alloying elements and the thermal history of the alloy. Moreover, the activation of deformation modes, such as dislocation slip, mechanical twinning and stress induced martensitic transformation (SIM), depend on the β phase stability [8]. Therefore, it is necessary to make a general introduction about the physical metallurgy of the metastable β Ti-alloys before designing new metastable β Ti-alloys showing large ductility and high work-hardening rate.
1.2
The alloying elements and the phases in metastable β
Ti-alloys
1.2.1
Alloying elements
As seen in the Figure 1.1, metastable β Ti-allo s lie i the a ea et ee β a d βs. In the region, two key parameters are referred: the β transus temperature (Tβ)
and martensite start temperature (Ms). The Tβ is used in determining the Ti-alloys type. The Ms is used to manipulate the deformation behavior of metastable β Ti-alloys. Both of the two parameters are closely related with β-stabilizer content. In these alloys, the controlling of the β-phase stability by alloying elements is crucial to control the activation of deformation mechanisms at room temperature.
Alloying elements have their own attributes in effecting the two parameters. With respect to influence on the β transus (Tβ), alloying elements are usually classified into neutral, α-stabilizers, o β-stabilizers. Alloying elements like Al, Ga, B,
10
“ , La, Ce, Ge, C, O a d N aise the β-transus temperature and hence are called as α stabilizers [1, 2, 12]. The element Al is the most commonly used α sta ilize . On the contrary, alloying additions of V, Mo, Nb, Hf, Ta, Mn, Cr, Cu, Ni, Fe, Co, Au, Ag, W, Pt and Pd can lo e the β t a sus te pe atu e a d ause a sta ilizatio of phase at lower temperatures, thus are regarded as β stabilizers [1, 2, 12]. However, the influential capacity on the Tβis a ious fo diffe e t β-stabilizer elements. Generally, an empirical expression, called Mo equivalent, is used to get a quantitative value for the β phase sta ilizatio effe t of i di idual ele e ts [1]. The molybdenum equivalent (Moeq) can be expressed by the following equation [13]:
[Mo]eq=Mo Nb/3.6 Ta/4.5 W/2.27 Cr/0.63 Mn/0.65 V/1.5 Fe/0.35
Ni/0.8+Co/0.7-Al
In addition to the above α and β stabilizers, there exist some elements (i.e. Zr, Hf and Sn) considered as neutral elements since they have (nearly) no i flue e o the α/β phase boundary [1]. These neutral elements can completely dissolve i the α a d β phases of titanium.
However, regarding the influence of alloying elements on the martensite start temperature (Ms), some controversies still remain in scientific researches. It has been recognized that the Ms Temperature decreases monotonically with increasing content of the β-stabilizing elements in the metastable β Ti-alloys. For example, Kim et al. [14] reported a linear relationship between Ms and Nb content for Ti-Nb binary alloys (Ms decrease by 40 K per 1 at% for Nb element). As for the so-called α-stabilizing elements or neutral elements (i.e., O, Al, Zr and Sn), the elements in beta solid solution have been shown to decrease the martensitic start temperature (Ms) and retard ω phase formation [15]. It has very recently been suggested that O enhances the shuffle associated with the martensite transformation, while suppressing the Bain distortion [20]. For example, the Ms temperature in a Ti–Nb
11
[18], Ti–Nb [17], and Ti–Ta [19] alloys and the addition of O or Zr to Ti–Nb alloys [10, 20] give a similar effect for martensite start temperature (Ms). In this sense, O, Al Zr a d “ a e o lo ge the α-sta ilizi g ele e ts, ut o k as the β-stabilizing elements in these metastable β-type Ti-alloys. Ho e e , o ge is still a α-stabilizing ele e t i the aged o ditio , si e the a ou t of the α-phase precipitated during aging increases with the oxygen content in the alloy [21].
Recently, based on the combination of the two parameters (Tβ and Ms), our groups and co-workers [22] proposed a coefficient of ΔT (Tβ-Ms) that can be promoted to evaluate the β phase stability in the metastable β Ti-alloys. We have proved the availability of the ΔT via equiatomic substitution of Nb by Zr in Ti-Nb-Zr alloys system. The results [23] show that the more for the coefficient ΔT, the better for superelasticity in Ti-Nb-Zr alloys.
1.2.2
Phases in Metastable β titanium alloys
Metastable β Ti-alloys possessed excellent mechanical properties completely depend on their final microstructure. In the metastable β region, there are several phases and phase transformation involved. These phases can be classified into β, α, α″ and ω (athermal ω, isothermal ω and deformation induced ω). The corresponding phase transformation, such as β->α, β->ω, ω->α and β->α″ (stress-induced martensitic transformation), will occur during the thermo-mechanical treatment. The phase transformation of β->α, β->ω, ω->α will be introduced in section 1.3. And the phase transformation β->α″ (stress-induced martensite transformation) upon deformation will be described in section 1.4.
1.2.2.1
The and phase
Similar with α+β alloys, the structures of α and β phase in the β alloys are HCP and BCC structure, respectively. The β phase is sta le at high te pe atu e and can be
12
retained du i g ue hi g f o a o e β t a sus te pe atu e Tβ) to room temperature (RT). The space group of β phase is Im m with two atoms at (0, 0, 0) and (1/2, 1/2, 1/2) coordinates [1, 2]. The ato i u it ell of β phase is s he ati all shown in Figure 1.2(a). The latti e pa a ete : a= = = . , α=β=γ= / , and the most close-pa k pla es a d di e tio s a e β a d < >β, espe ti el .
Figure 1.2 The schematic diagram of c stal st u tu e of β and hcp α phase, their lattice parameters and most densely packed planes and directions are also illustrated [1].
The α phase can be precipitated when the alloys are quenched at low cooling ate f o te pe atu e a o e β t a sus o upo agi g at the α p e ipitatio temperature range. T o t pes of α phase has ee epo ted [3, 24]. One obeys the Bu ge ’s o ie tatio elatio alled Bu ge ’s α o t pe α ; the othe does ot o e that relation, but is instead oriented in a complex and incompletely understood manner (called non-Bu ge ’s α, o t pe α [3, 24].
The Bu ge ’s α he eafte alled α phase stallizes at oo te pe atu es i a modified ideally hexagonal close packed structure (HCP). The spa e g oup of α phase is P63/mmc with two atoms per unit cell at (0, 0, 0) and (1/3, 2/3, 1/2) positions. The
he ago al u it ell of α phase is also sho i Figure 1.2(b). The lattice parameters at the oo te pe atu e: a= = . = . , a d α=β= / ,γ= / . The /a
13
ratio is about 1.587, smaller than the ideal ratio of 1.633 for the hexagonal close-packed crystal structure. As indicated in Figure 1.2(b), there are three most densely packed types of lattice planes. One is the {0001} plane, also called basal plane; another one is the { 010} planes, also called prismatic planes; and the last one is the {10 1} planes, also called pyramidal planes. The three a1, a2, and a3 axes are the close-packed directions with the indices <1120 >.
1.2.2.2
The martensite phase ( ˝)
Martensitic transformations are diffusionless, shear (displacive) solid state structural transformations. The transformation is most commonly driven by mechanical deformation or by a change in temperature [25]. Thus, the martensite phase can be classified into athermal martensite phase and stress-induced martensite phase α˝ (SIM) based on their formation condition. As for athermal martensite phase, their transformations from β phase were close related to the martensite start temperature (Ms) depending on the β stability [25]. The athermal α˝ transformation is hard to occur in the metastable β Ti-alloys due to the martensite start temperature (Ms) far lower than room temperature. However, the SIM α˝ often occurs in the metastable β Ti-alloys upon deformation, bringing about such peculiar properties as superelasticity and shape memory effects. Thus, the SIM α˝ phase often was investigated in the metastable β Ti-alloys. The detailed information about SIM α˝ transformation was listed in in section 1.4.
The SIM α˝ phase has an orthorhombic structure with the same structure of athermal α˝ [14]. The additional shuffling of atoms in alte ate β pla es esults in a C-centred orthorhombic crystal structure with a Cmcm space group [26]. The atoms located at (0, 0, 0) (1/2, 1/2, 0), (0, 1-2y, 1/2) and (1/2, 1/2-2y, 1/2) positions, for example, the alue of ≈ . i Ti-Nb alloys [27]. Thus, α" a e ie ed as a
14
transitional phase between the α he ago al st u tu e a d the β BCC structure. Indeed, alte i g the alues of /a, /a a d , all th ee st u tu es, α, α" a d β, will be produced alternative.
1.2.2.3
The ω phase
The metastable ω phase is the important feature of metastable β alloys. The fo atio of the ω phase can affect mechanical properties of β phase Ti-alloys [28]. Several overviews [28-30] about ω phase have been reported. Here, the structure, classification and morphology of the ω phase are briefly introduced.
The occurrence of the ω phase was first reported in 1954 by Frost et al. [31] on Ti-Cr alloys. Since then, the metastable ω phase has been found in the other Group IV transition metals (such as zirconium and hafnium). The ω structure has been determined to be either hexagonal (belonging to the space group (P6/mmm)) or trigonal (belonging to the space group (P3m1)) depending on the extent of transformation. Upon the complete transformation, the ω phase has a hexagonal symmetry, while the incomplete transformation, the structure is a trigonal system. Both structures contain 3-atoms/unit cell and can be derived from the parent bcc structure by simple atom movement. The equivalent positions are: 0,0,0; 2/3,1/3,1/2; 1/3,2/3,1/2 for ideal hexagonal, and 0,0,0; 2/3,1/3,1/2+z; / , / , / −z <z< . for rumpled structure. Here, when z=0, ω structure is an idea structure with hexagonal symmetry, and when z=1/6, ω structure is a cubic symmetry.
The size of ω phase is very small in metastable β Ti-alloys. It is reported that its size varied from less than 6nm in the as-quenched condition to about 300nm just before its t a sfo atio to α [29, 32]. Thus, the transmission electron microscope (TEM) technique was often applied to observe its size, morphology and distribution. The β-ω phase i tu e e hi its special diffraction patterns, which enable it to be
15
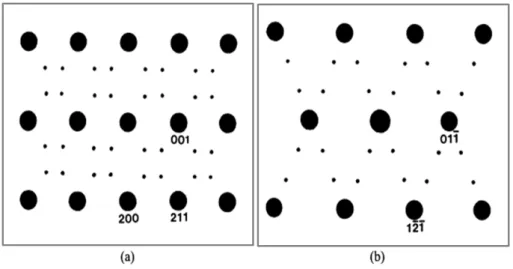
easil ide tified. I ge e al, the ω phase a e ide tified f o the supe latti e diffraction spots excited at various 1/3<112>β and 1/3<112>β positions on the < >β a d < >β zo e patte s of β phase as illust ated i Figure 1.3.
Figure 1.3 The schematic diagram of ω phase diffraction spot on the (a) <110>β and (b) <1 >β zone.
Generally, the ω phase in the β matrix can be classified into three types based on their formation condition, i.e. athermal ω phase (ωath), isothermal ω phase (ωiso)
and deformation induced ω phase upon strain.
Athermal ω: usually precipitates during water quenching from the high te pe atu e β a ge. Whe the β-stabilizer content is over a limited range of solute content that is close to the lower limit for the retention of β phase, a metastable phase called athermal ω phase occurs from β phase. The ωath precipitation is a
diffusionless transformation. The formation rate of ωath phase is too extremely rapid
to be suppressed. Bagaryatskiy and Nosova et al. [33] showed that in a Ti-6(wt. %) Cr alloy the ωath formation was not suppressed even at cooling rates as high as
11000 °C/sec.
Isothermal ω: generally precipitates during aging at a temperature below about 773K [30], controlled by combination of displacive and diffusion process [34, 35]. When the alloys are at higher alloying content, the isothermal ω phase fo s du i g
16
aging in a temperature range of 100 to 500°C. The nature of this isothermal ω phase depends on the holding time and the quenching rate. More precisely, the volume f a tio of isothe al ω i eases ith i easi g holding time and decreasing quenching rate until phase precipitation reaches to saturation. It is now recognized that isothe al ω phase is a continuation of the athe al ω t a sfo atio [34, 35].
Deformation-i du ed ω: forms in the β-stabilized alloys upon shock loading. Some studies [36-40] have showed that the deformation-i du ed ω phase has been found in metastable Ti-alloys upon deformation at room temperature. Banerjee et al. [28] proposed that the deformation-induced ω phase is almost same to the athermal ω phase. They thought that the formation condition of deformation-induced ω phase in the shock loading experiment is equivalent to the athermal treatment, because the du atio of the sho k loadi g is t pi all of the o de of a fe s, diffusi e ato movement is negligible.
The morphology of three types of ω phase displays different microstructural profiles. The athermal ωsize is very smaller and its distribution is random and indefinite. The morphology of athermal ω phase is usually fine particles [23]. A typical TEM image of ωath phase is shown in Figure 1.4a. However, Ping et al. [42]
found that the athermal ω phase is plate-shape in a Ti–30Nb–3Pd (wt.%) shape memory alloy during quenching (Figure 1.4b). Compared with athe al ω particles, the isothermal ω precipitation could be distinguished by its slightly larger size and a o positio g adie t alo g the ω/β i te fa e. Usually, the size of isothermal ω phase are in the range of 10-20nm. The morphology of isothermal ω phase can either be cuboidal or ellipsoidal in Ti-Transition metal alloys [43, 44] in term of the lattice misfits (Figure 1.4c and d). As described in some overviews [28-30], the high misfit binary alloys of Ti-V, Ti-Cr, Ti-Mn, and Ti-Fe are reported to have a cuboidal morphology. However, the low misfit binary alloys of Ti-Mo and Ti-Nb are reported to form precipitates with ellipsoidal morphology [43, 44]. Regarding the deformation
17
induced ω phase, it generally displays plate-like morphology [40] (Figure 1.4e and f).
Figure 1.4 The typical TEM micrographs and corresponding diffraction patterns of three types ω phase. (a) very fine nano-size ω particles in the water-quenched Ti-Mo alloys; (b) Plate-shaped ω i the ate -quenched Ti–30Nb–3Pd alloy; (c) ellipsoidal ω particles in Ti-Mo alloys; (d) cuboidal ω particles in Ti-V alloys; (e) and (f) the plate-like deformation induced ω phase in the Ti-12Mo alloy upon strain [40].
1.3
Phase t a sfo atio i etasta le β Ti-alloys
1.3.1
β to ω transformation
18
displa i e, ollapse of the pla es of the β phase ia a shuffle mechanism. On the other hand, the formation of ωiso precipitates have been postulated via a
thermally-activated process involving diffusion-based compositional partitioning follo ed the ollapse of pla es i the egio s depleted i β desta ilizing elements. The efo e, f o the ie poi t of i sta ilities i the β phase, the ωath
results from a pure structural instability while the ωiso results from concurrent
compositional and structural instabilities.
Recently, It is generally accepted that the transformation mechanism is the (111) collapse model, which was developed by Fontaine et al. [45-49] to explain the depe de of te pe atu e a d o positio o the diffuse ω efle tio a d reversible athermal formation [29]. The model can be viewed as a collapse of (111) lattice planes of the bcc structure in a sequence shown in Figure 1.5. This orientation relationship can be clearly visualized to observe in the schematics diagram of β to ω phase transformation (Figure 1.5a-d) and be defined as ω // β; < -2 >ω //< >β. The three-layer stacking sequence (0, 1, 2 . . .) of {111} planes changes to the two layer stacking sequence of the ω st u tu e he the planes are collapsed in the middle (marked as 1.5) keeping the 0 and 3 planes undisplaced (Figure 1.5c and d). On completion of the collapse, the ω phase has a hexagonal symmetry and the transformation would transform the ABCABC stacking of (111) β latti e pla es to a AB'AB' packing in the fi al β st u tu e [34] (Figure 1.5e). Therefore aω can be defined as √ aβ and cω √ /2 is aβ. Fou a ia ts of ω a e fo ed alo g four o e ui ale t < > di e tio s i the β at i . Ho e e , the ollapse is ot al a s complete, which a esult i a u pled pla e afte ollapsi g and a trigonal system was developed along <111> β direction (Figure 1.5e). Such a periodic displacement of the {111} β-type planes can be proposed to be the result of a longitudinal displacement wave propagating along the <111> β di e tio . The longitudinal displacement wave can be described as a sinusoidal wave with
19
a ele gth, = d222, and a corresponding wave vector, Kω, equal to 2/3<111>*
(where <111>* is a vector in the reciprocal space) (Figure 1.5f). The advantage of this description lies in the fact that it can be applied to partial collapse situations also by varying the amplitude of the displacement wave, the amplitude being directly related to the order parameter.
Figure 1.5 (a) and (b) the three-dimension schematic diagram of lattice of β a d ω phase, espe ti el ; Pla a a a ge e t of the { }β ato i pla es i the latti e. The , , 2, . . . sequences of atomic plane arrangements can be seen. (d) The planar arrangement of the ω ato i pla es i the ω latti e. As a e see the ω-lattice can be obtained from the bcc lattice by collapsing a pair of planes (1 and 2) to the middle (marked as 1.5) while keeping the third one (0 and 3) undisturbed. (e) the schematic figures for the ideal otifs of β, pa tiall ollapsed ω a d full ollapsed ω st u tu es. The ABCABC sta ki g of pla es i the β a d AB'AB' sta ki g i the ollapsed ω st u tu es a e highlighted. Completely collapsed {222} planes form a six-fold symmetry, whereas an incomplete collapse forms a three-fold symmetry along the <111> axis. (f) The displacement of {222} planes can also be visualized in terms of a sinusoidal displacement wave where upward movement is seen as a positive displacement and downward as negative displacement.
(a) (b) (c) (d) (e) (f) collapse Di spl acem en t
20
1.3.2
ω to α transformation
The isothermal ω phase is ega di g as o e of the pote t u leatio sites fo α phase. A tuall , it has ee p o ed that the isothe al ω st u tu e is a etasta le i te ediate step i the t a sfo atio p o ess f o β to α phase. Blackburn et al. [50] poi ted that the g o th depe de of α depe ds o ω o pholog a d β/ω phase misfit, via investigating the phase transformation in Ti-Mo and Ti-V alloy. High misfit system such as Ti-V and Ti-Fe te d to ha e u oidal ω o pholog hile lo misfits systems like Ti-Mo ha e ellipsoidal ω [32, 44, 50]. In the different misfit s ste , t o thoughts ha e ee de eloped o e ea s a out the e ha is of α u leatio a d g o th f o ω phase. O e thought that α u leates i side the ω pa ti les a d o su es the latte du i g its g o th; the othe thought that α u leates ohe e tl at the ω/β i te fa e ith a o ie tatio elatio ship ith oth ω a d β phases. I the high isfit s ste , the α phase as sho to u leate at ledges of dislo atio hi h de elop at the ω/β i te fa e [44, 51]. On the contrary, the e has ee o side a le o t o e s ega di g the u leatio of α fo lo isfit systems. Azimdazeh et al. [52] p oposed that α u leated at so e dista e f o the ω/β i te fa e i Ti-6.8Mo-4.5Fe-1.5Al (LCB) alloy (a low misfit system). However, Prima et al. [53] justified that the α phase formed i the o e of a ω pa ti le i LCB alloy. Some authors also suggested that the actual nucleation and growth pattern of α depended o ω phase he the i estigated the phase t a sfo atio o Ti-Mo [54], and Ti-Nb [55] alloys.
Recently both thoughts were clarified by using high resolution transmission electron microscopy (HRTEM) imaging. For example, Prima et al. [53] showed the nucleation of a α pa ti le i the o e of ω phase was followed by dissolution of ω o oa se i g of the u leated α (Figure 1.6a and b). Meanwhile, they also proposed a model (Figure 1.7) that displacive t a sfo atio of ω o e to α postulate the
21
e ha is of u leatio of α from ω. In the model, the α/β/ω orientation relationship can be expressed as: (0001) ω // − − α // − β, (-1-120) ω // α // -11 β and [1-100] ω// − ] α // [211] β [53]. However, the direct evidence of laths α phase nucleation at an ω/β interface and grow with consuming the ω particles proposed by Ohmori et al. [56] is illustrated in Figure 1.6c.
Figure 1.6 High-resolution TEM images showing the nucleation of α from ω and ω/β interface. (a) nucleation of an α phase platelets in the core of an ω particle in LCB Ti-based alloys; (b) the planar coherent interface between α and ω; (c) nu leatio of a α phase lath at a ω/β i te fa e in Ti-10-2-3 alloy.
22
Figure 1.7 Nucleation and growth model of α-phase: a ω phase acting as heterogeneous u leatio , α g o th f o ω o su ptio , ω disappearance a d d α g o th f o β o su ptio [53].
1.3.3
β to α transformation
The phase transformation from β to α in metastable β Ti-alloys is a diffusion controlled nucleation and growth process, and often occurs with two ways of β->α, and β->ω, ω->α. The nucleation and growth of α phase obey Burgers orientation relationship (OR). Figure 1.8a shows the schematic diagram of Burgers orientation relationship et ee α a d β phase. These diffe e tl o ie tated α fo ed du i g the same nucleation event are known as variants. The feasible number of such variants is determined by the orientation relationship (OR). The six slip planes and the two slip directions of the β titanium unit cell give a maximum of 12 variants of orientation to the α. The Burgers orientation relationships et ee α a d β a e gi e below:
(0001) α // {011} β; < -20> α //<1-11> β; {1-100} α // {121} β
However, during the actual phase transformation, upo ooli g f o the β phase field of titanium the most densely packed planes of the β phase t a sfo to the asal pla es of the he ago al α phase. The distance between the basal planes in α is slightl la ge tha the o espo di g distance between the
23
{110} planes. Therefore, the α/β t a sfo atio causes a slight atomic distortion (Figure 1.8b). This leads to a slight contraction of the c-axis relative to the a-axis in the h p α a d edu es the c/a-ratio below the value of ideally close packed hexagonal atomic structures. A slight increase in volume is observed macroscopically du i g ooli g th ough the α/β t a sfo atio te pe atu e.
Figure 1.8 (a) the schematic diagram of Burgers orientation between α a d β phase; (b) β/α t a sfo atio a o di g to Burgers relationship [ 2].
1.4
Defo atio e ha is i etasta le β titanium alloys
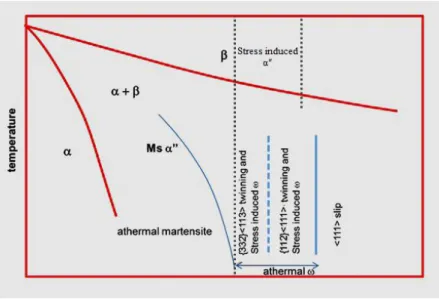
The deformation mechanism of etasta le β Ti-alloys generally included dislocation slip, mechanical twinning and stress-induced phase transformation. Banerjee et al. [15] schematically summarizes the variety of inelastic responses of the β phase to stress (Figure 1.9). It can be seen from Figure 1.9 that dislocation slip transforms to {112}<111>-type twinning and {332}<11 >-type twinning with the sta ilit of the β phase decreasing. At the same time, the stress-induced phase transformation also often occurs in these alloys.
24
Figure 1.9 A schematic diagram of the effect of β alloys content on β phase deformation mechanism.
1.4.1
Stress-induced martensitic transformation
The stress-induced martensitic α″ phase transformation is one of the most important features in metastable β alloys. The reversible SIM α″ has recently attracted great attention in developments of shape memory Ti alloys and multifunctional Ti alloys with high strength and low elastic modulus, resulting in the marked pseudo-elasticity and strain recovery. A schematic of the crystal structures of the β phase a d α″ o thorhombic martensite phase is shown in Figure 1.10. The latti e o espo de e et ee β a d α″ phases a e e p essed as follo s:
[100]α˝//[100]β, [010]α˝//[001]β, [001]α˝//[0 0]β (100)α˝//(110)β, [111]α˝//[111]β
In fact, extensively investigations [57-59] have been carried out on the SIM transformation during elastic process in the metastable β Ti-alloys. Generally, the metastable materials undergoing SIM transformation during elastic process exhibits a typical stress-plateau in the tensile stress–strain curve. Figure 1.11 shows the
25
schematic diagram of typical stress-strain curve for an alloy undergoing SIM during elastic process. The curve delineates four stages and exists double yield . Stage I is the initial linear elastic region. In this stage, the parent phase undergoes an elastic deformation [59]. Stage II or stress plateau region corresponds to stress-induced transformation of metastable parent phase to martensite or reorientation of martensite presented in initial microstructure [57, 58]. In case the reorientation of martensite is responsible for deformation strain, the stress plateau is flat, but, when stress-induced martensite contributes to deformation strain, this stage is reported to exhibit gradual increase in stress with increase in strain resulting in a rising stress plateau. The deformation mechanism in stage III is not well established. The Stage IV consisted of the formed martensite and β matrix. With applying strain, dislocation slip of β matrix dominates the deformation process, because it is favorable to slip when the stress is over the Critical Resolved Shear Stress (CRSS) of slip.
Figure 1.10 A schematic illustration exhibiting lattice correspondence between β a d a˝ phases.
26 r e IV True st ress, pa ) True strain, p
Figure 1.11 Typical stress-strain curve for an alloy undergoing SIM (number donate various stages during tensile test).
Moreover, the stress induced martensitic transformation can also occur in the plastic process in some metastable β Ti-materials [40, 60]. The phenomena is called transformation-induced plasticity (TRIP). The TRIP effect is very common in metastable austenitic steels, bringing about a remarkable increase in elongation and work-hardening. The TRIP-steels display high strength, excellent work-hardening and large ductility, due to the combination of the formed martensite and the hardening of the austenite contribute to the overall plastic process [61]. Similar with the TRIP-steels, the stress induced martensitic transformation occurred in plastic process is available to improve the mechanical behavior in the metastable β Ti-alloys.
1.4.2
Mechanical twinning
Twinning is an important deformation mechanism not only in materials with low crystal symmetry such as hexagonal (including hcp) metals but also in body-centered cubic (BCC) metals and face-centered-cubic (fcc) metals with low stacking fault energies [62]. In BCC structure, the {112}<11 >-type is a well-known twinning system,
27
but the {332}<11 >-type twinning is a unusual twining mode observed in some metastable alloys, like Fe–Ni–C or Fe–Be [63]. I β Ti-alloys, both twinning systems {112}<11 > and {332}<11 > have been observed, depending on the alloy composition [39, 64]. Hanada et al. [38, 39, 65] pointed that the {112}<11 > t i i g e e usuall o se ed i etasta le a d/o sta le β Ti-alloys. However, the {332}<11 > twinning always o u s i u sta le a d/o etasta le β Ti-alloys, leading to a low yield stress and large elongation. Figure 1.12 shows the schematic diagram of diffraction pattern of twinning systems {112}<11 > and {332}<11 > ith β zone.
Figure 1.12 The schematic diagram of diffraction spot of {332}<11�> twinning and
{112}<11�> twinning with β [110] zone, respectively.
The deformation mode of {332}<11 > twining is an interesting feature in metastable β Ti-alloys, which strongly influences the mechanical properties of these alloys. It has been reported that the deformation of {332}<11 > twinning in metastable β Ti-alloys caused a large elongation through the significant work

![Figure 1.7 Nucleation and growth model of α - phase: a ω phase acting as heterogeneous u leatio , α g o th f o ω o su ptio , ω disappearance a d d α g o th f o β o su ptio [53]](https://thumb-eu.123doks.com/thumbv2/123doknet/14600194.731015/38.892.134.755.107.368/figure-nucleation-growth-model-acting-heterogeneous-leatio-disappearance.webp)

![Figure 1.12 The schematic diagram of diffraction spot of {332}<11 � > twinning and {112}<11 � > twinning with β [110] zone, respectively](https://thumb-eu.123doks.com/thumbv2/123doknet/14600194.731015/43.892.136.757.520.841/figure-schematic-diagram-diffraction-spot-twinning-twinning-respectively.webp)