HAL Id: hal-00138124
https://hal.archives-ouvertes.fr/hal-00138124
Submitted on 8 Apr 2009HAL is a multi-disciplinary open access archive for the deposit and dissemination of sci-entific research documents, whether they are pub-lished or not. The documents may come from teaching and research institutions in France or abroad, or from public or private research centers.
L’archive ouverte pluridisciplinaire HAL, est destinée au dépôt et à la diffusion de documents scientifiques de niveau recherche, publiés ou non, émanant des établissements d’enseignement et de recherche français ou étrangers, des laboratoires publics ou privés.
The Evolution of Gender Earnings Gaps and
Discrimination in Urban China, 1988-95
Sylvie Démurger, Martin Fournier, Yi Chen
To cite this version:
Sylvie Démurger, Martin Fournier, Yi Chen. The Evolution of Gender Earnings Gaps and Discrimina-tion in Urban China, 1988-95. The Developing Economies, 2007, XLV (1), pp.97-121. �hal-00138124�
Forthcoming in The Developing Economies (March 2007)
The Evolution of Gender Earnings Gaps and Discrimination in Urban China: 1988-1995*
Sylvie Démurger
HIEBS, the University of Hong Kong and GATE-CNRS (France) [email protected]
Martin Fournier
GATE, Université Lyon 2 (France) [email protected]
Yi Chen
CERDI, Université d’Auvergne (France) [email protected]
This version: May 17, 2006
Corresponding author: Sylvie Démurger
HK Institute of Economics & Business Strategy (HIEBS) K.K. Leung Building
University of Hong Kong Pokfulam Road, Hong Kong E-mail: [email protected]
Telephone: (852) 2241-5067 Fax: (852) 2548-1152
* The authors are grateful to Li Shi for providing access to the household income survey data used in the paper as well as to two anonymous referees for valuable comments and suggestions. We remain solely responsible for errors and omissions.
The Evolution of Gender Earnings Gaps and Discrimination in Urban China: 1988-1995*
Abstract: This paper analyzes the impact of market liberalization on gender earnings differentials and discrimination against women in urban China at the beginning of the 90s. The observed stability in the overall gender earnings gap between 1988 and 1995 is shown to result from a complex set of evolutions across enterprises, earnings distributions and time. Our results highlight the interplay of opposing forces, economic reforms contributing to changes in managers’ behaviors in different dimensions. On the one hand, by bringing more competition, liberalization favored a reduction in discriminating behaviors in both urban collectives and foreign-invested enterprises; on the other hand, by relaxing institutional rules, it led to a loosening of the government’s egalitarian wage setting policies, leaving more space for discrimination in state-owned enterprises.
Key words: gender earnings differentials, discrimination, enterprise ownership, urban China. JEL classification: J16, J31, J71, O53, P23.
1. Introduction
The Chinese urban labor market has experienced tremendous structural changes since 1978, which have been widely documented over the last ten years. The expected impact of these changes on the male/female earnings gap however remains ambiguous. Indeed from a theoretical point of view, as stressed by Liu et al. (2000), opposing forces may be at stake. On the one side, the Maoist egalitarian ideology aimed at reducing any type of discrimination; relaxing the power of the State on wage setting mechanisms may thus have brought back to the surface some patriarchal Confucian forces, leading to an increase in the male/female wage gap. On the other hand, increased competition induced by the reforms may have encouraged profit-based behaviors. As a source of inefficiency, discrimination mechanisms may thus have decreased.
From an empirical point of view, evidence on the impact of labor market reforms on the male/female wage gap in urban China is also unclear. Relatively few studies have addressed the issue and findings are very much contrasted1. Liu et al. (2000) find larger gender wage differentials in the private sector
1 We restrict here to analyses on urban gender wage gaps only, although a large literature also deals with gender wage differentials in rural China. See Dong et al. (2004), Ho et al. (2002), Meng (1998), Meng and Miller (1995), Rozelle et al. (2002).
than in both the state and the collective sectors in two coastal cities (Jinan and Shanghai) in 1995. However, they show that the relative share of discrimination in the overall gender wage gap substantially reduces across ownership from the state to the private sector. Their interpretation is that market competition has actually lessened the importance of discrimination in total wage differential. Using 1991 data collected in 26 cities and 12 provinces, Maurer-Fazio and Hughes (2002) also find that the size of the male/female wage gap tends to increase with the degree of market liberalization. However, when taking into account differences in the wage structure, they show that much of the larger gender wage gaps in the most liberalized sectors (joint-venture and collective) can be explained by a greater degree of wage dispersion. They conclude that their analysis provides “no empirical support to the hypothesis of reform-induced increases in labor market discrimination against women” (p. 728)2. Using data on Beijing and Guangdong in 1993, Qian (1996) finds different
patterns, the gender wage gap being the largest in the collective sector (14%) and the smallest in the foreign sector (1%). Although not decomposing by ownership, Qian finds that labor-market discrimination is responsible for more than half of the observed overall gender wage gap in both Beijing and Guangdong. On the same dataset as the one used in this paper, Gustafsson and Li (2000) show that, although the male/female wage gap still remains at a low level in urban China as compared to international standards, it has been slightly increasing over the 1988-1995 period. Like Maurer-Fazio and Hughes (2002), they show that this modest increase in earnings differential is driven by increased income inequality in urban China rather than by a deterioration of the relative position of women in the earnings distribution. Using the same dataset, Bishop et al. (2005) employ quantile regressions to examine returns to human capital characteristics at various quantiles in the earnings distribution. They find that while the earnings gap has increased, the unexplained fraction of the gap has declined over time, especially at the bottom of the income distribution. Lastly, using annual data from 1988 to 1999, Liu et al. (2004) find a slight increase in gender wage gaps over time, explained by the conjunction of increasing rewards to observed and unobserved skills (inducing an increased discrimination) and converging skill levels between men and women. Using the same national cross-section
2 Using the same database, Hughes and Maurer-Fazio (2002) explore gender wage gaps for both married and unmarried workers. They highlight less discrimination against single women in the most liberalized sector (joint-ventures), but the reverse for married women, for whom the unexplained wage differential is the highest.
data from 1988 to 1997, Ng (2005) finds that discrimination against women in urban China is higher in the most liberalized part of China (the coastal region) and that this pattern becomes more pronounced over time.
Previous studies have followed two types of approach to address the gender wage gap issue in urban China. The first approach consists in comparing different ownership enterprises characterized by different levels of exposure to market forces (Qian, 1996; Liu et al., 2000; Maurer-Fazio and Hughes, 2002; Hughes and Maurer-Fazio, 2002). The second approach consists in the comparison of discrimination levels observed at two or more points in time (Gustafsson and Li, 2000; Liu et al., 2004; Bishop et al., 2005; Ng, 2005). These approaches being complementary, our paper tries to address jointly the question of the differences in the male/female earnings gap across ownership sectors and over time. On the same data set, Gustafsson and Li (2000) have provided the baseline for the analysis of the effects of economic reforms on the relative economic status of women. Our paper adds to their analysis by including a subdivision of the sample by ownership, which allows for further analyses of the impact of labor market liberalization on the gender earnings gap. Moreover, our decompositions run from microsimulation at the individual level allow us to analyze the discrimination issue along the income distribution and to highlight non-uniform patterns in the evolution of discrimination.
China’s transition towards a market economy has gradually promoted the development of the non-state sector composed of collective enterprises, private or individual enterprises and foreign-invested enterprises. These different ownerships correspond to different degrees of openness to market forces, leading to a strongly segmented labor market structure (Dong and Bowles, 2002; Zhao, 2002; Chen et al., 2005). Comparing discrimination levels between enterprises of different ownership and their evolution thus provides valuable information on the specific impact of reforms increasing market competition.
The paper is organized as follows. Section 2 presents the methodology. Section 3 presents the data and provides descriptive statistics on gender wage differentials by ownership and over time. Section 4 discusses earnings functions estimations and section 5 presents decomposition results for the male/female earnings gap across ownership sectors and over time. Section 6 offers concluding remarks.
2. Methodology
In order to analyze male/female earnings gaps for different ownership enterprises, Oaxaca-Blinder decompositions (Blinder; 1973; Oaxaca, 1973) are run on three dimensions: gender, enterprise ownership and time. These decompositions provide evaluations of the magnitude and the evolution of discrimination phenomena.
2. 1. Modeling total earnings
Let represent earnings for individual i belonging to gender s observed at date t. depends on two sets of arguments: individual characteristics ( ), and a set of parameters corresponding to the earnings model linking individual characteristics with observed earnings ( ). The wage generating process can thus be expressed as a function W of these two sets of arguments:
t s i w iwst t s i x t s
β
) ; ( st t s i t s i x W w =β
(1) 2. 2. Dynamic decompositionUsing this general specification, decompositions can be applied in different dimensions. For the sake of simplicity, the gender earnings gap is represented here as the difference between average male earnings and average female earnings3. First, the observed evolution of the gender earnings gap between two dates (t and
T) can be decomposed as follows4:
3 In the application that follows, male/female earnings gaps are measured as the difference between average male earnings and average female earnings as a percentage of average female earnings.
4 The following procedure is very much in the line of extensions of Oaxaca-Blinder decompositions to the time dimension initiated by Blau and Beller (1988), Smith and Welch (1989) and Wellington (1993). We chose this approach over the one initiated by Juhn et al. (1991) because our empirical findings show significant differences between men’s and women’s models concerning returns to observed characteristics, which violates the core (implicit) assumption underlying the procedure proposed by Juhn et al. (1991) (Datta Gupta et al., 2000).
[
] [
E
D
w
w
w
w
G
G
G
T t T t t f t m T f T m t T T t∆
+
∆
=
−
−
−
=
−
=
∆
]
(2) with5[
] [
]
4
4
4
4
4
3
4
4
4
4
4
2
1
4
4
4
4
4
3
4
4
4
4
4
2
1
t in observed ons remunerati with T in observed population forSimulatedwagegapt f T f i t m T m i T in gap wage Observed T f T f i T m T m i T t
D
=
W
(
x
;
β
)
−
W
(
x
;
β
)
−
W
(
x
;
β
)
−
W
(
x
;
β
)
∆
(3) and[
] [
]
4
4
4
4
4
3
4
4
4
4
4
2
1
4
4
4
4
4
3
4
4
4
4
4
2
1
t in gap wage Observed t f t f i t m t m i t in observed ons remunerati with T in observed population for Simulatedwagegapt f T f i t m T m i T t
E
=
W
(
x
;
β
)
−
W
(
x
;
β
)
−
W
(
x
;
β
)
−
W
(
x
;
β
)
∆
(4)The procedure proposed in equations (3) and (4) allows for a decomposition of the observed change in the earnings gap into:
i) A pure effect of changes in discrimination, keeping population structures fixed (that of date T in equation 3).
ii) A pure effect of changes in characteristics, keeping remuneration structures fixed (that of date t in equation 4).
2. 3. Static decompositions by gender
The same type of decomposition procedure can be applied to the gender earnings gap for any given year t as follows: t t t f t f i t m t m i t
E
D
x
W
x
W
G
+
=
−
=
(
;
β
)
(
;
β
)
(5) where)
;
(
)
;
(
i tm mt i tm tf tx
W
x
W
D
=
β
−
β
(6)5 ( ; .) . . . β x
and
)
;
(
)
;
(
i mt tf i tf tf tx
W
x
W
E
=
β
−
β
(7)In the same line as for dynamic decomposition, this decomposition corresponds to the evaluation of what would be the observed male/female earnings gap for year t under the following conditions:
i) If men and women were sharing the same socio-demographic characteristics (that of men in equation 6)Ö D: Pure discrimination effect.
ii) If men and women were facing the same remuneration structure (that of women in equation 7) Ö E: Pure difference-in-characteristics effect.
2.4. Implementation issues
The practical implementation of the method consists in two phases. Earnings equations are estimated by year, sex and ownership. Estimated coefficients are then used to run micro-simulations and evaluate average values for each of the effects presented in sections 2.2 and 2.3.
A general issue concerning decompositions of the Oaxaca-Blinder type concerns path-dependency (Fournier, 2005). Indeed, evaluated effects a priori depend on the benchmark population structure or coefficient vector chosen to run micro-simulations. In the following, each possible evaluation is considered and min-max intervals are reported, which can be considered as a robustness test6.
In order to analyze differences in discrimination across different ownership structures, earning functions by ownership are estimated and used to run the preceding decompositions by ownership as well as for the total. Doing so brings in an additional dimension when comparing results obtained for the total to results derived for different ownerships: differences in the distribution of males and females across different ownership enterprises. Analyzing thoroughly this issue would require formal modeling and simulation of enterprise type choices by sex7. This however goes far beyond the scope of this paper, which focuses on
6 For static decompositions, each effect can be evaluated in four different ways depending on the choice of reference populations and coefficient vectors. For dynamic decompositions, two different evaluations can be derived depending on the choice of reference years for population and coefficient vectors.
earnings discrimination within enterprise types. We chose here to stick to simple re-weighting procedures to provide a preliminary assessment of the magnitude of these phenomena.
3. Gender earnings gap in urban China and its evolution from 1988 to 1995
3. 1. Data sources
Data used in this paper come from two comparable urban household income surveys from the China Household Income Project (CHIP)8 for years 1988 and 1995. The data cover 9,009 households and 31,827
individuals across 10 provinces in 1988 and 6,931 households and 21,694 individuals across 11 provinces in 19959. Contrary to Gustafsson and Li (2000) who include owners and employees of private and individual
enterprises, we chose to restrict our analysis to wage-workers aged between 16 and 60, who declared working at least part of the year. Due to the lack of reliable information on wages for private or individual enterprises, we further restricted our sample to four categories of enterprise ownership: State Owned Enterprises at central or provincial level (CSOEs), local public-owned enterprises (LSOEs), urban collective enterprises (UCEs) and foreign invested enterprises10 (FIEs). Enterprise ownership can be used as proxies for the
advancement in market liberalization, State-owned enterprises being the less liberalized and foreign-invested enterprises the most liberalized whatever the year. Following Maurer-Fazio and Hughes (2002), we can also “speculate that the collective firms are intermediate cases since their budget constraints are clearly firmer than those in the state sector” (p. 719).
The total annual earnings variable is defined as the sum of the basic wage, bonuses, allowances (except those received for “waiting for a job”, xiagang), subsidies (including housing, healthcare, childcare and regional subsidies), other wages, other income from work unit, as well as income in kind11. Moreover, to
account for regional price variations, earnings are adjusted for provincial purchasing power differences, by
8 Details are provided in Riskin et al. (2001). See also Gustafsson and Li (2000).
9 Sichuan province has been added in the 1995 survey. All other provinces are the same in both years: Beijing, Shanxi, Liaoning, Jiangsu, Anhui, Henan, Guangdong, Yunnan, Gansu and Hubei. For data comparability, we restrict our analysis to the 10 provinces surveyed in the two years (see Gustafsson and Li, 2000).
10 Foreign-invested enterprises include both Sino-foreign joint-ventures and foreign-owned enterprises. 11 As some people declare working only part of the year, wages are adjusted to “full-year working equivalent”.
using Brandt and Holz (2005) urban provincial-level spatial price deflators (the reference being nationwide prices in 1995).
3. 2. Gender differences in earnings
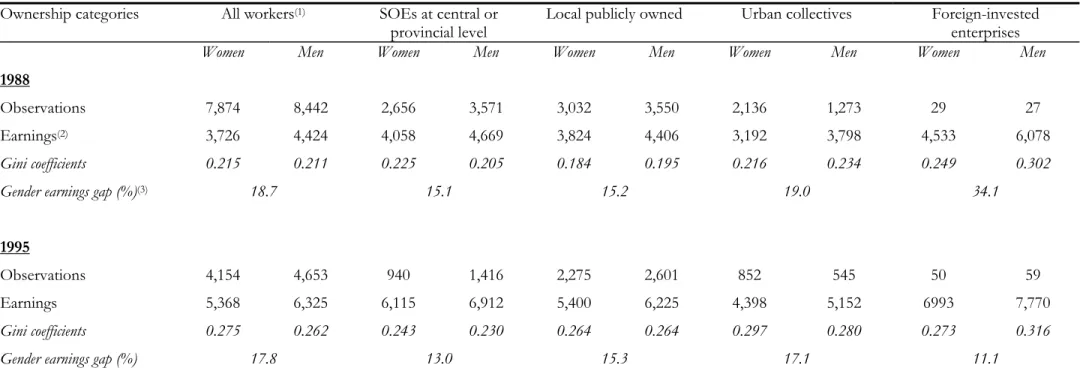
Table 1 presents preliminary statistics on average salaries by ownership and by sex, which provides an evaluation of the evolution of the gender earnings gap between 1988 and 1995. As shown in this table, men are paid on average nearly 20% more than women, the gap slightly narrowing over time from 18.7% in 1988 to 17.8% in 199512. In terms of ownership distribution, the gender earnings gap has considerably reduced for foreign-invested enterprises (from 34.1% in 1988 to 11.1% in 1995), and in a lesser extent for central SOEs and for urban collectives, and it has remained stable for local SOEs (from 15.2% to 15.3%). These non-uniform changes across ownership lead to quite different patterns in terms of earnings differentials by sex between 1988 and 1995: in 1988, the gap was by far the largest in foreign-invested enterprises while it is the smallest in 1995. In 1995, the highest differential is observed in urban collectives, followed by local SOEs and central SOEs. Hence, the overall modest change in the male/female earnings gap between 1988 and 1995 results from the combination of sizeable contrasting evolutions within different ownership structures. Although consistent with both Qian (1996) and Gustafsson and Li (2000), these results differ strongly from both Liu et al. (2000) and Maurer-Fazio and Hughes (2002), who highlight larger gender wage gaps in the most liberalized sectors. One explanation can be found in the different samples used in these studies. Indeed, Liu et al. (2000) only consider two cities. Moreover, our finding of a large decrease in the gender earnings gap for FIEs between 1988 and 1995 stresses the fact that various years can exhibit quite different pictures. Hence, Maurer-Fazio and Hughes (2002) findings for 1991 can be seen as consistent with our results, with a
12 This result differs from Gustafsson and Li (2000) who found a modest increase in gender wage gap (from 18.5% to 21.2%). Two main reasons can explain this difference: first, our sample is restricted to wage workers only and excludes private and individual enterprises, and second, we have adjusted earnings for unemployed days.
male/female wage differential for FIEs of 25.4%13, which lies within the values obtained here for 1988 and 1995.
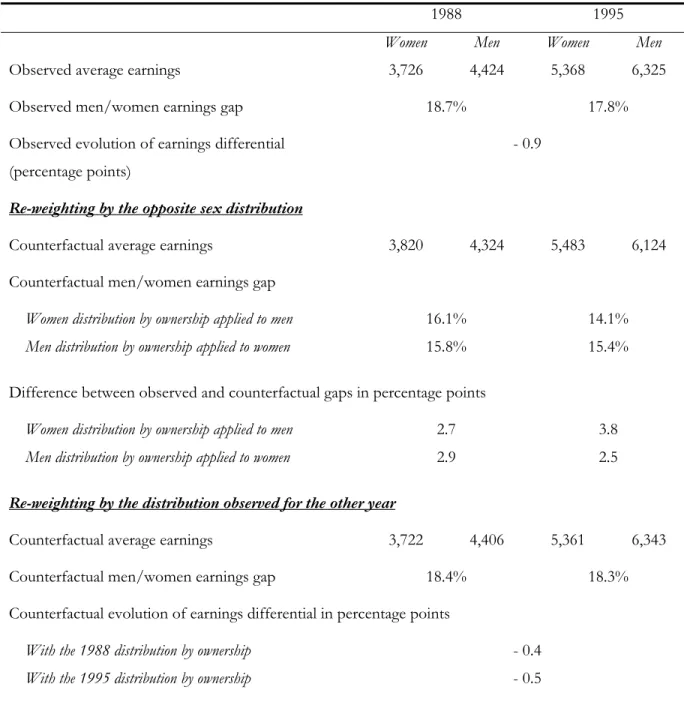
Furthermore, Table 1 shows that the overall differential across the range of enterprises in 1995 is noticeably higher than differentials by ownership taken separately (except for urban collectives), which suggests that an important aspect of discrimination against women arises from their being over-represented in enterprises paying lower wages (urban collectives), whereas men are proportionately more numerous in higher-paying enterprises14. This observation is consistent with Maurer-Fazio et al. (1999) findings at the aggregate level, indicating that a “large portion of the gender wage differences in China’s urban labor market arises because of the over-representation of women in low-wage industries” (p. 81). This issue can be further analyzed through re-weighting procedures as shown in Table 2. The use of a common distribution by ownership (either that observed for men or that observed for women) enables to monitor the impact of differences in distributions by ownership between the two sexes. Our findings show that the proportion of the observed earnings gap that can be directly attributed to differences in the distribution of men and women across enterprises amounts to 3 to 4 percentage points. This indirect discrimination arises from the fact that women are over-represented in low-wage urban collectives whereas men are over-represented in higher-paying central SOEs.
The bottom part of Table 2 provides additional and complementary information on the impact of differences in the male and female distributions across enterprises on the gender earnings gap. Re-weighting by the distribution observed for the other year shows that half of the 0.9 percentage point observed decrease in the gender earnings gap between 1988 and 1995 can be attributed to changes in the relative employment between enterprises, which have been in favor of local SOEs for both men and women from 1988 to 1995. Indeed, in 1995 local SOEs employ 55.2% of female workers and 56.2% of male workers, while the shares in 1988 were respectively 38.6% and 42.2%. This concentration in local SOEs tends to homogenize the
13 The figure is computed from Maurer-Fazio and Hughes (2002, Table 2, p. 720), as the difference between average male wage and average female wage as a percentage of average female wage.
14 The over-representation of women in low paying collective enterprises is a well-documented phenomenon of the Chinese labor market. As emphasized by Qian (1996), it is “partially a result of the Chinese government effort to mobilize women to participate in the labor market”. However, since the collective sector offers “lower wages, less benefits and limited career development, people consider it a less desirable sector” (p. 79).
distribution of men and women across enterprises, which in turn reduces the importance of ownership segregation in the gender earnings differential.
Another important aspect concerns the earnings distribution by sex within ownership. Gini coefficients provided in Table 1 show some interesting features. First, in 1988, earnings inequality for both men and women was notably higher in FIEs, where salaries were also by far the highest. Thus, earnings dispersion was the highest in the most liberalized sector in 1988, which is consistent with Maurer-Fazio and Hughes (2002) findings for 1991. On the opposite, earnings inequality was the lowest in local SOEs, where Gini coefficients were only 18.4% for women and 19.5% for men. Second, the comparison between 1988 and 1995 shows a large increase in overall earnings inequality for both men (from 21.1% to 26.2%) and women (from 21.5% to 27.5%). Moreover, this increase has been especially sharp in both local SOEs and urban collectives. In terms of changes in earnings inequality over time, FIEs exhibit levels of inequality quite similar to urban collectives and local SOEs in 1995 since Gini coefficients only slightly increased in FIEs. Hence, further liberalization of the economy between 1988 and 1995 led to higher earnings inequality within domestic enterprises and a catching-up process as compared to foreign enterprises.
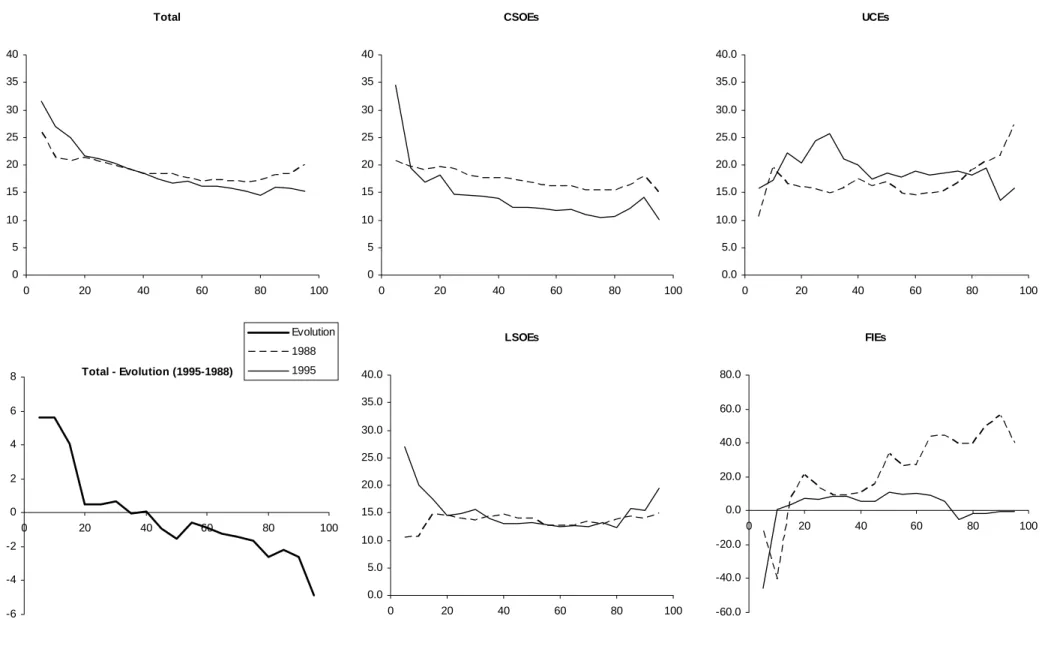
To further analyze the distribution issue, Figure 1 presents male/female observed earnings differentials by earnings percentile of each gender income distribution for each ownership type. Each curve should be read in terms of difference: for the median, the curve represents the difference between male median and female median earnings as a percentage of the female median earnings. The overall distribution shows sizeable changes between 1998 and 1995. Indeed, the rather flat curve in 1988 turns into a down-sloping curve in 1995, stressing a higher gender differential at the bottom of the earnings scale. Hence, the overall gender earnings gap has increased for low wage earners, while it has decreased for high wage earners. Moreover, this relative deterioration of the earnings gap at the lower part of the distribution can be found within each enterprise type, except for local SOEs where the evolution is less clear-cut.
4. Estimation results
Earnings regressions by enterprise ownership and by sex are reported in Table 3 for 1988 and in Table 4 for 199515. Since the choice of enterprise and the related expected remuneration are closely linked,
estimating earnings functions for enterprises of different ownership would require controlling for potential selection biases. However, we chose here to treat enterprise’s choice as exogenous for two main reasons16.
First, since labor was still administratively allocated in China up to 1995, the enterprise’s choice cannot be fully considered as the result of an individual choice17. Second, achieving identification for enterprise’s choice
is problematic since no available variable can be considered as a fully exogenous instrument18. Nonetheless, it
should be stressed here that there may still be selectivity problems, which calls for a cautious interpretation of our estimations results.
The dependent variable is the natural log of total annual earnings and explanatory variables include individual human capital characteristics (education and experience), economic sector, geographical residence and household characteristics19. Given the small number of observations for FIEs, we are limited in the
number of explanatory variables that can be introduced without reducing the robustness of our estimations20.
Moreover, the issue of which variable to include in the wage regression when measuring wage discrimination is highly controversial. On one hand, the choice of explanatory variables for the earnings equation may raise a concern for the concept of wage discrimination, which commonly refers to the part of unexplained earnings gap between men and women. Because income variations across regions or industries are potential important sources of gender earnings differentials, more disaggregated levels for geographic and industrial attributes may be required. Similarly, the potential different distribution of men and women across positions and occupations in the same enterprise may also account for the identified “gender discrimination”. However,
15 Chow tests performed to test the null hypothesis that the beta coefficients in earnings equations between two different ownerships are the same all indicate that the null hypothesis can be rejected at the one percent level.
16 Zhao (2002) and Chen et al. (2005) make similar choices.
17 In particular, until 1995, graduate students from universities in China were assigned to a particular job according to central planning related labour allocation mechanisms.
18 Chen et al. (2005) mention the relative employment shares in different enterprise types at the city level as potential instruments. Information on cities is unfortunately not fully reliable for 1988.
19 Reference categories for regional location and economic sector are respectively non-coastal region and secondary sector (industry and construction).
20 More detailed specifications for men and women earnings functions can be found in Gustafsson and Li (2000), who however do not provide any distinction by ownership type.
some of these explanatory variables, including industry and occupation, are clearly endogenous, with no variable in our data to credibly instrument those endogenous variables. Hence, given data limitation, we chose to limit the potential for endogeneity bias by estimating a reduced form of the earnings equation, which does not include all the theoretically required explanatory variables. We thus acknowledge that one should keep the potential omitted variable bias in mind when interpreting the results. However, alternate specifications, including extended specifications as well as a minimal specification including only human capital variables (education and experience) have been estimated and all led to similar decomposition results21.
Another concern about the accuracy of our estimates can arise from the very small number of observations for the foreign sector. Since it was still in its emerging phase in 1995, the foreign sector was indeed accounting for a very small share of employment (although higher than ours) in China. Being aware of this strong weakness of the data, we nevertheless chose to keep this category in our analysis as a reference category for the most liberalized sector in 1995 only. Although we present results for both 1988 and 1995, we do not interpret them for 1988 and remain cautious for 1995.
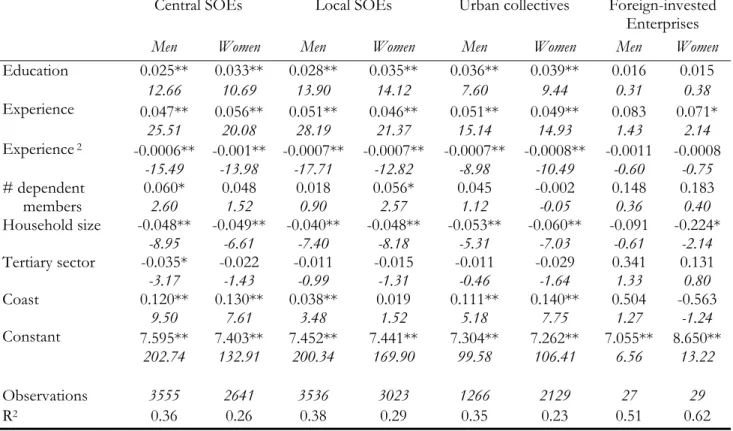
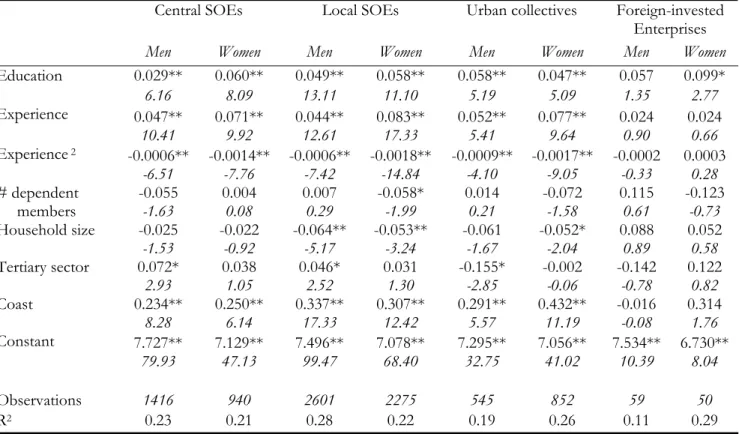
Earnings equation regressions reported in Table 3 and Table 422 show returns to education ranging
from 2.5% to 3.9% in 1988 depending on enterprise ownership, and ranging from 2.9% to 9.9% in 1995. The only cases where education is not significant are foreign-invested enterprises for men in 1995 and for both men and women in 1988, where the much smaller number of observations certainly affects the robustness of our results. For domestic enterprises, our results are consistent with the literature on returns to education in urban China, including Li (2003), Yueh (2004) and Zhao (2002). In terms of gender differences, our estimations show significant differences for both central and local SOEs in 1988 and in 1995, returns to education being higher for women.
The usual concave form for work experience23 is found for nearly all estimations, the main
exceptions being for foreign-invested enterprises. The estimation of separate earnings functions by ownership
21 All results presented in the following of the paper are based on an intermediate specification. Robustness tests using alternative (reduced or extended) specifications are available from the authors.
22 Comparisons of estimated coefficients across equations given in the following comments are made only for differences that are statistically significant at the ten percent level.
shows that the remuneration of experience is not uniform across ownership and gender. Women tend to have steeper but more concave returns to experience than men, thus reaching their wage peak earlier. For women, experience is significantly better rewarded in central SOEs than in local SOEs in 1988, and women’s wage premium for job experience in central SOEs is even significantly higher than for men. For men, experience is more uniformly remunerated across ownership. Lastly, the absence of significant returns to experience in foreign-invested enterprises certainly comes from the fact that workers in foreign-invested enterprises are much younger and have less experience. It also highlights a specificity of this newly developed form of ownership, in which experience accumulated on former SOEs positions may not be associated with efficiency gains.
Earnings differentials by geographical location in domestic enterprises show that workers in coastal provinces earn on average 2 to 14% more than workers in inland provinces in 1988, and that the gap significantly increased in 1995 to 23-43%. The wage premium for being along the coast in 1988 was significantly lower in local SOEs than in both central SOEs and urban collectives for men and women. But the strong increase in the premium for local SOEs in 1995 led to a reversal of the relative position of local SOEs compared to central SOEs that became the lowest coastal wage premium paying.
5. Decomposition results
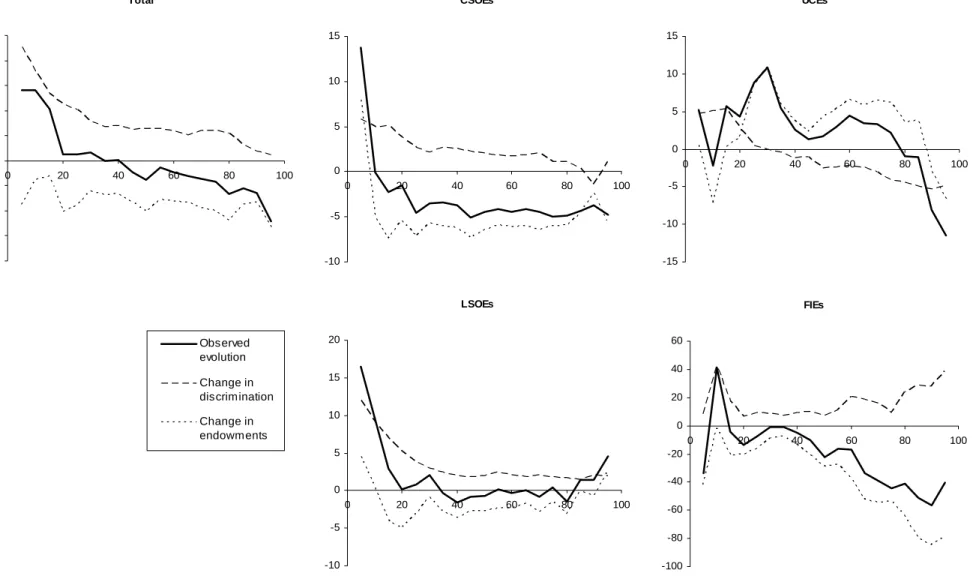
5. 1. Dynamic evolution of gender wage gaps, 1988-95
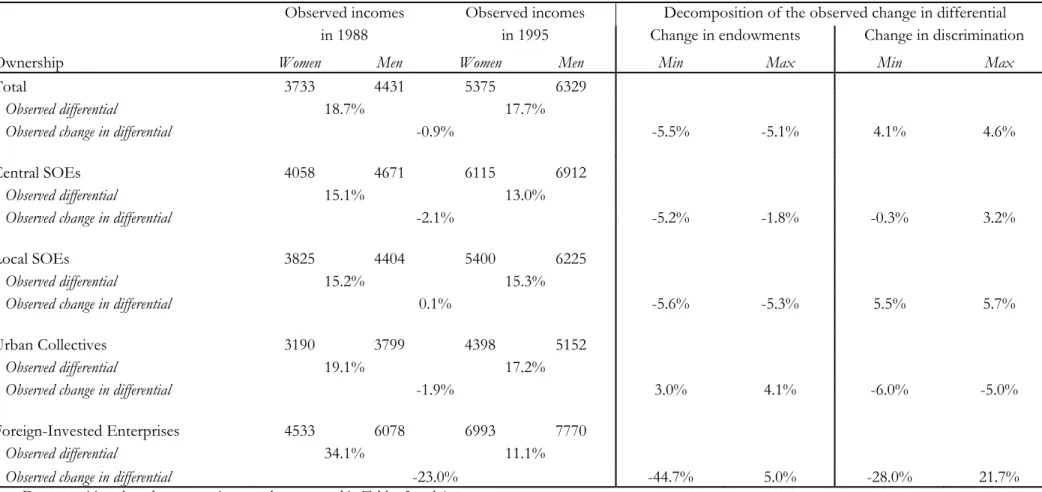
Table 5 provides evaluations of the impact of changes in both discrimination and endowments on observed gender earnings differentials between 1988 and 1995 by ownership. First, as discussed in details in section 3, it shows that the income gap between men and women has decreased as a whole, and for all ownerships, except for local SOEs, over the 1988-95 period. However, the decomposition of the modest observed decrease in the earnings gap reveals two opposite forces. First, the overall change in endowments has led to a relative improvement of women characteristics as compared to men. If alone, this change would have led to a much larger decrease in the overall gender wage gap (5.1 to 5.5 percentage points instead of the
observed 0.9 percentage point). However, this equalizing force has been offset by a concomitant increase of discrimination, which would have led to a 4.1 to 4.6 percentage points’ increase in the overall gender earnings gap, had endowments remained unchanged.
Figure 2 presents decomposition results on the earnings percentiles scale. It shows that changes in endowments have had a rather uniform impact along the earning scale, while rising discrimination has been much stronger at the bottom of the distribution. This implies that the relative widening of the gender earnings gap for low-wage earners as compared to high-wage earners mainly comes from a stronger increase in discrimination for low-wage workers. This result is consistent with Li and Gustafsson (2000) findings that the earnings situation of young women and women with limited education (thus, at the lower end of the female earnings distribution) has especially deteriorated compared to men with similar characteristics. It is also consistent with Bishop et al. (2005) findings using quantile regressions based decomposition procedures24.
Turning to differences by ownership, Table 5 reveals quite different patterns across enterprises, especially in terms of discrimination. Indeed, it shows an increase in discrimination for both central and local SOEs (especially high in local SOEs), and a decrease for urban collectives25
. For central SOEs, the convergence in income between men and women thus entirely comes from a catching up in terms of endowments, which may have been partly compensated by an increase in discrimination.
In the case of local SOEs, the catching up in terms of endowments is fully compensated by a strong rise in discrimination (between 5.5 and 5.7 percentage points), which affected more strongly both the bottom and the top of the distribution (Figure 2). An opposite feature characterizes urban collectives since they experienced a decrease in discrimination associated with diverging endowments. As shown in Figure 2, the overall decrease in discrimination only affected the upper part of the distribution while among the poorest, discrimination seems to have increased.
24 Although Bishop et al. focus their comments on the decreasing share of the “unexplained” component in the total gap, their results however show a clear increase in the level of this component over time for lower income levels (tables 3a and 3b, column 5, page 256).
25 For FIEs, the impact is less straightforward as suggested by the negative and positive signs of the min and max interval. Since decompositions of earnings differentials for FIEs are made on a very small sample for 1988, we do not interpret further these results and restrict the analysis of gender discrimination in FIEs to 1995.
These results reveal an interesting evolution in domestic enterprises’ behaviors throughout the reform period. Indeed, enterprises that experienced the greatest increase in discrimination against women are SOEs and not urban collectives where discrimination on the contrary substantially decreased. As for the comparison of discriminatory behaviors between state-owned enterprises and others, Meng and Miller (1995) argue that where employment and wages are decided by the government, the government makes efforts to improve the position of women in order to counterbalance traditional segregation against women inherited from Confucian thoughts. Our results suggest that throughout the reform process, the government, and especially local governments, have tended to pay less attention to this issue and have progressively decreased their pressure on gender equality. Conversely, our results for urban collectives suggest that within these enterprises, market reforms and increased competition from other types of enterprises may have brought more “market-oriented” behaviors, leading to a decrease in costly and inefficient discrimination against women26
.
5. 2. Comparison between 1988 and 1995
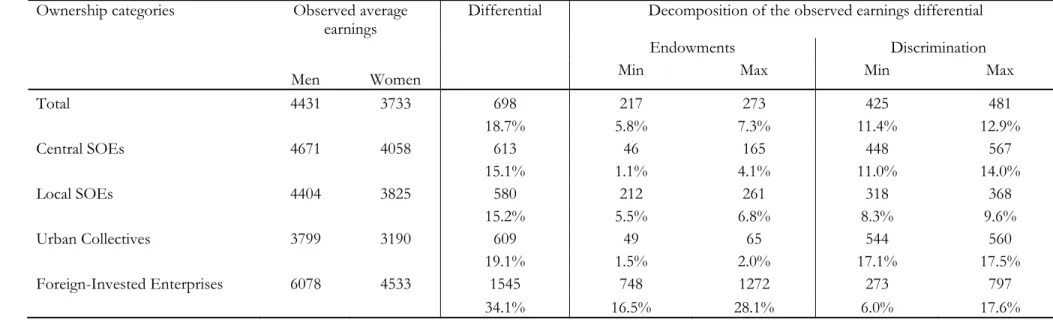
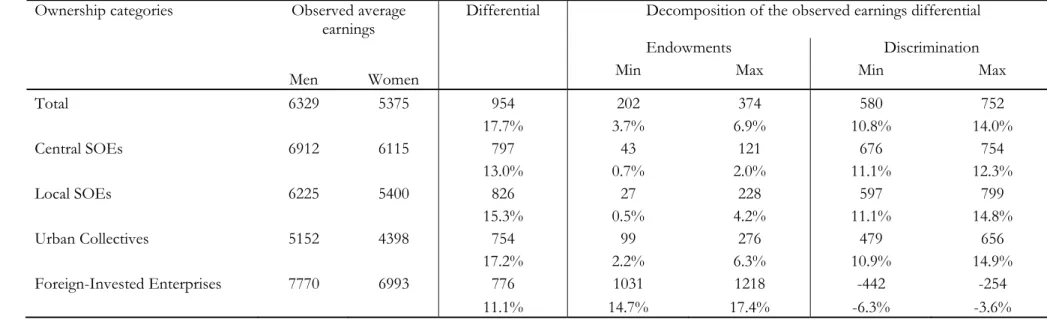
Tables 6 and 7 present static decomposition results for 1988 and 1995, by ownership, as discussed in Section 2. In 1988, 5.8 to 7.3 percentage points of the observed gap (31 to 39% of the total differential) came from differences in endowment between men and women, and 11.4 to 12.9 percentage points (61 to 69% of the total differential) came from discrimination against women. In 1995, the respective figures were 3.7 to 6.9 percentage points (21 to 39% of the total differential) for differences in endowment and 10.8 to 14 percentage points (61 to 79% of the total differential) for discrimination. Thus, the shares of both components remained approximately constant over time, discrimination against women explaining around two-third of total observed gender earnings differentials in urban China. This implies that in the absence of
26 We should also note that, as it is controversial in the literature whether the unexplained portion of gender wage gap is attributable to gender discrimination in wages or to unobserved productivity difference between men and women, alternative interpretations for the residual wage gap could also be given. For instance, the rising discrimination found in the state sector may also reflect the fact that earnings in SOEs are becoming more related to unobserved skills of individual workers and less to their observable attributes such as education attainments or seniority over time. Similarly, the declining weight of residual wage gap observed in the urban collectives could also be attributed to more individualistic initial wage structures.
discrimination, the gender earnings differential would have been 10 to 14 percentage points lower than the 18-19% differential observed in 1988 and in 1995.
As for ownership categories, Tables 6 and 7 also show substantial differences in the proportion of observed differentials arising from direct discrimination against women. Indeed, in 1988, discrimination was particularly high in central SOEs and in urban collectives, where it explained most of the observed gender wage gap, while in local SOEs, discrimination phenomena explained between 55 and 63% of the observed gap. However, throughout the period, the most substantial change arose within local SOEs, where discrimination sharply increased and explains most of observed gender wage differentials in 1995. These results confirm that market liberalization has had a very different impact on discrimination against women across the different types of domestic enterprises.
Turning to foreign-invested enterprises, our decompositions results highlight quite different features. Since the number of observations is much smaller for these enterprises, especially in 1988, we will limit interpretations to the year 1995 only. For this particular year, our decompositions do not support the hypothesis of discrimination against women in FIEs and even suggest some possible discrimination against men27
. Hence, in 1995, the most market-oriented enterprises were also those in which discrimination against women was the lowest. As discussed for urban collectives, this suggests that market forces have helped reducing the gap between men and women by improving incentives for enterprises to adopt rational behaviors. Our results for 1995 thus show a clear opposition between domestic enterprises and foreign-invested enterprises. In the former, we find a marked discrimination against women, which combined with differences in average characteristics, causes a large overall pay differential between men and women. In the latter, gender earnings differential is mainly due to differences in characteristics and discrimination phenomena play no significant role. A higher level of discrimination in domestic enterprises than in foreign-invested enterprises supports the hypothesis that the search for efficiency in foreign-foreign-invested firms, which are more subject to market mechanisms, tends to encourage flexibility and lower discrimination.
27 Similar results have been found by Maurer-Fazio and Hughes (2002), who show that in competitively obtained jobs, gender wage gaps are much reduced and discrimination against women is negligible.
6. Conclusion
Economic reforms and market liberalization in urban China from the mid-80s onwards have greatly affected gender wage differentials and discrimination against women. As emphasized in this paper, the resulting changes are made of a complex set of evolutions across enterprises, earnings distributions and time, which call for a careful analysis. Our approach combines the time dimension to the ownership dimension, adding new valuable information to the understanding of the role played by the reforms in gender wage gaps changes.
First, we find that the overall gender wage gap has been slightly narrowing over time, from 18.7% in 1988 to 17.7% in 1995. This modest change is shown to result from contrasting evolutions across different ownership structures, with a decreasing differential observed for foreign-invested enterprises, central SOEs and urban collectives, and an increasing differential for local SOEs. Second, wage dispersion is found to be the highest in the most liberalized sector in 1988, but further liberalization of the economy between 1988 and 1995 led to a rise in wage inequality within domestic enterprises resulting in a catching-up of foreign-invested enterprises. Third, we find that while the overall gender earnings gap has remained grossly stable, it has increased for the lower deciles of the wage distribution and decreased for high wage earners.
As for discrimination against women, we first show that part of the observed wage differential arises from women being over-represented in enterprises paying lower wages, whereas men are proportionately more numerous in high-pay enterprises. The segmentation of the labor market and differences in the distribution of men and women across enterprises lead to a first form of discrimination against women: the proportion of the observed earnings gap that may be directly attributed to these differences amounts to 3 to 4 percentage points. Moreover, in dynamic terms, half of the 0.9 percentage point observed decrease in the gender earnings gap between 1988 and 1995 comes from evolutions in distribution structures of men and women across enterprises.
Decomposing gender earnings differentials into endowment differences and discrimination phenomena allows for further exploration of the discrimination issue. First, our results indicate that in 1988, discrimination was quite strong in domestic enterprises, and mainly affected the top deciles of the female
earnings distribution. Hence, at the beginning of the industrial reforms, discrimination against women was most prominent in qualified occupations, whereas it was much lower for low-paying jobs. This implies that at the end of the 80s, the government control over wage settings aiming at gender equality was better enforced for lower wages than for the highest paying jobs. Second, economic reforms brought about some significant changes to discriminatory behaviors, which have affected differently the various segments of the urban labor market. Our results highlight a rise in discrimination in SOEs, concentrated at the bottom of the earnings distribution. These changes can be considered as reflecting a “catching-up” of discrimination along the female earnings distribution since the discrimination pattern in 1995 is quite flat across income deciles. Conversely, urban collectives experienced decreasing discrimination, affecting the top of the distribution and leading to an equalization of discrimination on the income scale. Lastly, our results do not support the hypothesis of discrimination against women for foreign-invested enterprises in 1995 and even seem to suggest the possibility of discrimination against men. In distributive terms, they indicate that if any, discriminatory behaviors are restricted to low-wage female earners.
Market liberalization thus appears to have affected quite differently enterprises of different ownership. On the one hand, our results suggest that the Chinese State has paid less attention to the gender equality issue over time while on the other hand, market competition seems to have helped reducing discriminatory behaviors. Moreover, our findings stress quite unequal changes across the range of earnings distribution from 1988 to 1995: while in 1988, discrimination tended to be highest for the higher deciles of the earnings distribution, the trend has been either annulated or reversed by 1995. Richest women have thus seen their relative position improving while the poorest have seen their relative position deteriorating28.
Consistent with Liu et al. (2000) and Maurer-Fazio and Hughes (2002), our results highlight the interplay of opposing forces, economic reforms contributing to changes in entrepreneurs’ (or managers’) behaviors in various dimensions First, the decentralization process led to a growing importance of decentralized choices in wage-setting decisions, leaving space for managers’ preferences and potentially unequal treatment of women. Thus, moving from the communist egalitarian ideology to a decentralized
28 Relative improvement or deterioration here are to be understood in terms of difference in differences: women’s earnings relative to men’s earnings at different positions on the income scale.
system of wage determination seems to have led to an increase in discrimination in local SOEs, and to a lesser extent in central SOEs. Our results also suggest that discriminatory behaviors against women have increased the most at the bottom of the earnings distribution, which was still most protected in 1988, thus leading to a more equal distribution of discrimination along the wage scale. Second, economic reforms not only brought about decentralization but also market competition, which is expected to favor more efficient behaviors in terms of wage settings. Discrimination being a source of inefficiency, further liberalization may tend to reduce discriminatory behaviors, which is what our results suggest for urban collectives over time and to some extent in 1995 for the comparison of foreign-invested enterprises and domestic enterprises.
Different forces are thus at stake to explain changes in gender discrimination, which are related to differences in the institutional structure of the various types of enterprises. On the one hand, by relaxing institutional rules, market liberalization weakened both the central and local governments equalizing role on wage setting rules, leaving space for discrimination to arise in state-owned enterprises. Our results suggest that this is especially true for local SOEs, which have experienced a large increase in discrimination. Being of a smaller size and farther from the direct control of the central government, these enterprises enjoyed a greater discretion in wage determination although still protected from competition and benefiting from soft budget constraints. On the other hand, increased competition induced by the development of market mechanisms actually favored the reduction of discriminating behaviors in enterprises outside the State planning structure, as highlighted here for both urban collectives and foreign-invested enterprises. These concomitant and opposite evolutions can explain why, at the aggregate level, changes are so modest. They also confirm results from Liu et al. (2000) and Maurer-Fazio and Hughes (2002) on the difficulty to assess the role of economic reforms on the relative position of women in urban China.
References
Bishop, John A., Feijun Luo and Fang Wang, 2005. “Economic transition, gender bias, and the distribution of earnings in China”, Economics of Transition 13, 2:239-259.
Blau, Francine D., and Andrea H. Beller, 1988. “Trends in earnings differentials by gender: 1971-1981.” Industrial and Labor Relations Review 41, 4: 513-529.
Blinder, Alan S., 1973. “Wage Discrimination: Reduced Form and Structural Estimates.” Journal of Human Resources 8, 4:436-455, Fall.
Brandt, Loren, and Carsten A. Holz, 2005. “Spatial Price Differences in China: Estimates and Implications.” mimeo, http://ihome.ust.hk/~socholz/SpatialDeflators.html. Forthcoming in Economic Development and Cultural Change.
Chen, Yi, Sylvie Démurger, and Martin Fournier, 2005. “Earnings differentials and ownership structure in Chinese enterprises.” Economic Development and Cultural Change 53, 4: 933-958, July.
Datta Gupta, Nabanita, Ronald L. Oaxaca, and Nina Smith, 2000. “The Danish gender wage gap and wage determination in the private and public sectors”, in Siv S. Gustafsson and Daniele E. Meulders (eds.), Gender and the Labour Market: Econometric Evidence of Obstacles to Achieving Gender Equality, New York : St. Martin's Press.
Dong, Xiaoyuan, and Paul Bowles, 2002. “Segmentation and discrimination in China’s emerging industrial labor market.” China Economic Review 13, 2-3:170-196.
Dong, Xiaoyuan, Fiona MacPhail, Paul Bowles, and Samuel P. S. Ho, , 2004. “Gender Segmentation at Work in China’s Privatized Rural Industry: Some Evidence from Shandong and Jiangsu.” World Development 32, 6:979-998.
Fournier, Martin, 2005. “Exploiting information from path dependency in Oaxaca-Blinder decomposition procedures.” Applied Economics Letters 12, 11:669-672, September.
Gustafsson, Björn, and Li Shi, 2000. “Economic transformation and the gender earnings gap in urban China.” Journal of Population Economics 13, 2:305-329.
Ho, Samuel P. S., Xiaoyuan Dong, Paul Bowles, and Fiona MacPhail, 2002. “Privatization and enterprise wage structures during transition: Evidence from rural industry in China.” Economics of Transition 10, 3: 659-688, November.
Hughes, James, and Margaret Maurer-Fazio, 2002. “Effects of Marriage, Education and Occupation on the Female/Male Wage Gap in China.” Pacific Economic Review 7, 1: 137-156, February.
Juhn Chinhui, Kevin M. Murphy, and Brooks Pierce, 1991. “Accounting for the Slowdown in Black-White Wage Convergence”, in Marvin H. Kosters (ed.), Workers and their Wages – Changing Patterns in the United States, Washington D.C.: The AEI Press.
Li, Haizheng, 2003. “Economic transition and returns to education in China.” Economics of Education Review 22, 3:317-328, June.
Liu, Pak-Wai, Xin Meng, and Junsen Zhang, 2000. “Sectoral gender wage differentials and discrimination in the transitional Chinese economy.” Journal of Population Economics 13, 2:331-352.
Liu, Pak-Wai, Junsen Zhang, and Ching Yi Kung, 2004. “What Has Happened to the Gender Wage Differential in Urban China During 1988-1999?” Mimeo, April.
Maurer-Fazio, Margaret, and James Hughes, 2002. “The Effects of Market Liberalization on the Relative Earnings of Chinese Women.” Journal of Comparative Economics 30, 4: 709-731, December.
Maurer-Fazio, Margaret, Thomas G. Rawsky, and Wei Zhang, 1999. “Inequality in the rewards for holding up half the sky: Gender wage gaps in China’s urban labour market, 1988-1994.” The China Journal 41, 55-88, January.
Meng, Xin, 1998. “Male-female wage determination and gender wage discrimination in China’s rural industrial sector.” Labour Economics 5, 1: 67-89.
Meng, Xin, and Paul Miller, 1995. “Occupational Segregation and its Impact on Gender Wages Discrimination in China’s Rural Industrial Sector.” Oxford Economic Papers 47, 1:136-155, January.
Ng, Ying Chu, 2005. “Gender Earnings Differentials and Regional Economic Development in urban China, 1988-1997”, Hong Kong Baptist University, Mimeo.
Oaxaca, Ronald, 1973. “Male-Female Wage Differentials in Urban Labor Markets.” International Economic Review 14, 3:693-709, October.
Qian, Jieyong, 1996. Gender Wage Differentials in Urban China in the 1990s, PhD. Dissertation, State University of New York at Binghamton.
Riskin, Carl, Renwei Zhao, and Shi Li, 2001. China’s Retreat from Equality – Income Distribution and Economic Transition. London: M.E. Sharpe.
Riskin, Carl, Renwei Zhao, and Shi Li, 2000. Chinese Household Income Project, 1995 [Computer file]. ICPSR version. Amherst, MA: University of Massachusetts, Political Economy Research Institute [producer], 2000. Ann Arbor, MI: Inter-university Consortium for Political and Social Research [distributor] 2000. Rozelle, Scott, Xiaoyuan Dong, Linxiu Zhang, and Andrew Mason, 2002. “Gender wage gaps in post-reform
rural China.” Pacific Economic Review 7, 1: 157-179, February.
Smith, James P., and Finis R. Welch, 1989. “Black Economic Progress after Myrdal.” Journal of Economic Literature 27, 2: 519-564.
Wellington, Alison J., 1993. “Changes in the Male/Female Wage Gap, 1976-1985.” Journal of Human Resources 28, 2: 383-411.
Yueh, Linda Y., 2004. “Wage Reforms in China during the 1990s”, Asian Economic Journal 18, 2:149-164, June. Zhao, Yaohui, 2002. “Earnings differentials between State and Non-State Enterprises in Urban China.” Pacific
Table 1 – Average earnings by ownership and by sex, 1988-1995
Ownership categories All workers(1) SOEs at central or
provincial level Local publicly owned Urban collectives Foreign-invested enterprises
Women Men Women Men Women Men Women Men Women Men
1988
Observations 7,874 8,442 2,656 3,571 3,032 3,550 2,136 1,273 29 27 Earnings(2) 3,726 4,424 4,058 4,669 3,824 4,406 3,192 3,798 4,533 6,078
Gini coefficients 0.215 0.211 0.225 0.205 0.184 0.195 0.216 0.234 0.249 0.302
Gender earnings gap (%)(3) 18.7 15.1 15.2 19.0 34.1
1995
Observations 4,154 4,653 940 1,416 2,275 2,601 852 545 50 59 Earnings 5,368 6,325 6,115 6,912 5,400 6,225 4,398 5,152 6993 7,770
Gini coefficients 0.275 0.262 0.243 0.230 0.264 0.264 0.297 0.280 0.273 0.316
Gender earnings gap (%) 17.8 13.0 15.3 17.1 11.1
Source: Authors calculation based on the 1988 and the 1995 CHIP survey data.
Notes: 1. The sample includes individuals aged 16 to 60, who declared working at least a part of the year and earning (positive) wages. Owners and employees of private or individual enterprises are excluded.
2. The earnings variable is defined as being the sum of the basic wage, bonuses, allowances and subsidies, other wages, other income from work unit and income in kind. 3. The gender earnings gap is computed as the difference between men’s earnings and women’s earnings, as a percentage of women’s earnings.
Table 2 - Differences in the gender distribution by ownership and gender earnings gaps
1988 1995
Women Men Women Men
Observed average earnings 3,726 4,424 5,368 6,325
Observed men/women earnings gap 18.7% 17.8%
Observed evolution of earnings differential (percentage points)
- 0.9
Re-weighting by the opposite sex distribution
Counterfactual average earnings 3,820 4,324 5,483 6,124
Counterfactual men/women earnings gap
Women distribution by ownership applied to men 16.1% 14.1% Men distribution by ownership applied to women 15.8% 15.4% Difference between observed and counterfactual gaps in percentage points
Women distribution by ownership applied to men 2.7 3.8 Men distribution by ownership applied to women 2.9 2.5 Re-weighting by the distribution observed for the other year
Counterfactual average earnings 3,722 4,406 5,361 6,343
Counterfactual men/women earnings gap 18.4% 18.3%
Counterfactual evolution of earnings differential in percentage points
With the 1988 distribution by ownership - 0.4
With the 1995 distribution by ownership - 0.5
Source: Authors calculation based on the 1988 and the 1995 CHIP survey data.
Notes: The gender earnings gap is computed as the difference between men’s earnings and women’s earnings, as a percentage of women’s earnings.
Table 3 - Earnings equations (1988)
Central SOEs Local SOEs Urban collectives Foreign-invested Enterprises
Men Women Men Women Men Women Men Women
Education 0.025** 0.033** 0.028** 0.035** 0.036** 0.039** 0.016 0.015 12.66 10.69 13.90 14.12 7.60 9.44 0.31 0.38 Experience 0.047** 0.056** 0.051** 0.046** 0.051** 0.049** 0.083 0.071* 25.51 20.08 28.19 21.37 15.14 14.93 1.43 2.14 Experience 2 -0.0006** -0.001** -0.0007** -0.0007** -0.0007** -0.0008** -0.0011 -0.0008 -15.49 -13.98 -17.71 -12.82 -8.98 -10.49 -0.60 -0.75 # dependent 0.060* 0.048 0.018 0.056* 0.045 -0.002 0.148 0.183 members 2.60 1.52 0.90 2.57 1.12 -0.05 0.36 0.40 Household size -0.048** -0.049** -0.040** -0.048** -0.053** -0.060** -0.091 -0.224* -8.95 -6.61 -7.40 -8.18 -5.31 -7.03 -0.61 -2.14 Tertiary sector -0.035* -0.022 -0.011 -0.015 -0.011 -0.029 0.341 0.131 -3.17 -1.43 -0.99 -1.31 -0.46 -1.64 1.33 0.80 Coast 0.120** 0.130** 0.038** 0.019 0.111** 0.140** 0.504 -0.563 9.50 7.61 3.48 1.52 5.18 7.75 1.27 -1.24 Constant 7.595** 7.403** 7.452** 7.441** 7.304** 7.262** 7.055** 8.650** 202.74 132.91 200.34 169.90 99.58 106.41 6.56 13.22 Observations 3555 2641 3536 3023 1266 2129 27 29 R2 0.36 0.26 0.38 0.29 0.35 0.23 0.51 0.62
Notes: 1. The dependent variable is the logarithm of total earnings.
2. The reference category for regional location is the non-coastal region. The coastal dummy variable takes 1 for Beijing, Guangdong and Jiangsu, and 0 for the seven other provinces included in the data set.
3. The reference for economic sector is the secondary sector (including industry and construction). 4. Numbers in italics are t-statistics. * Significant at 5 percent level ** Significant at 1 percent level
Table 4 - Earnings equations (1995)
Central SOEs Local SOEs Urban collectives Foreign-invested Enterprises
Men Women Men Women Men Women Men Women
Education 0.029** 0.060** 0.049** 0.058** 0.058** 0.047** 0.057 0.099* 6.16 8.09 13.11 11.10 5.19 5.09 1.35 2.77 Experience 0.047** 0.071** 0.044** 0.083** 0.052** 0.077** 0.024 0.024 10.41 9.92 12.61 17.33 5.41 9.64 0.90 0.66 Experience 2 -0.0006** -0.0014** -0.0006** -0.0018** -0.0009** -0.0017** -0.0002 0.0003 -6.51 -7.76 -7.42 -14.84 -4.10 -9.05 -0.33 0.28 # dependent -0.055 0.004 0.007 -0.058* 0.014 -0.072 0.115 -0.123 members -1.63 0.08 0.29 -1.99 0.21 -1.58 0.61 -0.73 Household size -0.025 -0.022 -0.064** -0.053** -0.061 -0.052* 0.088 0.052 -1.53 -0.92 -5.17 -3.24 -1.67 -2.04 0.89 0.58 Tertiary sector 0.072* 0.038 0.046* 0.031 -0.155* -0.002 -0.142 0.122 2.93 1.05 2.52 1.30 -2.85 -0.06 -0.78 0.82 Coast 0.234** 0.250** 0.337** 0.307** 0.291** 0.432** -0.016 0.314 8.28 6.14 17.33 12.42 5.57 11.19 -0.08 1.76 Constant 7.727** 7.129** 7.496** 7.078** 7.295** 7.056** 7.534** 6.730** 79.93 47.13 99.47 68.40 32.75 41.02 10.39 8.04 Observations 1416 940 2601 2275 545 852 59 50 R2 0.23 0.21 0.28 0.22 0.19 0.26 0.11 0.29
Table 5 – Dynamic decomposition of wage differentials between men and women, by ownership (1988-95)
Observed incomes Observed incomes Decomposition of the observed change in differential in 1988 in 1995 Change in endowments Change in discrimination
Ownership Women Men Women Men Min Max Min Max
Total 3733 4431 5375 6329
Observed differential 18.7% 17.7%
Observed change in differential -0.9% -5.5% -5.1% 4.1% 4.6%
Central SOEs 4058 4671 6115 6912
Observed differential 15.1% 13.0%
Observed change in differential -2.1% -5.2% -1.8% -0.3% 3.2%
Local SOEs 3825 4404 5400 6225
Observed differential 15.2% 15.3%
Observed change in differential 0.1% -5.6% -5.3% 5.5% 5.7%
Urban Collectives 3190 3799 4398 5152
Observed differential 19.1% 17.2%
Observed change in differential -1.9% 3.0% 4.1% -6.0% -5.0%
Foreign-Invested Enterprises 4533 6078 6993 7770
Observed differential 34.1% 11.1%
Observed change in differential -23.0% -44.7% 5.0% -28.0% 21.7%
Table 6 – Static decomposition of gender earnings differentials by ownership (1988)
Ownership categories Observed average
earnings Differential Decomposition of the observed earnings differential
Endowments Discrimination
Men Women Min Max Min Max
Total 4431 3733 698 217 273 425 481 18.7% 5.8% 7.3% 11.4% 12.9% Central SOEs 4671 4058 613 46 165 448 567 15.1% 1.1% 4.1% 11.0% 14.0% Local SOEs 4404 3825 580 212 261 318 368 15.2% 5.5% 6.8% 8.3% 9.6% Urban Collectives 3799 3190 609 49 65 544 560 19.1% 1.5% 2.0% 17.1% 17.5% Foreign-Invested Enterprises 6078 4533 1545 748 1272 273 797 34.1% 16.5% 28.1% 6.0% 17.6%
Table 7 – Static decomposition of gender earnings differentials by ownership (1995)
Ownership categories Observed average
earnings Differential Decomposition of the observed earnings differential
Endowments Discrimination
Men Women Min Max Min Max
Total 6329 5375 954 202 374 580 752 17.7% 3.7% 6.9% 10.8% 14.0% Central SOEs 6912 6115 797 43 121 676 754 13.0% 0.7% 2.0% 11.1% 12.3% Local SOEs 6225 5400 826 27 228 597 799 15.3% 0.5% 4.2% 11.1% 14.8% Urban Collectives 5152 4398 754 99 276 479 656 17.2% 2.2% 6.3% 10.9% 14.9% Foreign-Invested Enterprises 7770 6993 776 1031 1218 -442 -254 11.1% 14.7% 17.4% -6.3% -3.6%