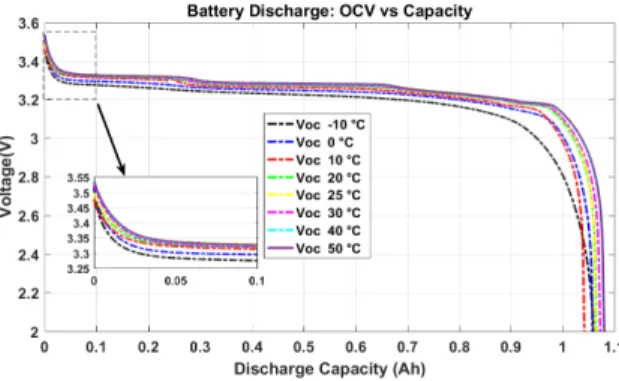
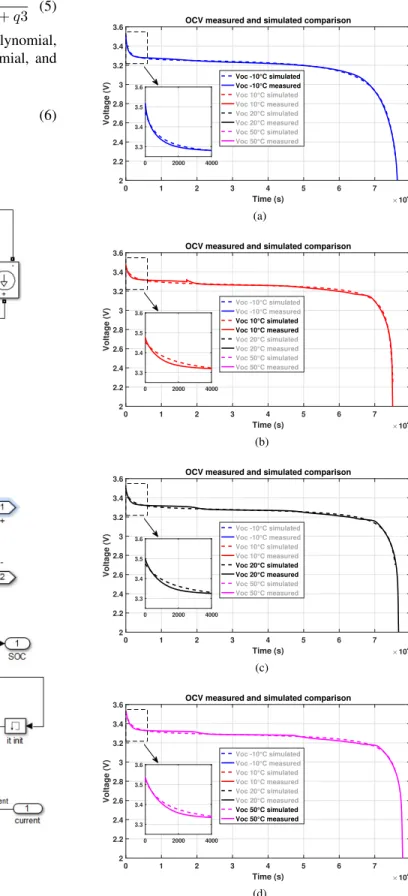
Open Circuit Voltage of a Lithium ion Battery Model adjusted by data fitting
Texte intégral
Figure
Documents relatifs
Impact of electrode surface capacity on cost Within this study, we are suggesting to compare the influence on cost of several cathode materials at the same electrode coating
The model is validated by comparing to experimental results in two main aspects; air flow behaviour close to cell surface at different initial cooling air velocities and
Most of the mechanisms incorporated in physical models are related to the negative electrode but they have investigated the impact of the stress occurring during the
Le TF précise en particulier la notion d’immeuble ancien, qu’il nie en l’espèce, et examine ensuite le caractère admissible du loyer sur la base d’un calcul de rendement
As a final remark, we would like to stress that current available 3D electrode micro/mesostructure generators (such as GEODICT ® [52] ) rely on random location
L’objectif de ce travail consiste à évaluer les concentrations en plomb d’origine routière et d’établir une cartographie de la pollution à l’aide d’une espèce de
D’un autre côte, deux techniques récentes ont été utilisé pour confirmer l’existence du chaos dans le système étudié : le fer à cheval topologique, une méthode
In this population-based cohort study, higher adherence to a Mediterranean-type diet was associated with slower decline of MMSE but not other cognitive tests and was not associated
