RESEARCH OUTPUTS / RÉSULTATS DE RECHERCHE
Author(s) - Auteur(s) :
Publication date - Date de publication :
Permanent link - Permalien :
Rights / License - Licence de droit d’auteur :
Institutional Repository - Research Portal
Dépôt Institutionnel - Portail de la Recherche
researchportal.unamur.be
University of NamurA Model of Weekly Labor Participation for a Belgian Synthetic Population
Cirillo, Cinzia; Cornelis, E.; Toint, Philippe
Published in:
Networks and Spatial Economics
DOI:
10.1007/s11067-010-9145-4 Publication date:
2012
Document Version
Early version, also known as pre-print
Link to publication
Citation for pulished version (HARVARD):
Cirillo, C, Cornelis, E & Toint, P 2012, 'A Model of Weekly Labor Participation for a Belgian Synthetic Population', Networks and Spatial Economics, vol. 12, no. 1, pp. 59-73. https://doi.org/10.1007/s11067-010-9145-4
General rights
Copyright and moral rights for the publications made accessible in the public portal are retained by the authors and/or other copyright owners and it is a condition of accessing publications that users recognise and abide by the legal requirements associated with these rights. • Users may download and print one copy of any publication from the public portal for the purpose of private study or research. • You may not further distribute the material or use it for any profit-making activity or commercial gain
• You may freely distribute the URL identifying the publication in the public portal ?
Take down policy
If you believe that this document breaches copyright please contact us providing details, and we will remove access to the work immediately and investigate your claim.
A model of weekly labor participation for a Belgian synthetic population
by C. Cirillo, E. Corn´elis and Ph. L. Toint Report NAXYS-09-2011 15 March 2011
University of Namur
61, rue de Bruxelles, B5000 Namur (Belgium) http://www.fundp.ac.be/sciences/naxys
A model of weekly labor participation for a Belgian synthetic population
Cinzia Cirillo*, Eric Cornelis** and Philippe L. Toint** * The University of Maryland
College Park, MD 20742 USA ** The University of Namur Transportation Research Group
5000, Namur Belgium
Abstract
This paper presents a model of labor participation calibrated on a weekly basis; part-time and full-time employments are also considered. By applying the theory of random utility maximization we model households’ choices. In order to have a good temporal and spatial coverage the model is calibrated on three datasets, extracted from both national and regional travel surveys. The results are applied to synthetic households that reproduce the Belgian population. The proposed innovative methodology simulates synthetic agents by accounting both for households’ and individuals’ characteristics, while not suffering from the problem of the “zero cell value”. The results indicate that there is major day-to-day variability in working activity participation; in particular, on Wednesdays and Fridays the number of households working part-time or not working is particularly high. This is consistent with what was expected by the analysts. Working participation is a fundamental component in activity based models where work is considered a skeletal activity. The tools developed here can be useful to study how changes in population characteristics (i.e. increases of flexible working arrangements and of the number of women in the work force) affect activity participation and travel patterns.
1. Introduction
The work patterns of individuals or households continue to provide a major determinant in daily mobility, even if a number of recent contributions indicate that it is not, or no longer, the only critical one. (Cirillo and Toint, 2001) It is therefore natural, along with other attempts to explicit the other important structural factors, to investigate the real content and impact of work patterns. Although this subject has been already considered by the transportation research community, and for a long time, it has often been considered rather broadly, with a strong emphasis on effects such as departure time, expected traveled distance or mode of transportation, but the analysis of the patterns themselves has not been so frequently been carried out. Our purpose is therefore to focus on the patterns structure, and to consider the construction of the household work pattern as a piece of the household activity scheduling. However, if one restricts the scope to daily patterns scheduling, then the number of useful distinctions shrinks considerably and often boils down to the distinction between full-time and part-time work, with possible consideration for industrial work shifts, or questions about who is responsible for the organization of the working hours (Hubert and Toint, 2002). However, analysis of the existing data on work pattern structure (Pas, 1988) indicates that there is considerable variation from day to day, and that variations across individuals are also correlated to variations over the days. Thus it is our opinion that the global view of work trips, tours or chains can hardly be realistically apprehended if one limits oneself to the daily and individual view.
Existing operational activity-based models invariably assume a planning horizon of a single day (Arentze and Timmermans, 2007). Recent research works are attempting to introduce dynamics into activity-based model systems. Arentze and Timmermans (2007) use the need-based framework for defining dynamic activity utility functions and to develop a heuristic method to generate activity agendas on a multi-day, multi-person basis. The model focuses on early stage of the activity scheduling process, while travel choices needed to implement the activities are left out of the model. Moreover Arentze et al, (2008) propose a methodology to model Longitudinal Activity Pattern (LAP) formation from one-day travel survey. They assert that the probability of observing a particular activity pattern on a random day can be derived from a dynamic model as a function of its parameters; the parameters entering the probability functions are estimated on one-day observations using standard log-likelihood methods. Cirillo and Axhausen (2006) present a model for the choice of activity-type and timing incorporating the dynamics of scheduling and estimated on a six-week travel diary. Their results clearly show that past history of activity involvement indeed has an influence on current activity choice, as already argued by Hamed and Mannering in 1993. Habib and Miller (2008) have presented a demand system model for daily activity program based on Kuhn-Tucker mathematical formulation. The model accommodate within-day and day-to-day dynamics in time-use and is calibrated on CHASE, a one-week travel survey collected in Toronto.
Furthermore, micro-simulation methods and activity-based models for travel behavior analysis require disaggregate synthesis of the population. Household and individual complex decisions’ tree depends in all their components on socio-economic characteristics of the population. The work by Beckman and al. published in 1996 is still considered a valid reference in transportation. This technique uses aggregate 1990 census data and the disaggregate Public Use Microdata Sample (PUMS). Individual population records are constructed on disaggregate data, while the consistency of the produced multi-way tables is provided by the aggregate data. Two problems are often attributed to this method; the first, denominated incorrect zero-values, is related to the impossibility to synthesize a demographic group that is present in the aggregate population but not represented in the sample of the
disaggregate data; the second is due to the impossibility to base the synthetic population on both household characteristics and individual characteristics.
More recent research papers provide alternative methods to overcome the problems mentioned above. Guo and Bhat (2007) propose an extension of the conventional approach that controls the statistical distributions of both household- and individual-level variables. The “incorrect zero cell value” problem is circumvented by providing users the capability to specify their choice of control variables and class definitions.
Arentze and al. (2007) proposes a method to generate synthetic households based on data that just contain distributions of individuals. The two-step procedure first converts known marginal distributions of individuals into marginal distributions of households on relevant attributes. Then the resulting marginal household distributions are used as constraints of a multi-way table of household counts. The method does not solve the problem of zero-value cells. Pritchard and Miller (2008) propose a modified version of the Iterative Proportional Fitting method (IPF) called IPF with a sparse list-based data structure that allows the definition of many attributes per agent to be simulated. Additionally, the new approach is able to synthesize the relationships between agents, allowing the formation of household and family agents in addition to individual person agents.
Over the past 30 years labor market participation has changed a lot in many developed countries; there has been an increase in part-time relative to full-time employment. Part-time employment offers workers a good way of striking a balance between the time they must spend earning a living and the time they wish to devote to other activities. (Bollé, 1997). In 2005, 22% of the active population in Belgium is reported to work part-time, comprising 8% of working men and 40% of working women (European Foundation for the Improvement of Living and Working Conditions, 2007). Work activity is considered as a skeletal activity in most of the activity based framework proposed in the literature (Bhat and Singh, 2000; Cirillo and Toint, 2001, Habib and Miller, 2008). However no other studies, to the best of our knowledge, account for the dynamics in work activity participation across members of the household and across days of the week.
We present in that paper an attempt to extend the analysis of the household work patterns to a weekly horizon, rather than to the more common daily one. We believe that this weekly pattern is considerably more adapted to the description of the observed variability, although we are aware of even longer cycles such as those depending on seasons or annual holidays. We therefore focus on the determinants of the choice, for a household of given socio-economic characteristics and composition, of the choice of a weekly work pattern for all household members simultaneously. We also discuss the parallel construction of a synthetic population for Belgium; this population consists in a set of households themselves containing individuals.
The remaining part of that paper is articulated as follows. Section 2 presents the methodology for simulating the Belgian population and the innovative features proposed. In Section 3 both the model formulation and its application to the estimation of the weekly model are given. Section 4 describes the three sets of data used. Results from the model calibration and the differences across day of weeks are presented on Section 5. The application of the model to the synthetic population together with a geographical representation of the main results is provided in Section 6. Conclusions and future research perspectives are presented in Section 7.
2. The synthetic population
For the sake of completeness, and although this is not the main focus of the present contribution, we start by outlining the development of the Belgian synthetic population used in the remainder of this paper. This population consists in a set of slightly over 4,400,000 households comprising just over 10,600,000 individuals and located in the 589 Belgian municipalities. Each individual is identified by his/her age, gender, driving license ownership, activity status and education level. There are eight age classes, three activity status (active, inactive, student) and four education levels. Each household has a type (ten types are considered) and a home location in one of the municipalities, themselves distributed between four different land-use categories (urban, suburbs, migratory area, rural).
Because the available data contains considerable inconsistencies (the data has been collected by different agencies on different periods), we found it difficult to use any of the methods developed by Guo and Bhat (2007) or Pritchard and Miller (2008), but have instead developed our own technique for constructing the population. This technique may be outlined as follows. The population of individuals is first built by successive constrained random selection in empirical parameter distributions. These distributions were extracted from a variety of data sources: the national travel census (for number of individuals), demographic studies (for age classes, activity status and education levels), existing travel surveys (MOBEL in particular) and, finally, data from the federal transport administration (for driving license ownership). The individuals are subsequently grouped into households, under the constraints to reproduce known empirical distributions per municipality (for household numbers and types), inconsistencies being resolved by least-squares fitting at the municipality level. The building of the Belgian synthetic population is presented in Barthelemy et alii (2010) and the details of this procedure are described in Barthelemy and Toint (2010).
3. A RUM model for weekly working participation
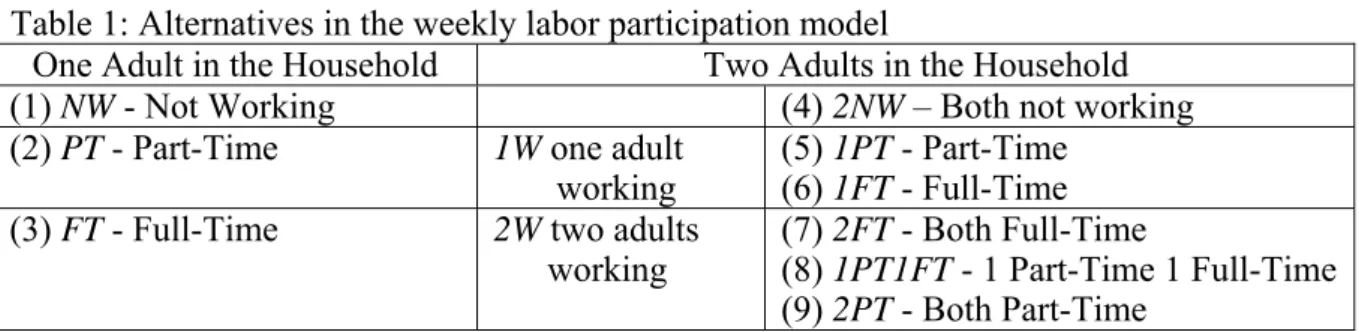
This Section describes the operational model for the weekly households’ working participation. The model is developed under the discrete choice theory. We suppose that the decisions are made at household level; we consider here households with one or two adults. The model estimates only the working program for weekdays regardless the duration of the work-activity and the schedule. For each time period di, identified by the days of the week (from Monday to Friday), we calculate the probability P[WPdi] that a household will include the work activity into its program or not. We also make a distinction between part-time and full-time employments. The nine alternatives resulting from this modeling framework are given in Table 1.
Table 1: Alternatives in the weekly labor participation model
One Adult in the Household Two Adults in the Household (1) NW - Not Working (4) 2NW – Both not working (2) PT - Part-Time 1W one adult
working (5) 1PT - Part-Time (6) 1FT - Full-Time (3) FT - Full-Time 2W two adults
working (7) 2FT - Both Full-Time (8) 1PT1FT - 1 Part-Time 1 Full-Time (9) 2PT - Both Part-Time
We assume that at the beginning of each period the decisions made by the household are independent of both future plans and past participation. This assumptions derives mainly from the fact that the model is calibrated on cross-sectional data, for which information about
the history of the families in the sample are not available. However, we believe that this assumption is less restrictive for working activity participation than for discretionary and maintenance activities which are expected to be executed on a more irregular basis. Therefore the independence hypothesis could be formulated for the probabilities of working at each weekday.
P[WPd1, WPd2, WPd3, WPd4, WPd5] = P[WPd1] · P[WPd2] · P[WPd3] · P[WPd4] · P[WPd5] The illustrated independent daily model can assume that the utility that the household gains from the participation to work not change over the days of the week U[WPdi] = U[WPdj] or that it is different from day-to-day U[WPdi] ≠ U[WPdj]. The utilities are expressed in compliance with the random utility theory as follows:
di a a a di X WP U
Where is the vector of the parameters to be estimated and X the attributes that specify the systematic utility VWPdi , a being the index through these attributes. The attributes in the utility functions are the socio-demographics that also define the synthetic populations; we use individual attributes (age, gender, level of education, activity status and driving license ownership) and household attributes (household type: single with or without children, couple with or without children).
In summary, the probability of working participation on day di P[WPdi] can be expressed as follow:
P[WPdi] = P[NWdi,PTdi,FTdi, 2NWdi, (PTdi,FTdi) | 1Wdi, (2FTdi,2PTdi,1PT1FTdi) | 2Wdi] And if we assume that the di comply with the nested logit assumptions, which assume that
di
is i.i.d. Gumbel distributed with tree factors (TF)
2 1 1 , 1 the probability of P[WPdj] is given by:
k W dk W dk dk W dj W dj dj dj WP WP WP P 2 2 1 1 2 2 1 1 exp exp where:
di di FT PT W di ln 1 exp V V 1 1
di di di PT FT PT FT W di V2 V2 V1 1 2 2 ln 1 expThe model is estimated by combining three different data sets, corresponding to three surveys executed on different spatial and temporal settings. When combining the data we assume that the unobserved factors are different for the three types of data. To account for these differences scale factors (SF) are specified; in particular we normalize one of the scale parameters to one and we estimate the remaining two. This scale factors reflects the variance of unobserved factors in each data-set with respect to the data set of reference. We use
standard procedures (Hensher and Bradley, 1993; Bradley and Daly, 1991) to estimate this model on software for nested logit models.
4. The data
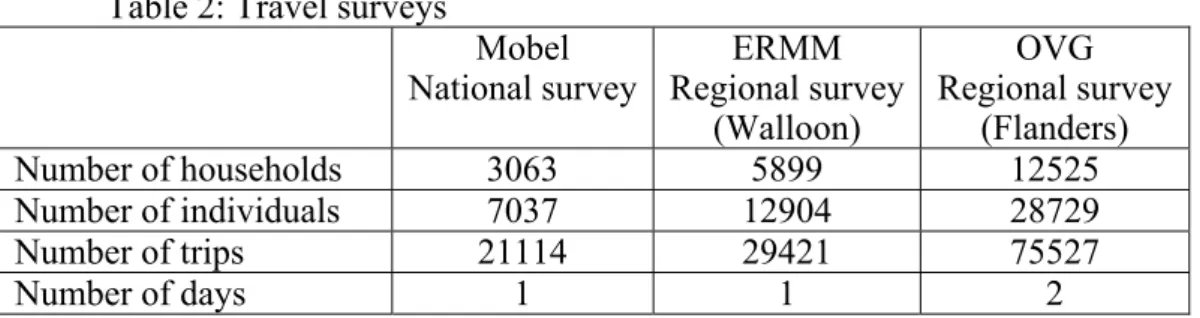
Belgium is a federal state organized in three regions (Brussels, Walloon Region and Flemish Region); each region has, to a large extent, administrative and political independence. To cover the Belgian national territory and to capture the behavioral differences existing across the three Regions we used three sources of data. The three surveys, called MOBEL (Mobilité en Belgique), ERMM (Enquête Régionale de Mobilité des Ménages en Région Wallonne) and OVG (Onderzoek Verplaatsingsgedrag Vlaanderen), were all conceived as travel diaries and held between 1999 and 2003. The number of households, individuals, trips and days recorded in each survey is reported in Table 2. MOBEL is a national travel survey, with a special focus on the capital Brussels; although the data collected are representative of the Belgian population, the observations were insufficient to calibrate a weekly model of working participation. The two Regional surveys, collected with similar protocol, provided the supplementary information needed to capture the behavioral differences from day-to-day. MOBEL and ERMM databases store information on a daily basis, while the OVG survey contains trips data over two days of the same week. However, the second day recorded has never been used because it was judged biased by the group in charge of the project. To respect these findings and for homogeneity our final database contains one day trip chain (the first recorded) for each individual. We acknowledge that this way to proceed cannot account for differences among working participation programs across weeks. A project to collect travel diary over an entire week is currently conducted in Belgium.
Table 2: Travel surveys
Mobel National survey Regional survey ERMM
(Walloon) OVG Regional survey (Flanders) Number of households 3063 5899 12525 Number of individuals 7037 12904 28729 Number of trips 21114 29421 75527 Number of days 1 1 2
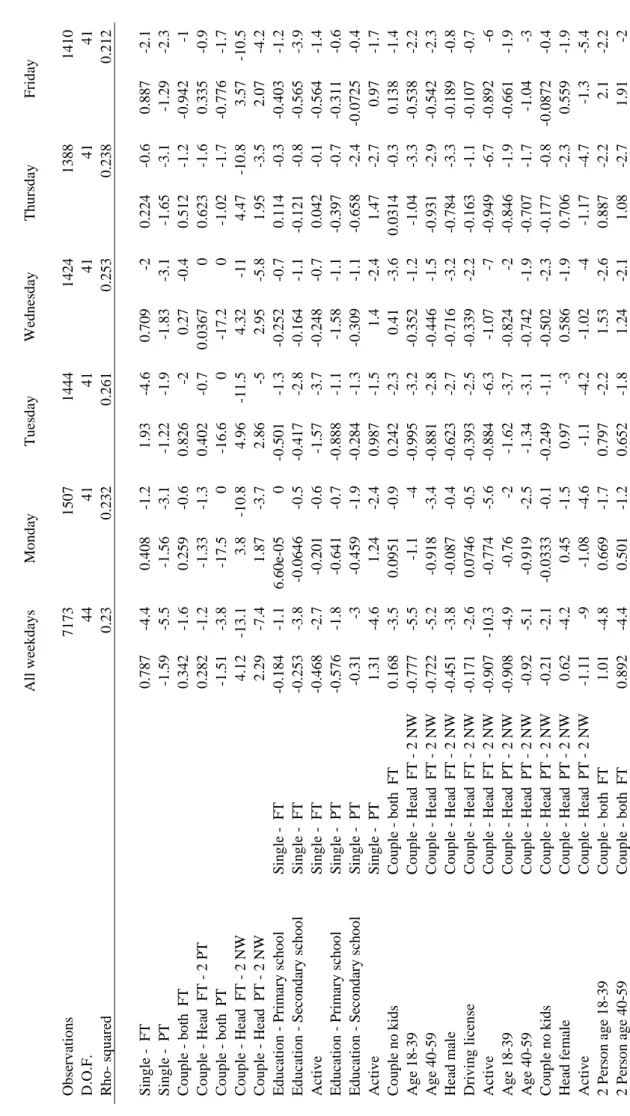
5. The estimation results
Using the three data sets described in Section 4 we calibrated a joint model of working participation. The model is based on the random utility theory and assumes that households maximize their utility when deciding (1) which member of the family is going to work and (2) if the participation is full time or part time type. Single household and two adults’ household choices are represented in the decision tree. The model presents nine alternatives (see Table 1); the final results of the model calibration are presented in Table 3. The model is calibrated on the full set of data (all weekday columns) and separately for each day of the week; the specification remains unchanged for simplicity even when some of the variables become not significant. The models present seven alternative specific constants, thirty four socio-economic variables, two scale coefficients and one nested structure coefficient; in total the model has forty four degrees of freedom. The scale coefficients represent the variance of unobserved factors in the OVG and the ERMM datasets with respect to the variance in the Mobel dataset, which is assumed to be the reference value. Both scale values are greater than one, indicating that more variance exists in these two regional data sets than in the national
data set (Mobel). The nested structure coefficient is significantly less than one, which is consistent with RUM theory. The two scale factors (SF) and the tree coefficients (TC) are calibrated on the whole set of data and constrained to these values when model for each day of the week were estimated. The attempt to estimate scale and tree coefficients on the daily models failed; convergence was not achieved probably because the model was too complex to be estimated on the number of observations available for each singular day.
The model includes just the socio-economic variables that define the Belgian synthetic population: age (on two segments: 18-39 and 40-59), sex, education (primary, secondary and high school), driving license, presence of children in the household, active status. A distinction between the head of the household and the second adult component is also made. The interpretation of the values and the signs assumed by the variables is difficult. The validity of the results obtained and the difference across days are described in the next Section where the model coefficients are applied to model households’ decisions regarding daily working participation in Belgium.
8
Table 3: Model results
A ll w eek d ays Mo nd ay Tu esd ay W edn esd ay Thu rsd ay Fr id ay O b serv atio ns 7 173 1 507 1 444 1 424 1 388 1 410 D. O.F . 44 41 41 41 41 41 R h o - sq u are d 0. 23 0. 23 2 0. 26 1 0. 25 3 0. 23 8 0. 21 2 Si ngl e - FT 0. 78 7 -4 .4 0. 40 8 -1 .2 1. 93 -4 .6 0. 70 9 -2 0. 22 4 -0 .6 0. 88 7 -2 .1 Single - PT -1 .5 9 -5 .5 -1 .5 6 -3 .1 -1 .2 2 -1 .9 -1 .8 3 -3 .1 -1 .6 5 -3 .1 -1 .2 9 -2 .3 C o u p le b o th FT 0. 34 2 -1 .6 0. 25 9 -0 .6 0. 82 6 -2 0. 27 -0 .4 0. 51 2 -1 .2 -0 .9 4 2 -1 C o u p le Hea d FT - 2 P T 0. 28 2 -1 .2 -1 .3 3 -1 .3 0. 40 2 -0 .7 0. 03 6 7 0 0. 62 3 -1 .6 0. 33 5 -0 .9 C o u p le b o th PT -1 .5 1 -3 .8 -1 7. 5 0 -1 6. 6 0 -1 7. 2 0 -1 .0 2 -1 .7 -0 .7 7 6 -1 .7 C o u p le Hea d FT - 2 N W 4. 12 -1 3. 1 3. 8 -1 0. 8 4. 96 -1 1. 5 4. 32 -1 1 4. 47 -1 0. 8 3. 57 -1 0. 5 C o u p le Hea d PT - 2 N W 2. 29 -7 .4 1. 87 -3 .7 2. 86 -5 2. 95 -5 .8 1. 95 -3 .5 2. 07 -4 .2 Ed ucat io n - Pri m ary scho ol Si ngl e - FT -0 .1 8 4 -1 .1 6. 60e -05 0 -0 .5 0 1 -1 .3 -0 .2 5 2 -0 .7 0. 11 4 -0 .3 -0 .4 0 3 -1 .2 Ed ucation - Se con d ar y sch o o l Single - FT -0 .2 5 3 -3 .8 -0 .0 6 46 -0 .5 -0 .4 1 7 -2 .8 -0 .1 6 4 -1 .1 -0 .1 2 1 -0 .8 -0 .5 6 5 -3 .9 Active Single - FT -0 .4 6 8 -2 .7 -0 .2 0 1 -0 .6 -1 .5 7 -3 .7 -0 .2 4 8 -0 .7 0. 04 2 -0 .1 -0 .5 6 4 -1 .4 Ed ucation - Pri m ary scho ol Single - PT -0 .5 7 6 -1 .8 -0 .6 4 1 -0 .7 -0 .8 8 8 -1 .1 -1 .5 8 -1 .1 -0 .3 9 7 -0 .7 -0 .3 1 1 -0 .6 Ed ucation - Se con d ar y sch o o l Single - PT -0 .3 1 -3 -0 .4 5 9 -1 .9 -0 .2 8 4 -1 .3 -0 .3 0 9 -1 .1 -0 .6 5 8 -2 .4 -0 .0 7 25 -0 .4 Act iv e Si ngl e - PT 1. 31 -4 .6 1. 24 -2 .4 0. 98 7 -1 .5 1. 4 -2 .4 1. 47 -2 .7 0. 97 -1 .7 C o u p le no ki ds C o u p le b o th FT 0. 16 8 -3 .5 0. 09 5 1 -0 .9 0. 24 2 -2 .3 0. 41 -3 .6 0. 03 1 4 -0 .3 0. 13 8 -1 .4 Age 1 8 -3 9 Cou p le Hea d FT - 2 N W -0 .7 7 7 -5 .5 -1 .1 -4 -0 .9 9 5 -3 .2 -0 .3 5 2 -1 .2 -1 .0 4 -3 .3 -0 .5 3 8 -2 .2 Age 4 0 -5 9 Cou p le - Hea d FT - 2 N W -0 .7 2 2 -5 .2 -0 .9 1 8 -3 .4 -0 .8 8 1 -2 .8 -0 .4 4 6 -1 .5 -0 .9 3 1 -2 .9 -0 .5 4 2 -2 .3 Head m ale Cou p le - Hea d FT - 2 N W -0 .4 5 1 -3 .8 -0 .0 8 7 -0 .4 -0 .6 2 3 -2 .7 -0 .7 1 6 -3 .2 -0 .7 8 4 -3 .3 -0 .1 8 9 -0 .8 Dri v in g license Cou p le - Hea d FT - 2 N W -0 .1 7 1 -2 .6 0. 07 4 6 -0 .5 -0 .3 9 3 -2 .5 -0 .3 3 9 -2 .2 -0 .1 6 3 -1 .1 -0 .1 0 7 -0 .7 Active Cou p le - Hea d FT - 2 N W -0 .9 0 7 -1 0. 3 -0 .7 7 4 -5 .6 -0 .8 8 4 -6 .3 -1 .0 7 -7 -0 .9 4 9 -6 .7 -0 .8 9 2 -6 Age 1 8 -3 9 Cou p le Hea d PT - 2 N W -0 .9 0 8 -4 .9 -0 .7 6 -2 -1 .6 2 -3 .7 -0 .8 2 4 -2 -0 .8 4 6 -1 .9 -0 .6 6 1 -1 .9 Age 4 0 -5 9 Cou p le Hea d PT - 2 N W -0 .9 2 -5 .1 -0 .9 1 9 -2 .5 -1 .3 4 -3 .1 -0 .7 4 2 -1 .9 -0 .7 0 7 -1 .7 -1 .0 4 -3 Cou p le no ki ds Cou p le - Hea d PT - 2 N W -0 .2 1 -2 .1 -0 .0 3 33 -0 .1 -0 .2 4 9 -1 .1 -0 .5 0 2 -2 .3 -0 .1 7 7 -0 .8 -0 .0 8 72 -0 .4 Head fem al e C o u p le Hea d PT - 2 N W 0. 62 -4 .2 0. 45 -1 .5 0. 97 -3 0. 58 6 -1 .9 0. 70 6 -2 .3 0. 55 9 -1 .9 Active Cou p le - Hea d PT - 2 N W -1 .1 1 -9 -1 .0 8 -4 .6 -1 .1 -4 .2 -1 .0 2 -4 -1 .1 7 -4 .7 -1 .3 -5 .4 2 Pe rs on age 1 8 -3 9 C o u p le b o th FT 1. 01 -4 .8 0. 66 9 -1 .7 0. 79 7 -2 .2 1. 53 -2 .6 0. 88 7 -2 .2 2. 1 -2 .2 2 Pe rs on age 4 0 -5 9 C o u p le b o th FT 0. 89 2 -4 .4 0. 50 1 -1 .2 0. 65 2 -1 .8 1. 24 -2 .1 1. 08 -2 .7 1. 91 -2
9 rs on m ale Cou p le b o th FT -0 .1 4 2 -2 .5 -0 .1 0 4 -0 .8 -0 .1 8 9 -1 .4 -0 .3 0 6 -2 .3 0. 11 -0 .8 -0 .1 9 6 -1 .6 rs on active Cou p le b o th FT -0 .9 4 5 -7 .9 -0 .5 3 6 -2 .8 -1 .1 7 -4 .7 -1 .5 1 -6 -0 .9 8 9 -4 .3 -0 .7 2 8 -3 .5 rs on age 1 8 -3 9 C o u p le b o th PT 0. 51 1 -2 .3 1. 6 -1 .5 0. 86 4 -1 .5 1. 32 -1 .7 0. 05 0 5 -0 .1 0. 22 -0 .6 rs on age 4 0 -5 9 C o u p le b o th PT 0. 44 8 -2 1. 69 -1 .6 0. 68 8 -1 .2 1. 13 -1 .4 0. 20 8 -0 .6 0. 06 2 4 -0 .2 rs on m ale Cou p le b o th PT -0 .1 2 -1 .7 -0 .1 5 3 -1 -0 .0 8 45 -0 .5 -0 .0 9 36 -0 .6 -0 .0 2 06 -0 .1 -0 .1 8 2 -1 .2 rs on active Cou p le b o th PT -0 .7 3 8 -5 .8 -0 .3 7 1 -1 .7 -1 .0 7 -4 .1 -1 .2 6 -4 .7 -0 .7 2 3 -2 .8 -0 .4 4 2 -1 .9 rs on wi th l icense C o u p le b o th part -t im e 0. 79 4 -2 16 .6 0 15 .9 0 16 .4 0 0. 41 1 -0 .7 0. 09 1 6 -0 .2 rs on M al e C o u p le Hea d FT - 2 N W 0. 35 -2 .8 -0 .0 7 4 -0 .3 0. 47 -1 .8 0. 56 2 -2 .2 0. 90 4 -3 .4 0. 05 4 8 -0 .2 rs on E duc at ion - Hi g h sc ho ol C o u p le Hea d FT - 2 N W -0 .2 0 1 -4 .4 -0 .1 3 3 -1 .3 -0 .2 3 8 -2 .5 -0 .2 6 3 -2 .7 -0 .1 3 3 -1 .3 -0 .2 3 4 -2 .4 rs on with license Cou p le Hea d FT - 2 N W -0 .2 6 1 -3 .7 -0 .6 2 9 -3 .8 -0 .1 7 6 -1 .1 -0 .0 3 25 -0 .2 -0 .2 6 3 -1 .8 -0 .2 4 8 -1 .5 rs on active Cou p le Hea d FT - 2 N W -1 .6 9 -1 1. 5 -1 .1 6 -6 -2 .1 1 -8 -2 .0 8 -7 .9 -1 .8 5 -7 .5 -1 .4 6 -6 .8 rs on age 1 8 -3 9 Cou p le Hea d PT - 2 N W -0 .3 8 8 -2 .5 -0 .6 9 -2 0. 25 1 -0 .7 -0 .7 9 5 -2 .3 -0 .2 5 2 -0 .7 -0 .4 1 -1 .1 rs on age 4 0 -5 9 Cou p le Hea d PT - 2 N W -0 .2 3 1 -1 .5 -0 .4 6 3 -1 .3 -0 .0 5 7 -0 .2 -0 .7 1 1 -2 .2 0. 03 5 9 -0 .1 0. 01 8 6 -0 .1 rs on m al e C o u p le Hea d PT - 2 N W 0. 61 1 -4 .1 0. 46 6 -1 .5 0. 12 9 -0 .4 0. 93 2 -3 1. 14 -3 .5 0. 47 1 -1 .5 rs on active Cou p le Hea d PT - 2 N W -1 .7 9 -1 0 -1 .1 9 -4 -2 .4 4 -6 .8 -2 .0 9 -6 .2 -1 .9 1 -5 .9 -1 .6 5 -5 .4 e Fact o r OV G 4. 91 -1 1. 7 4. 91 * 4. 91 * 4. 91 * 4. 91 * 4. 91 * e Fact o r R W 1. 22 -1 2. 5 1. 22 * 1. 22 * 1. 22 * 1. 22 * 1. 22 * Fact o r N est ed 0. 46 8 -9 .8 0. 46 8 * 0. 46 8 * 0. 46 8 * 0. 46 8 * 0. 46 8 * nd : ll-Time art-Tim e = N on-W o rk ing
6. The model application to the Belgian synthetic population
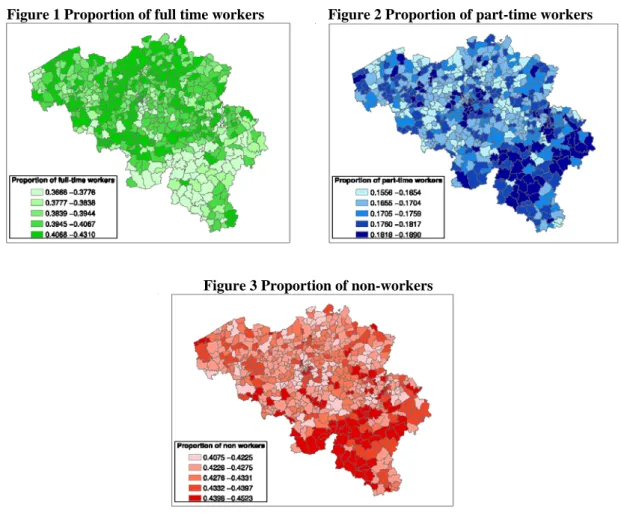
The model in Table 3 has been applied to a synthetic population, which is assumed to reproduce individuals and households in Belgium. The estimated model produces the probability that the members of a household (with given socio-economic characteristics) participate in the working activity on the observed day of the week, and in that case predicts the part of the population that is working part-time and the part that is working full-time. Results are reported with reference to their spatial and temporal characteristics. The spatial structure of working participation is given by the maps in Figures 1, 2 and 3. It is quite clear that the Northern part of the country (the Flemish Region) has the highest number of full time employments, while the Southern part (the Walloon Region) has vast zones with low proportion of full-time workers. Consequently, proportions of non-workers are relatively high especially in the South. It is well known that in Belgium early retirement is a big problem for the social welfare and that the measures adopted to retain people in the work force after their 50s have not been very successful. Labor force participation in 2001 was reported to be equal to 62.4 in Belgium (OECD, 2002); this official rate is completely coherent with the results obtained by our model. It is also interesting to observe that the percentage of part-time workers do not exceed 20% of the population. A study of the European Commission (Isusi and Corral, 2005) shows that the part-time employment as a percentage of total employment has increased in most industrialized countries from 1992 and 2002 and in particular that in Belgium the working population defined themselves as part-time worker was about 19% in 2002. This result together with the previous rate of total labor participation allows us to empirically validate our study.
Moreover, the Belgian rate of part-time workers is low when compared to the 43.8% registered in a close neighbor country, the Netherlands, in the same year. The increasing number of part-time contracts could result into a re-organization of daily patterns and task allocation amongst members of the household. The model proposed here, integrated into a large scale transportation model system, will be able to measure the impacts of changes in labor force participation on mobility.
In this Section we also analyze the differences in working participation rate among days of week. Travel demand models (both four step models and activity-based models) are developed for an average (week)day and that it is not possible to account for heterogeneity in travel behavior across different days of the week. Efforts to extend the current frameworks to study weekly (or longer period) mobility are under way. Labor participation rates with respect to days of week resulting from our model are presented in Figures 4, 5 and 6. Results are presented with respect to four municipality types: (1) urban area, (2) suburban area, (3) rural area and (4) migratory area. These four types of urbanization have been defined according to the classes used by INS (Institut National Statistique – Belgium, 19901).
Here we show that work participation rate, which strongly affects daily mobility, varies considerably across the days of week. In Figure 4 working participation rate is comparable on Mondays, Tuesday and Thursday, but it drops significantly (more than 10%) on Wednesdays; this difference is even bigger in rural and suburban areas (more than 15%). The explanation is quite straightforward, on Wednesday schools close at noon and parents working part-time tend to be off from work earlier than usual on that day. The percentage of full time workers drops again on Fridays to levels comparable to those registered on Wednesdays, although the differences between the four municipality types is almost nonexistent. The rate of part-timers reaches the lowest level on Mondays and its highest on Fridays, again Wednesdays represent a pick in the distribution. Variations in non-workers category are in the order of 3% with respect to the average value. We observe a negative peak on Thursday; however, no particular reasons can be adducted to explain that trend.
Figure 1 Proportion of full time workers Figure 2 Proportion of part-time workers
Figure 3 Proportion of non-workers
Figure 4 Deviation from weekly average of FT workers Figure 5 Deviation from weekly average of PT workers
Deviation from weekly average of the number of part-time workers (averaged on all municipalities)
0.7 0.8 0.9 1 1.1 1.2 1.3
Monday Tuesday Wednesday Thursday Friday
rural migratory suburbs urban
Figure 6 Deviation from weekly average of non workers
Deviation from weekly average of the number of non-workers (averaged on all municipalities)
0.85 0.9 0.95 1 1.05 1.1
Monday Tuesday Wednesday Thursday Friday
rural migratory suburbs urban
Deviation from weekly average of the number of full-time workers (averaged on all municipalities)
0.85 0.9 0.95 1 1.05 1.1
Monday Tuesday Wednesday Thursday Friday
rural migratory suburbs urban
7. Conclusions
In this paper we have generated a synthetic population for Belgium; the methodology adopted is able to combine different data sources (often inconsistent), to account for both individual and household characteristics and does not suffer from the problem of “zero cell value”. A weekly model of labor participation has been estimated under random utility maximization theory. Three datasets from both national and regional travel diaries have been combined in order to cover the entire country and to be able to estimate the model for each day of the week. A nested logit structure predicts not only labor participation across households’ members, but also full time and part time engagements.
Empirical results show that the model is able to distinguish differences in labor participation over geographical areas and demonstrate heterogeneity in working activity participation over days of week. In particular the Flanders region, notably the richest part of the country, has a higher number of full time jobs when compared to the Walloon region. At the national level, the model predicts about 60% of labor participation rate, of which about 20% are part-time jobs. These results are completely coherent with statistics officially published by the European Commission and do validate our methodology. Furthermore, a large proportion of part time workers are predicted on Wednesdays and Fridays; non workers rates are stable across days of week.
This paper contributes to the literature in travel demand modeling by providing empirical results on geographical and temporal heterogeneity of working activity participation, which is a skeletal component in activity based models and by connecting synthetic population and discrete choice models. Although the main interest of the authors is in transportation, this kind of framework can be useful in demography, social studies and labor economics.
The study in its actual form presents a number of limitations. The model in fact does not account for past history and future plans; the good results obtained with cross sectional data are encouraging and the framework proposed could be easily extended when multiday/week travel surveys will be available for Belgium. The model does not predict the duration of working activity; a discrete continuous framework (Bhat, 2005) can be adopted to further extend its forecasting capabilities. Finally the integration of labor participation models into an activity based model system will definitely assess the benefits of this kind of analysis in transportation planning.
Acknowledgments
We would like to thank Erik Nuyts from the Provinciale Hogeschool - Limburg for granting access to the OVG data and for assistance in data preparation.
References:
Arentze, T. and H. Timmermans (2007). A Dynamic Model for Generating Day, Multi-Person Activity Agendas: Approach and Illustration. Paper presented at the 86th Transportation Research Board conference, Washington DC, US.
Arentze, T., Ettema D. and H. Timmermans (2008). Estimating a model of dynamic activity generation based on one-day observations: methods and results. Paper presented at the 88th
Transportation Research Board conference, Washington DC, US.
Arentze, T., Timmermans H. and F. Hofman (2007). Creating Synthetic Household Populations: Problems and Approach. Paper presented at the 86th Transportation Research Board conference, Washington DC, US.
Barthelemy, J., Cornelis E., Jourquin B., Piotte J. and Toint Ph.(2010) Towards microsimulation of passenger and freight transport competition: Advances in synthetic population generation and simulation of the behaviour of freight actors, in Proceedings WCTR 2010 (electronic version)
Barthelemy, J. and Toint Ph. (2010). sBelgium: building a new synthetic population for Belgium, TRG, FUNDP-University of Namur, Belgium.
Beckman, R.J., Baggerly, K.A., and McKay, M.D., 1996. Creating synthetic baseline Populations. Transportation Research Part A, 30(6), 415-429.
Bhat, C. R. and S.K. Singh (2000). A comprehensive daily activity-travel generation model system for workers. Transportation Research A, 34, 1-22.
Bhat, C.R. (2005). A Multiple Discrete-Continuous Extreme Value Model: Formulation and Application to Discretionary Time-Use Decisions. Transportation Research Part B, Vol. 39, No. 8, pp. 679-707.
Bollé Patrick (1997) Part-time work: Solution or trap? International labor review Vol. 136(4) Bradley M. &. Daly A. (1991) Estimation of Logit Choice Models Using Mixed Stated Preference and Revealed Preference Information. 6th International Conference on Travel Behaviour. Quebec, Canada, 1991. In Understanding Travel Behaviour in an era of Change. (P. Stopher and M.Lee-Gosselin, eds). Elsevier Science Ltd, pp 209-232.
Cirillo, C. and K.W. Axhausen (2006). Dynamic model of activity type choice and scheduling. Paper presented at the European Transport Conference, Strasburg 18-20 September 2006.
Cirillo, C. and Philippe L. Toint (2001) An activity based approach to the Belgian national travel survey. Technical Report 2001/07, Transportation Research Group, Department of Mathematics, University of Namur.
European Foundation for the Improvement of Living and Working Conditions (2007) Part-time work in European companies Vol. VIII, 83 p. ISBN 92-897-0976-6
Guo, J.Y., and C.R. Bhat (2007). Population Synthesis for Microsimulating Travel Behavior," Transportation Research Record, Vol. 2014, pp. 92-101.
Habib, K.M.N. and E.J. Miller (2008) Modelling Daily Travel-Activity Program Generation Considering Within-Day and Day-to-Day Dynamics. Transportation 35, 487-848.
Hamed, M.M. and F.L. Mannering (1993). Modeling travelers’ postwork activity involvement: toward a new methodology. Transportation Science, 27(4), 381-394.
Hensher, D. and M. Bradley (1993). Using stated responses data to enrich revealed preference discrete choice models. Marketing letters 4, 39-152.
Hubert, J.-P., and P. L. Toint. La Mobilité Quotidienne des Belges. University of Namur, Belgium, 2002.
Isusi I. and A. Corral (2005). Part time work in Europe. European Foundation for the Improvement of Living and Working Conditions, 2003EF/04/41/EN.
OECD Economic Outlook (2002). Employment rates, participation rates and labor force -
by country. http://findarticles.com/p/articles/mi_m4456/is_2002_Dec/ai_98032787/
Pas, E.I. (1988) Weekly travel-activity behavior. Transportation 15, pp. 89-109.
Pritchard, D. R. and E. Miller (2008). Advances in Agent Population Synthesis and Application in an Integrated Land Use / Transportation Model. Paper presented at the 88th Transportation Research Board conference, Washington DC, US.