HAL Id: tel-03222414
https://tel.archives-ouvertes.fr/tel-03222414
Submitted on 10 May 2021
HAL is a multi-disciplinary open access archive for the deposit and dissemination of sci-entific research documents, whether they are pub-lished or not. The documents may come from teaching and research institutions in France or abroad, or from public or private research centers.
L’archive ouverte pluridisciplinaire HAL, est destinée au dépôt et à la diffusion de documents scientifiques de niveau recherche, publiés ou non, émanant des établissements d’enseignement et de recherche français ou étrangers, des laboratoires publics ou privés.
Raphael Cottin
To cite this version:
Raphael Cottin. Essays on health and poverty in Morocco. Economics and Finance. Université Paris sciences et lettres, 2019. English. �NNT : 2019PSLED003�. �tel-03222414�
Préparée à l’Université Paris-Dauphine
Essays on health and poverty in Morocco
Soutenue par
Raphael COTTIN
Ecole doctorale n° ED 543
Ecole doctorale de Dauphine
Spécialité
Economie
Composition du jury :
Elise HUILLERY
Professeur, Université Paris-Dauphine Président
Josselin THUILLIEZ
Chargé de recherche, CNRS Rapporteur
François-Charles WOLFF
Professeur, Université de Rennes Rapporteur
Aomar IBOURK
Professeur, Université Cadi Ayyad Examinateur
Philippe DE VREYER
Professeur, Université Paris-Dauphine Directeur de thèse
Christophe Jalil NORDMAN
Il faut savoir arrêter une thèse. Bien que le résultat soit, à de nombreux égards, bien loin de ce que j’envisageais initialement, je mets aujourd’hui un point final à ce processus de rédaction. Tout en gardant à l’esprit qu’il se muera bientôt en points de suspension lorsqu’il s’agira de soumettre pour publication ces chapitres à des revues scientifiques.
J’ai beaucoup appris au cours de ces années de thèse. Sur mon domaine de spécial-isation, la microéconomie empirique du développement; sur les enjeux des réformes de santé dans les pays en développement; sur la société marocaine et le fonctionnement de ses institutions; sur le processus de recherche universitaire; et enfin, sur moi-même, mes capacités et mes limites. Et bien que la responsabilité des manquements de ce travail n’incombe qu’à moi-même, il n’aurait jamais pu voir le jour sans l’aide et le soutien de nombreuses personnes, à qui je souhaiterais exprimer ma gratitude.
Mes directeurs de thèse, tout d’abord, Philippe De Vreyer et Christophe Jalil Nord-man, ont pris un risque en acceptant de me superviser, tout frais revenu du Maroc, avec un projet de thèse mal dégrossi et des sources de données encore hypothétiques. J’ai eu la chance de pouvoir compter sur leurs conseils et leur soutien lors de la phase de pré-paration du projet de thèse et en vue des auditions de l’Université Paris Dauphine. Par la suite, Philippe et Christophe se sont avérés être des mentors très complémentaires et de soutiens inestimables. Philippe a toujours été d’une aide précieuse de par son regard affuté et sa capacité impressionnante à détecter les failles, ainsi que les potentialités, des différents drafts que j’ai pu soumettre à sa lecture. Christophe a su me guider à chaque étape de mon travail, me poussant à raffiner mes questions de recherche et à orienter mon travail sans trop m’égarer sur des chemins de traverse. Tous les deux ont également joué un rôle de soutien important, de par leurs encouragements judicieusement dispensés dans des moments de doute. Pour cela, j’aimerais encore une fois leur témoigner ma reconnaissance.
Je tiens à remercier les deux rapporteurs de ma thèse, Josselin Thuilliez et François-Charles Wolff, d’avoir accepté cette tâche. Merci également aux suffragants, Elise Huillery et Aomar Ibourk, d’avoir accepté de participer à l’évaluation de mon travail. Je suis par-ticulièrement reconnaissant à Elise et François-Charles pour leur lecture attentive de mes
Grâce à (ou à cause de) un décret ministériel sur l’organisation des thèses, paru au milieu de la mienne, j’ai eu la chance de bénéficier d’un comité de suivi constitué de Véronique Gille et Marta Menendez, que je remercie pour leur disponibilité et pour leurs conseils bienveillants.
Ce travail a été préparé au sein du programme doctoral en économie de l’Université Paris-Dauphine, dirigé au moment de mon arrivée par Eve Caroli. C’est par son entrem-ise que j’ai pu faire la connaissance de Christophe et de Philippe. Je lui exprime ici encore une fois toute ma gratitude, tout d’abord pour m’avoir mis le pied à l’étrier, mais également pour tous ses efforts pour faire vivre ce programme doctoral, parfois contre vents et marées. Dans cette tâche, elle a été épaulée par d’incroyables représentants des doctorants au conseil de l’école doctorale: d’abord Geoffrey Lorre, puis Zied Chaker, Doriane Mignon et Leslie Bermont, qui n’ont pas économisé leurs efforts et à qui tous les doctorants doivent beaucoup.
Ce travail est une thèse “située”, en cela qu’elle porte sur un pays, le Maroc, qui m’intéressait beaucoup et continue à me fasciner. Ce choix, qui provient d’un chem-inement personnel, n’était cependant pas exempt d’embûches. Si j’en étais vaguement conscient en commençant la thèse, l’étendue des difficultés s’est avérée plus grande que prévue, ce qui a certainement eu un coût en termes de temps et d’efforts pour arriver à compléter ce travail. Mais d’un autre côté, cela m’a permis de découvrir une petite partie du fonctionnement des institutions de ce pays ; surtout, j’ai eu la chance de bénéficier de l’appui de nombreuses personnes qui ont, chacune à leur manière, contribué à mon avancement.
Les trois chapitres composant cette thèse ont été rédigés à partir de l’enquête Panel de Ménages de l’ONDH. A ce titre, j’adresse mes profonds remerciements au Secrétaire Général de cette organisation, M. El Hassan El Mansouri, d’avoir accepté de me laisser travailler sur ces données, alors même que rien ne l’y obligeait et que ce type de travail est très peu courant dans le contexte Marocain. Au cours de nombreux séjours de recherche à l’ONDH, j’ai pu observer comment cette jeune institution parvenait progressivement à s’imposer comme un acteur incontournable de l’évaluation des politiques publiques au Maroc. L’engagement personnel de M. El Mansouri y est certainement pour beaucoup. Sa passion et sa détermination à faire porter jusqu’au hautes sphères de l’Etat la voix des personnes défavorisées force l’admiration.
Au sein de l’ONDH, j’ai eu la chance de collaborer de manière rapprochée avec Iqbal Sayah et Maha Abdoun à l’occasion de la rédaction des différents rapports de synthèse sur le RAMED. J’ai beaucoup apprécié de travailler avec ces deux personnes ; qui sait,
peut-bar, Kawtar Zeroual, et Younes Jouilil, pour leur patience et leur aide précieuse, ainsi que leur bonne humeur.
Mais s’il y a une personne entre toutes à qui je dois tout, et sans qui cette thèse n’aurait jamais pu voir le jour, c’est bien Abdelkader Teto, le chef du pôle “Enquêtes et Méthodes” de l’ONDH. Arrivé de manière presque providentielle à l’ONDH à l’automne 2016, c’est lui qui s’est porté garant de ma probité pour travailler sur les enquêtes de l’ONDH de manière non supervisée. Au cours de nos nombreuses conversations, j’ai appris énormé-ment sur le Maroc et sur le métier de statisticien dans ce pays. Une personne à la fois serviable, dynamique, dotée d’une véritable conscience professionnelle, et d’une bonne humeur communicative, j’ai hâte de pouvoir continuer à travailler avec lui.
Au Maroc, j’ai également pu bénéficier de l’appui de deux représentants successifs de l’IRD, Benoît Lootvoet ainsi que Ghani Chehbouni. Merci également à Saïd Hanchane de m’avoir intégré dans son équipe pour l’évaluation du RAMED, et d’avoir fait le lien avec l’ONDH. M. Abbas El Mesnaoui était la cheville ouvrière de ce projet, ainsi que Jean-Noël Ferrié, que je remercie pour avoir accepter de partager avec moi les verbatim des enquêtes qualitatives effectuées avec son équipe.
Au jour le jour, mon environnement quotidien pendant la rédaction de cette thèse était le laboratoire DIAL, en son antenne de la rue d’Enghien. Là, j’ai pu croiser le chemin de nombreux chercheurs tous plus inspirants les uns que les autres, et au contact de qui j’ai beaucoup appris. Outre les personnes que j’ai déjà citées, il s’agit de Sandrine Mespé-Somps, Laure Pasquier-Doumer, Xavier Oudin, Camille Saint-Macary, Jean-Noël Senne, Mohammed Ali Marouani, Jean-Michel Wachsberger, Flore Gubert, Lisa Chauvet, Anne-Sophie Robillard, Florence Arestoff, Olivia Bertelli, Guillaume Daudin, Elodie Djemai, Najat El Mekkaoui, Hélène Lenoble, Marion Mercier, El Mouhoub Mouhoud, Marc Raf-finot, Anne Boring, Isabelle Chort, Catherine Bros, Charlotte Guesnard, Céline Bignebat. Il serait fastidieux de lister ici toutes les contributions de ces personnes, sous forme d’encouragements, de conseils, ou de suggestions, ou autres ; leur somme est cependant tout sauf négligeable!
DIAL, c’est également une équipe fort sympathique de doctorants, source à la fois d’inspiration et d’apprentissage. Je les liste ici par ordre de soutenance de thèse. Il y eut les “doyennes”, qui étaient sur le point de finir leur thèse à mon arrivée, et qui con-servent pour moi l’aura éblouissante de celles qui y sont parvenu: je veux parler d’Anda David, Maria Rhomari, Claire Zanuso et Estelle Koussoubé. Vint ensuite la génération du milieu, dont j’ai pu voir progresser les papiers, jusqu’à la soutenance : Jaime Ahcar, Vir-ginie Comblon, Esther Delesalle, Axel Demenet, Marine De Talancé, Marin Ferry, Sarah
cheval entre l’Afrique et l’Europe. Ma propre génération de doctorants fut un peu plus ré-duite: Oscar Barrera, Quynh Hoang, Anne Hilger, et mon collègue marocaniste Quentin Chapus, portant haut et fort les couleurs de la sociologie. Enfin, les “petits jeunes”, ar-rivés après moi mais déjà si prometteurs! Il s’agit de Leslie Bermont, du maître des paris sportifs Thomas Calvo, de Zied Chaker, Hamidou Diallo, Siyavash Eslami, Ana Horigoshi, Michelle Marshalian, Mahamat Moustapha, Arnold Njike, Yohan Renard, Linda Rua, et Thomas Thivillon. De par son lever de coude légendaire, Niri Razaka-manana mérite sa place dans cette liste, même s’il n’est pas statutairement thésard.
L’accueil à DIAL de stagiaires est toujours bienvenu, d’abord parce qu’il apporte un bol d’air par rapport aux thésards éternellement obsédés par leurs papiers, mais surtout parce qu’il est l’occasion de belles rencontres, comme celle de Barbara Adoléhoumé, sans qui j’aurais pris beaucoup moins de pauses, de Jeanne de Montalembert, Anaïs Clergeau, et Faly Rasamimanana, dont j’espère bien recroiser la route.
Enfin, l’équipe de DIAL ne serait pas complète sans mentionner Anne Legendre et Danielle Delmas, qui veillent au grain à ce que nos missions se passent bien, à ce que la maison soit bien tenue, les portes bien refermées, que le frigo soit d’une propreté acceptable, et surtout que nous soyons tous correctement approvisionnés en café. Une mention spéciale à Loïc Le Pezennec, compagnon de bureau dont la discrétion n’a d’égale que la gentillesse, et qui a supporté pendant trois ans mes horaires aléatoires et mon sens tout relatif du rangement de bureau.
Lors de mes premiers aller-retours à Rabat, j’ai pu bénéficier de l’appui logistique d’Alexis Befeno, Frédérick Bouin, et Mathilde Leclerc. A l’EGE, j’ai eu la chance de partager le bureau des fantastiques Loubna Lhachimi et Racha Lotfi, dont j’aurais telle-ment aimé suivre les cours d’Arabe - mais peut-être est-il encore temps pour cela. J’ai pris un grand plaisir à échanger avec mon ancien collègue Issame Kamal, dont j’admire le courage et l’engagement. Enfin, Olivier Deau a pu suivre de près toutes les étapes de mon projet de recherche, et me faire profiter à de nombreuses reprises de son entregent. Je ne sais pas si je pourrai un jour lui rendre la pareille, mais je suivrai ses travaux de recherche, qui débutent, avec attention.
Ces séjours au Maroc ont également été l’occasion pour moi de nouer des liens avec ma belle famille. Dès le premier jour, j’ai été accueilli comme un fils et un frère au sein de la famille Bouayaden. Layla, Hajar et Ilyès m’ont fait me sentir chez moi à Salé, entouré d’affection et de bonnes intentions. Les petites Maram et Ranim ont égayé mes dimanches; et j’ai éprouvé beaucoup de fierté à voir Soukaïna terminer brillamment son lycée et commencer ses études. Mais j’aimerais tout particulièrement remercier ma
mission qui, à en croire mon pèse-personne à chaque retour, a été couronnée de succès. choukran 3ala listi9bal wal karama. lqit 3ndek 7anan aloumm. ghadi atadakir min hadal waqt ma3an l7ayati kamila.
Je remercie mes amis d’avoir supporté mes hauts et mes bas pendant ces années de thèse: Christophe, Pascal, Mathilde, Typhaine, Julieta, Marc, Alice, Thomas, Cyril, Mélanie, Julia, Fabien, Josselin, Ariadna, Rowena, Benjamin, Samuel, Carolyn. Une pensée, à distance, pour Achraf, Souleymane, et Ahmed, qui ont beaucoup compté pour moi. Sans Pauline, je serais souvent sorti plus tard du bureau ; j’aurais également beau-coup moins ri, beaubeau-coup moins bu de bières, et beaubeau-coup moins écouté de musique.
Un grand merci à mes parents, Jérôme et Bettina, pour leur soutien sans faille à toutes les étapes de ce projet. En mettant à disposition son appartement de Saint-Denis, mon père a permis que je commence la thèse dans les meilleurs conditions. Mes sœurs Eva et Irène ont elles aussi mené à bien de nombreux projets pendant ces années. La gentillesse et les petites intentions d’Eva m’ont toujours mis du baume au cœur; et c’est toujours un plaisir d’échanger avec Irène sur la psychologie du travail. Enfin, un petit mot de remerciement à Mamilou pour sa bonne humeur et pour les bons moments passés à ses côtés, à la Bégude ou bien entre cousins à la Brasserie de la rue La Fontaine.
Le mot de la fin sera bien entendu pour Warda, dont le soutien n’a jamais failli, et sans qui je ne serai jamais venu à bout de ce travail. C’est dans une drôle d’aventure que nous nous sommes embarqués il y a cinq ans, un saut dans l’inconnu, pour elle encore plus que pour moi. Grâce à elle, malgré les hauts et les bas, ces années de thèse furent aussi, à ses côtés, de très belles années - wa hada lmouhim!.
1 Introduction: health, poverty, and social protection in Morocco 19
1.1 Introduction . . . 21
1.2 Health, poverty and social protection in the developing world . . . 22
1.2.1 An overview of the link between health and poverty . . . 22
1.2.2 Social protection in health : historical and political perspectives . 25 1.3 Morocco in the Middle East and North Africa region . . . 28
1.3.1 Similar dynamics with regards to demography, education, and the labor market . . . 28
1.3.2 Lower outcomes in health and poverty . . . 33
1.3.3 Social protection in Morocco and the MENA region . . . 35
1.4 Why a thesis on health and poverty in Morocco? . . . 39
1.4.1 The outcome of a personal journey . . . 39
1.4.2 The lack of applied microeconomic research on Morocco . . . . 40
1.4.3 Obstacles and their resolution . . . 43
1.5 Contribution of this thesis . . . 45
1.5.1 Dataset used in this thesis . . . 45
1.5.2 Summary of the chapters . . . 45
References . . . 48
Appendices . . . 55
1.A Additional figures . . . 55
1.B Additional table . . . 59
2 Free health care for the poor: a good way to achieve universal health cover-age? Evidence from the RAMED program 61 2.1 Introduction . . . 63
2.2 Country and policy context . . . 65
2.3 Relevant Literature . . . 70
2.4 Data and empirical strategy . . . 73
2.6 Descriptive statistics . . . 79
2.7 Results . . . 81
2.7.1 Affiliation to RAMED . . . 81
2.7.2 Consultation . . . 86
2.7.3 Health expenditures . . . 91
2.7.4 Covariate balance and common support . . . 93
2.8 Conclusion and discussion . . . 93
References . . . 98
Appendices . . . 103
2.A Targeting of RAMED . . . 103
2.B Additional figures . . . 111
2.C Additional tables . . . 113
3 Caring or coping? Labor market effects of illness in the household 119 3.1 Introduction . . . 121
3.2 Literature review . . . 122
3.3 Family labor response supply to severe health shocks and the value of health insurance . . . 127 3.4 Methodology . . . 129 3.4.1 Sample restriction . . . 129 3.4.2 Empirical specification . . . 130 3.5 Descriptive statistics . . . 132 3.6 Results . . . 138 3.6.1 Own illness . . . 138
3.6.2 Cross effects : illness of household head or spouse on children . . 142
3.6.3 Youth unemployment, inactivity, and head illness . . . 144
3.6.4 Other coping mechanisms . . . 145
3.7 Mechanisms and robustness . . . 147
3.7.1 Mechanisms: interaction with health insurance . . . 147
3.7.2 Different indicators of health shock . . . 149
3.7.3 Additional robustness tests . . . 152
3.8 Conclusion . . . 155
References . . . 157
Appendices . . . 163
4 The anatomy of poverty perceptions in Morocco : what is the role of local
comparisons? 171
4.1 Introduction . . . 172
4.2 Relevant literature . . . 174
4.3 Data and methodology . . . 177
4.3.1 Data . . . 177 4.3.2 Methodology . . . 177 4.4 Descriptive statistics . . . 180 4.5 Results . . . 183 4.5.1 Baseline results . . . 183 4.5.2 Comparison effects . . . 186
4.5.3 Channels: inequality, local public goods or social ties? . . . 189
4.6 Robustness : fixed effects ordered logit . . . 194
4.7 Conclusion and discussion . . . 197
References . . . 199
Appendices . . . 205
4.A Additional tables . . . 205
1.1 Urbanization, 1980-2017 . . . 29
1.2 Average per capita GDP growth, by sub-period . . . 34
1.3 Number of publications, by country and themes, 1990-2018 . . . 43
1.A.1Morocco: absolute poverty headcount . . . 55
1.A.2Dependency ratio and share of the elderly in the population . . . 56
1.A.3Youth unemployment rate . . . 56
1.A.4Enrollment rate in primary and secondary schooling . . . 57
1.A.5Morocco: tertiary education, gross enrollment rate . . . 57
1.A.6Spending of Health Ministry per inhabitant, by region, 2013 . . . 58
2.1 Consultation rates by consumption quintile, 2012 (source: ONDH) . . . . 67
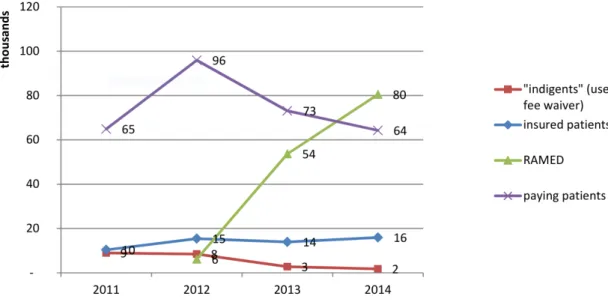
2.2 Fes University Hospital : number of patients by health coverage status, 2011-14 . . . 69
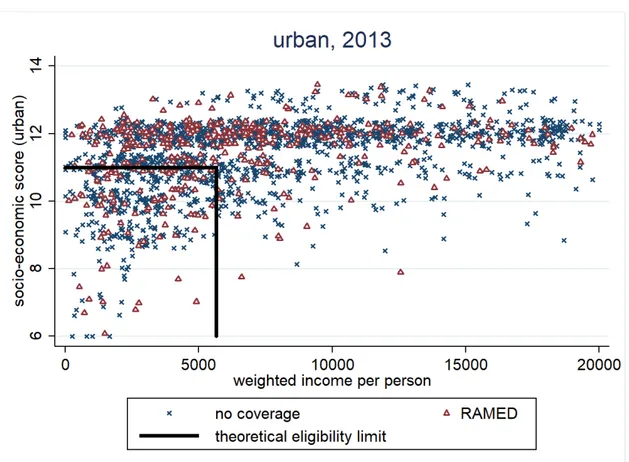
2.3 Affiliation to RAMED in 2013 by theoretical eligibility criteria, urban . . 78
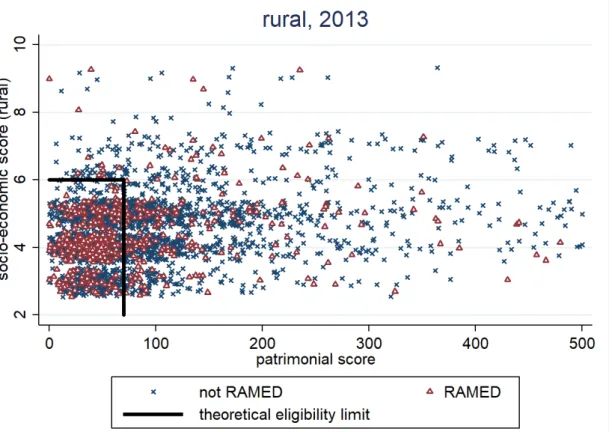
2.4 Affiliation to RAMED in 2013 by theoretical eligibility criteria, rural . . . 79
2.5 Consultation rates by year and coverage type . . . 80
2.A.1Ex-ante distribution of the socio-economic score in 2012, rural . . . 104
2.A.2Ex-ante distribution of the patrimonial score in 2012, rural . . . 105
2.A.3Affiliation to RAMED in 2015 by theoretical eligibility criteria, rural . . . 106
2.A.4Ex-ante distribution of the socio-economic score in 2012, urban . . . 108
2.A.5Ex-ante distribution of the criteria-weighted income per capita, urban . . 109
2.A.6Affiliation to RAMED in 2015 by theoretical eligibility criteria, urban . . 110
2.B.1 Consultation rates by year and coverage type . . . 111
2.B.2 Propensity score matching: common support at baseline . . . 112
3.1 Health as source of concern among households, by year and residency . . 123
3.2 household revenue and consumption per head, by illness of household head134 3.3 Labour force participation by illness of household head . . . 135
4.B.1 Transition probabilities between subjective poverty status, by residency (all years) . . . 210 4.B.2 Transition probabilities between subjective poverty status, by year
(na-tional) . . . 211 4.B.3 Empirical cumulative distribution of consumption per person, by
1.1 Health financing indicators, by income group and region (2016) . . . 24
1.2 Demography: selected indicators by groups of countries . . . 30
1.3 Labor market indicators, by groups of countries . . . 32
1.4 Literacy rates, by groups of countries . . . 32
1.5 absolute poverty rates at World Bank lines, by country . . . 35
1.6 Indicators of health outcomes, by groups of countries . . . 36
1.7 Indicators of health spending, by groups of countries . . . 36
1.8 Academic publications: 10 most frequent subjects, by country . . . 42
1.B.1 Keywords used for the construction of figure 1.3 . . . 59
2.1 national indicators on health and health care . . . 66
2.2 Panel structure . . . 74
2.3 Covariates, by residency and coverage status . . . 76
2.4 Outcome variables, by year . . . 81
2.5 Covariates, by residency and coverage status . . . 82
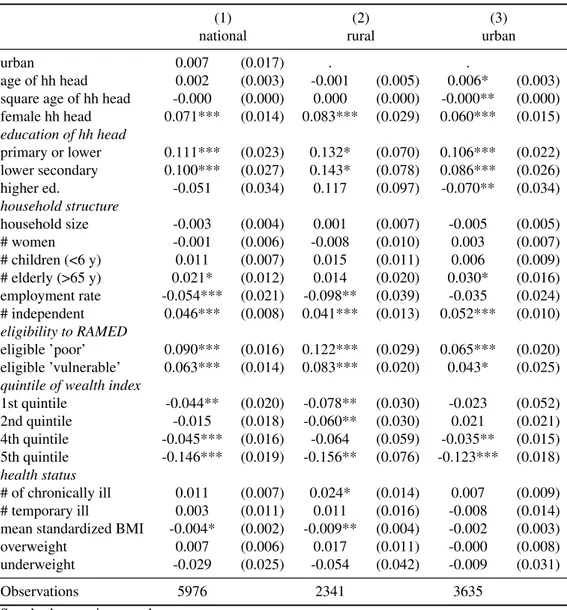
2.6 probit model of RAMED affiliation in 2013, by residency . . . 83
2.7 probit model of new RAMED affiliation in 2015, by residency . . . 85
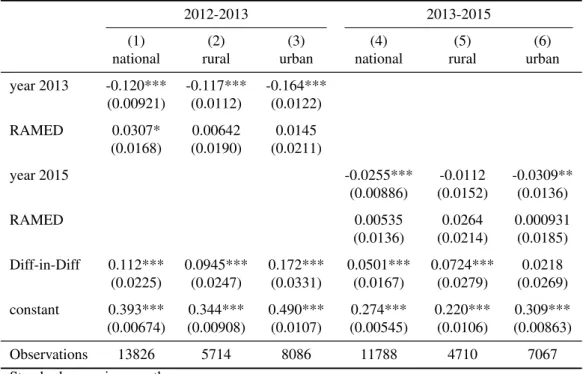
2.8 Matching Diff-in-Diff : consultation (0/1), by residency and time period . 87 2.9 Matching Diff-in-Diff : consultation by sector, 2012-2013 . . . 88
2.10 Matching Diff-in-Diff : consultation by sector, 2013-2015 . . . 89
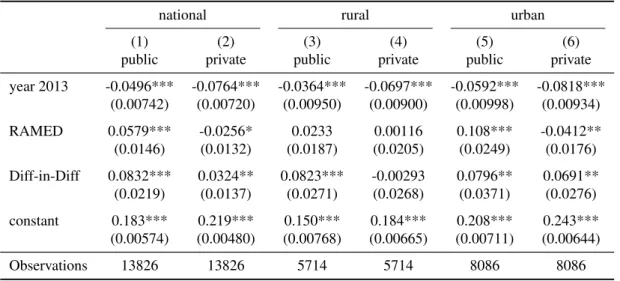
2.11 Matching Diff-in-Diff : consultation by type, 2012-2013 . . . 89
2.12 Matching Diff-in-Diff : consultation by type, 2013-2015 . . . 90
2.13 Matching Diff-in-Diff : Health expenditures, national . . . 92
2.14 Matching Diff-in-Diff : Health expenditures, 2012-2015, by residency . . 94
2.A.1Eligibility criteria for RAMED in rural areas: patrimonial score . . . 103
2.A.2Eligibility criteria for RAMED in rural areas: socio-economic score . . . 104
2.A.3Eligibility criteria for RAMED in urban areas: socio-economic score . . . 107
2.A.4Eligibility criteria for RAMED in urban areas: weights of self-declared income . . . 108
2.C.3 Diff-in-diff matching: consultation (0/1), 2012-15 . . . 115
2.C.4 Matching Diff-in-Diff : consultation by sector, 2012-2015 . . . 115
2.C.5 Matching Diff-in-Diff : consultation by type, 2012-2015 . . . 116
2.C.6 Matching Diff-in-Diff : Health expenditures, 2012-2013, by residency . . 117
2.C.7 Matching Diff-in-Diff : Health expenditures, 2013-2015, by residency . . 118
3.1 Structure of the data . . . 129
3.2 Summary of dependent variables, by gender and residency . . . 132
3.3 Illness by type and relation to household head, all waves . . . 133
3.4 Summary statistics of covariates, by residency . . . 136
3.5 Covariates by illness of household head, 2012 . . . 138
3.6 baseline specification (own illness), national . . . 139
3.7 own illness, by link to household head, fixed effects . . . 141
3.8 illness of household head, by gender, fixed effects . . . 143
3.9 illness of spouse, other household members, fixed effects . . . 144
3.10 unemployment and labour force participation of children, fixed effects . . 145
3.11 student, inactive, and housewife status of children, fixed effects . . . 146
3.12 coping mechanisms and illness of household head, all other members, fixed effects . . . 147
3.13 head illness, interaction with health insurance, all other members, fixed effects . . . 149
3.14 head illness, interaction with education of respondent . . . 150
3.15 Different illness indicators of household head, all other members, by gen-der, fixed effects . . . 151
3.16 Different illness indicators of spouse, all other members, by gender, fixed effects . . . 153
3.A.1Covariates by illness of household head, men, 2012 . . . 163
3.A.2Covariates by illness of household head, women, 2012 . . . 164
3.A.3baseline: own illness, fixed effect, by residency . . . 165
3.A.4illness of household head, different outcomes, fixed effects, by detailed illness status . . . 166
3.A.5detailed illness of spouse, other household members, fixed effects . . . . 167
3.A.6Robustness to bad controls . . . 167
3.A.7Fixed effects vs. first differences . . . 168
3.A.8Fixed effects vs. first differences . . . 168
3.A.10Test of strict exogeneity of spouse illness . . . 169
3.A.11Multiple comparison test based on interaction model . . . 169
4.1 Subjective poverty by residency (all years) . . . 180
4.2 Subjective poverty by year (national) . . . 181
4.3 Household characteristics, by subjective poverty . . . 183
4.4 perceived poverty : baseline results . . . 184
4.5 Relative income effects on perceived poverty, overall . . . 187
4.6 Reference consumption based on the median of the comparison group . . 188
4.7 comparison effect: interaction models . . . 190
4.8 Channels: local public goods . . . 191
4.9 Channel : social capital . . . 193
4.10 Channels : local inequality . . . 195
4.11 Fixed effect ordered logit estimations . . . 196
4.A.1Reference income based on the mean of the comparison groups . . . 205
4.A.2Determinants of subjective poverty: work and health . . . 206
4.A.3Transition matrices by residency and time period . . . 207
4.A.4Reference consumption based on the mean of the comparison group . . . 208
4.A.5Channels : inequality, by area . . . 208
Introduction: health, poverty, and
social protection in Morocco
Contents
1.1 Introduction . . . 21
1.2 Health, poverty and social protection in the developing world . . 22
1.2.1 An overview of the link between health and poverty . . . 22
1.2.2 Social protection in health : historical and political perspectives 25 1.3 Morocco in the Middle East and North Africa region . . . 28
1.3.1 Similar dynamics with regards to demography, education, and the labor market . . . 28
1.3.2 Lower outcomes in health and poverty . . . 33
1.3.3 Social protection in Morocco and the MENA region . . . 35
1.4 Why a thesis on health and poverty in Morocco? . . . 39
1.4.1 The outcome of a personal journey . . . 39
1.4.2 The lack of applied microeconomic research on Morocco . . 40
1.4.3 Obstacles and their resolution . . . 43
1.5 Contribution of this thesis . . . 45
1.5.1 Dataset used in this thesis . . . 45
1.5.2 Summary of the chapters . . . 45
References . . . 48
Appendices . . . 55
1.1
Introduction
One of the many paradoxes of the globalization age is that extreme poverty is no longer exclusively a poor country phenomenon. In a recent article, Lucy Page and Rohini Pande note that while in 1987, “90 % of the world’s poor lived in low-income countries... by 2013, over 60% percent of the world’s poor lived in middle-income counties”, in partic-ular in “high poverty middle-income countries” such as India, Nigeria, China, Indonesia, the Philippines, South Africa (Page and Pande, 2018).
This distinction matters, because the challenge of reducing poverty is of a different nature in those two groups of countries. While in low-income setting, alleviating poverty is likely to rely mainly on direct transfers of resources, in the form of cash or in nature, financed in great part through foreign aid, Page and Pande argue that money will not be enough to eradicate poverty in middle-income country. Such a task will need a comple-mentary focus on “invisible infrastructure”, or “the social and human systems that enable citizens to realize their capabilities and escape poverty” (Page and Pande, 2018, p. 176). One prominent example of this “invisible infrastructure” is health care. The global health community has recently given a lot of importance on the goal of Universal Health Coverage, or UHC, the process of extending the existing social arrangements regarding health care coverage in three directions : towards the greatest amount of health goods and services covered, for the greatest number of people, and for the greatest proportion of the expenditures incurred by the patients (Schmidt, Gostin, and Emanuel, 2015). A 2012 special edition of the Lancet christened that the move towards UHC “the third global health transition” (after the demographic and the epidemiological transition) (Rodin and de Ferranti, 2012), while The Economist magazine considered UHC “an affordable ne-cessity”. The “necessity” part is easy to understand: health is a basic component of every conceivable conception of a good life, and everybody faces shocks and setback during their lifetime (Ortiz, 2018). The view that such a necessity is “affordable” comes from calculation such as the one by Chichon (2018), purporting to show that nearly all coun-tries could close most of their health gap at a “manageable” cost for public finances (i.e., 5% of GDP).
Whatever one thinks of such calculations, they point to the fact that extending health coverage is about more than money. The most important question is not whether or not to extend health coverage, but how to achieve it. There is no one-size-fits all template, and different countries have followed different strategies; hence the importance of examining in detail specific country experiences.
This thesis consists in three essays that look at the various aspects of the interplay between health, poverty, and health care, in the case of Morocco. The issue of health is
somewhat understudied from an economic point of view in North Africa, and singularly in the case of Morocco (see infra, 1.4.2); yet, several characteristics of these countries make the examination of these issues particularly relevant. Maghreb countries belong to the World Bank’s “Middle Income” classification; contrary to other countries in this category, for instance South Asian countries, they have followed a development path that relied more heavily on state intervention (Richards and Waterbury, 2008). The demogra-phy and the labor markets of these countries also share similarities, such as the relatively high share of the urban population relying on government jobs, a structurally high youth unemployment rate despite increasing education levels (Campante and Chor, 2012) and a low female labor force participation (Gaddis and Klasen, 2014; Rauch and Kostyshak, 2009).
This introductory chapters gives background information on the specific issues ad-dressed by this dissertation. It presents in a piecemeal manner several points that do not bear directly on the understanding of the chapters, but that may complement the specific points developed in the rest of the chapters. Section 1.2 gives an broad overview at the link between health, healthcare and poverty, as well as some historical perspectives on the development of social protection. Section 1.3 presents some stylized facts on the eco-nomic and social environment of Morocco and the Middle East and North Africa region. Section 1.4 presents the motivation for this thesis, personal as well as scientific. Finally, section 1.5 summarizes the contributions made by this dissertation.
1.2
Health, poverty and social protection in the
de-veloping world
1.2.1
An overview of the link between health and poverty
The double link between income and health In the developing world, health and poverty are inextricably linked. Health is important both intrinsically, as a basic component of human well-being, as well as a precondition for the enjoyment of other goods and services (Sen, 2002). But health is also relevant in an instrumental sense, as a determinant of living standards (Berthélemy and Thuilliez, 2013).At the household level, the link between health and poverty runs through various channels. Health shocks are a source of risk for the livelihood of households, as illness can prevent individuals from working. But the reverse mechanism exists as well: being poor is associated with worse health indicators (Cutler, Deaton, and Lleras-Muney, 2006; Lleras-Muney, 2018; Smith, 1999). In the context of low income countries, nutrition has been put forward as one of the main channels through which poverty leads to worse
health, thus creating a self-reinforcing mechanism (Strauss and Thomas, 1998), although it is still a matter of debate whether or not such linkages can create economy-wide poverty traps (Bloom and Canning, 2000; Kraay and McKenzie, 2014).
Additionally, health is linked to poverty through medical expenses. Since formal health insurance is rare, health expenditures can reach important proportions of house-hold’s incomes. These “catastrophic health expenditures” are widespread in places where direct payments constitute the primary source of healthcare financing (Xu et al., 2003). One implication is that poverty indicators may be underestimated in those countries, as important health payments contribute to exacerbate poverty (Van Doorslaer et al., 2006)
The dual link between health and poverty is often observed at the level of the house-hold or the individual; yet, both health and poverty depend of factors that are outside of the household’s control, such as epidemics, droughts or other climate events (Der-con, 2002). Similarly, some of the inputs in the health production function are public goods, like sanitation infrastructure, health care supply, or parasite eradication campaigns (Bleakley, 2007; Cutler and Miller, 2005). Thus, the health-poverty nexus has inevitably a social and political dimension.
The evolution of global health in the past 50 years provides some ground for opti-mism. Life expectancy has progressed globally, through the combined effect of economic development as well as through medical innovation (Deaton, 2013). Since the year 2000, official development aid linked to health as increased (Berthélemy and Thuilliez, 2013; Moatti and Ventelou, 2009). New financing initiatives and vertical programs such as GAVI and the Global Fund have led to a renewed reduction in infant mortality across the globe.
New challenges for developing countries health systems Economic devel-opment brings a new set of issues to the fore. A number of developing countries are currently experiencing at a faster pace the demographic and epidemiological transitions that took centuries to unfold in developed countries. While these evolutions are signs of progress, they also make new demands on health systems, which have to deal with the prospects of population ageing as well as the increased prevalence of chronic disease (Riley, 2005).
On top of these demands, countries growing out of low-income status have to rely to a greater extent domestic financing for their healthcare systems (Mills and Hsu, 2014). Table 1.1 displays indicators of the structure of health financing across country income groups for the year 2016. In low incomes countries (LICs), external support represents on average 29% of current health expenditure (CHE). This amount is reduced to 11% of CHE for lower middle income countries (LMICs), and to 5% of CHE for upper middle
Table 1.1 – Health financing indicators, by income group and region (2016) Current health expenditure per capita (PPP) Current health expenditure (% GDP) External health expenditure (% CHE) General government health expenditure (% CHE) Private health expenditure (% CHE) Out-of-pocket expenditure (% CHE) Income group LIC 105 6.4 28.5 25.6 46 39.6 LMIC 335 5.6 11.3 42.7 46 40.8 UMIC 983 6.8 5 57.5 38 30.7 HIC 3432 7.8 0.7 71.3 28.3 21.6 Regional Grouping Africa 290 5.8 21 36.1 42.9 34.8 Americas 1386 7.1 2.5 57 40.6 32.3 Eastern Mediterranean 1431 5.3 3.5 51.7 44.8 38.9
Europe and Central Asia 2731 7.9 0.9 63.9 35.6 31.5
South-East Asia 431 4.6 6.5 45 48.5 41.4
Western Pacific 1221 7.3 17.4 59.2 25.3 19.6
Source: WHO, Global Health Expenditure database. LIC : Low Income Countries; LMIC : Lower Middle Income Countries; UMIC : Upper Middle Income Countries; HIC : High Income Countries note: regional groupings follow the WHO classification and may differ with the World Bank classification used in part 1.3.2
income countries (UMICs).
Another source of variation in health financing is the extent to which countries rely on direct payments, or out-of-pocket (OOP) expenditures . In LICs and LMICs, this source of financing represents around 40% of CHE. This share drops to 31% of CHE in UMICs, and 22% of CHE in HICs.
Direct payments are only one part of private health expenditure. Pre-payment mech-anisms, such as social health insurance, can be an important component of health fi-nancing. But, as the difference between column 5 and 6 of table 1.1 makes clear, these represent only a small amount of health expenditure in LICs and LMICs (between 5% and 6% of CHE). Yet cross-country comparison show that the share of health expen-diture that is financed through prepayment mechanism is correlated negatively with the prevalence of catastrophic health expenditures (Xu et al., 2007).
Universal Health Coverage in developing countries As the bottom panel from table 1.1 shows, there is a high degree of variability in the structure of health care fi-nancing, even among developing countries. The extension of social protection in health is currently enjoying a renewed interest across the developing world. According to the The World Bank’s State of Social Safety Nets Report (World Bank, 2018a), the amount spent on safety nets and social assistance programs has increased globally since the year 2000, both in absolute amounts as well as in proportion of GDP. The goal of “Universal Health Coverage” (UHC) has been explicitly adopted by all main international
organiza-tions. A number of low and middle income countries (most notably Rwanda, Vietnam, the Philippines) have made significant progress towards this goal by increasing coverage rates as well as decreasing the burden of out-of-pocket expenditures. These countries use a variety of different approaches that do not lend themselves to classification according to traditional typologies; yet some common patterns emerge. According to Lagomarsino et al. (2012), the countries that have succeeded in bringing down OOP expenditures have usually started by increasing their public health budget; they rely on part on increased enrollment in government health insurance, together with subsidized adhesion for low-income households; finally, they all put in place a third-party buying agency in order to strengthen demand-based financing.
Other countries have chosen a different approach to UHC, by reversing the previously dominant policy of user fees and providing free health care at the point of service. The precise modalities regarding coverage or the of health services provided free of charge vary across countries. Such an approach has proven popular in parts of West Africa and Central Africa (Lépine, Lagarde, and Le Nestour, 2018; Olivier de Sardan and Ridde, 2012); Morocco is another example of a country that has chosen broad-based fee exemp-tions through its RAMED system, which is the subject of chapter 2.
What can account for the different strategies chosen by low and middle income coun-tries to expand health coverage? Although a certain level of economic development as well as fiscal capacity appear to be a necessary precondition, political aspects are paramount, as noted by Savedoff et al. (2012). Therefore, before turning our attention to the Middle East and North Africa region, we review briefly the various social, economic and political factors that have been examined in the literature.
1.2.2
Social protection in health : historical and political
per-spectives
In industrialized economies, the welfare state performs a varieties of functions. It con-tributes to the correction of market failures, reduces inequalities, and plays a role in macroeconomic stabilization (Barr, 1992). But how did this combination of social insur-ance, assistance and public provision that we call the welfare state come to be? What are the force that drive the construction of social systems? This line of questioning is interesting from the point of view of Middle Income Countries that find themselves in a “middle of the road” position, with a modicum of fiscal space but limited state capac-ity (Banerjee, Niehaus, and Suri, 2019). In this section, we briefly review the political science and economics literature on the determinant of social programs expansion.
explain the expansion of social programs in 19th century Europe. Lindert (2014), in his history of social spending, argues that some social programs, in particular universal education and poor relief, could have been implemented much sooner than they have; in Great Britain, France, and the US, it is only after the electoral franchise was extended that the share of national income devoted to these areas began growing to significant amounts as a share of GDP1. Such a mechanism might by at play in contemporary developing countries. Carbone and Pellegata (2017), using data on leadership change in Africa since the early 1990s, find evidence that elected leadership, especially in the context of multi-party elections, leads to higher social spending. Kim (2007), using a historical data from 1880 to 1950 Europe, shows that the extension of the franchise, combined with the intensity of workers strike, correlates with the percentage of the population covered by social insurance. This result is interpreted as evidence in favor of the democratic determinant of social protection, via the “threat of revolution mechanism” put forward by Acemoglu and Robinson (2005).
The hypothesis that democratization is the driving force behind social protection is at odds with some historical examples where social programs were put in place by au-thoritarian regimes. The most prominent example is late 19th century Germany, where chancellor Bismarck put in place a far-reaching system of social insurances in order to co-opt the worker movement (Bärnighausen and Sauerborn, 2002). Another example of this kind of authoritarian leadership is the Singapore health care system, put in place by Prime Minister Lee Kuan Yew (Haseltine, 2013). Kim and Gandhi (2010) find evidence of such a mechanism of worker co-optation in a database of dictatorships covering the second half of the 20th century. One interesting finding is that the precise form of the social programs put in place by authoritarian regimes differs from the ones that proceed from democratic deliberation: based on a database of 140 countries since the end of the 19th century, Knutsen and Rasmussen (2018) find that while autocratic regimes are no less likely to put in place old-age pensions than democratic regimes, their systems have lower coverage and are more often targeted towards specific groups. Social programs can be used by autocratic regimes to redistribute rents to key support groups, as well as solve the “credible commitment to redistribution” problem (Acemoglu and Robinson, 2005).
A third explanation is that the welfare state is linked to the development of the market economy itself. According to Polanyi’s “double movement” hypothesis (Polanyi, 1944), the process of “commoditization” of goods that were previously embedded in social re-lations leads to a counter-movement that aims at removing those goods from the grip of the market. A modern variation on this theory is Rodrik (1998), who shows that there is
1This stylized view of history is consistent with the classical political economy view of Meltzer and
Richard (1981), where a greated degree of inequality leads to increased redistribution trough electoral competition.
a robust statistical association between one country’s exposure to trade and capital flows on the one hand and the size of the government on the other hand. Rodrik’s interpretation is that globalization, while increasing average incomes, also increases their dispersion, and constitutes a source of risk; in return, exposed workers demand an increased protec-tion from their government. Note that this hypothesis is debated among global political economy scholars that often view globalization as a catalyst for a “race to the bottom” in social protections, particularly among developing countries (Meinhard and Potrafke, 2012; Rudra, 2002).
Beyond structural explanations, historical dynamics as well as cultural factors may play an important role in explaining why the welfare states of various countries look the way that they do. For many developing countries, the relation to European imperialism in the 19th century plays a big role. Schmitt (2015), based on data from 91 former British, French and Spanish colonies from 1820 to the present time, finds that the identity of the colonizing nation matters for the current form of the social protection system. In former British colonies, the introduction of work injury legislation was historically conditioned on the level of fiscal revenue, on the basis of the colonial ideology that colonies should be able to “pay for themselves”. By contrast, in the French colonial empire, the introduction of social security provisions appeared simultaneously in all countries, probably reflecting the more “constructivist” view of the French. We revisit the issue of the colonial heritage in section 1.3.3.
More remote historical factors may matter as well. Kuran (2018) argues that the Arab conquest of the 7th and 8th century have had a lasting impact on trust in islamic societies, through the specific institutions of the waqf and the islamic rules of heritage, preventing the formation of impersonal institutions such as the modern corporation or social protection. Finally, Alesina, Glaeser, and Sacerdote (2001) argue that social and ethnic fragmentation can prevent the expansion of social protection. The fact that social transfers would statistically benefit more to group that are perceived as “other” renders those transfers unappealing to many voters.
Each of this explanations might have some degree of validity to explain the shape of social systems in the Middle East and North Africa region, and for Morocco. We now turn to an overview of the main economic and social characteristics of this region.
1.3
Morocco in the Middle East and North Africa
region
Due to historical and cultural factors, the Middle East and North Africa region is often perceived as a geographical unity2. The shared experience of the 7th and 8th century
Arab conquest has left a lasting cultural imprint, materialized by the use of the Arabic language and sunni Islam as a majority religion (Lewis, 2002).
There is indeed a degree of convergence in demography, education and labor markets across countries of the MENA region (Campante and Chor, 2012; Yousef, 2004), as well in the delivery of public goods and the organization of social systems (Alami, 2017). That the societies themselves perceive themselves as being part of the same cultural ensemble was demonstrated by the contagion of the “Arab spring” protests across countries in 2011 (Malik and Awadallah, 2013).
Yet cultural and linguistic unity does not imply homogeneity. Significant differences exist within the MENA region, the most structuring one being the opposition between oil-producing countries and others (Rauch and Kostyshak, 2009). But the countries also differ in the relation they had with European imperialism in the 19th century, and whether they have formally been part of the Ottoman Empire before that. The political regimes are diverse, going from military one-party states to constitutional monarchies (Richards and Waterbury, 2008).
The goal of this section is to position Morocco in its regional context, by highlighting similarities as well as factors that differentiate the country from its neighbors. We struc-ture our discussion around two sections: while Morocco resembles the rest of the region with respect to demography, labor market, and education (1.3.1), its health outcomes as well as poverty and inequality indicators lie below the regional average (1.3.2). In sub-section 1.3.3 we provide an overview of common characteristics of the social systems of MENA countries, as well as highlighting the singularity of the Moroccan case.
1.3.1
Similar dynamics with regards to demography,
educa-tion, and the labor market
The countries of the Middle East and North Africa region have experienced similar mographic dynamics: they have urbanized rapidly, and are currently ending their
de-2across this chapter, as well as in the rest of this thesis, “Middle-East and North Africa” is composed
of the following countries: Morocco, Algeria, Tunisia, Libya, Egypt, Jordan, Lebanon, Syria, Palestinian territories, Iraq, Saudi Arabia, United Arab Emirates, Oman, Qatar, Bahrein, Kuweit; it excluded Iran, Turkey, Israel, Mauritania, Sudan, and Djibouti, that are sometimes included in the region). When nec-essary, we exclude either the ensemble of Gulf Countries or High-Income countries (i.e. Gulf countries minus Yemen and Oman)
mographic transition. Their populations are young, although concerns about aging are surfacing. All the countries in the region are plagued by high youth unemployment and low female labor force participation, and Morocco is no exception.
Population and demography
Figure 1.1 – Urbanization, 1980-2017
source: World Bank WDI
In the last 50 years, MENA countries have undergone a rapid urbanization (figure 1.1). However, together with Egypt, Morocco retains one of the highest share of the pop-ulation living in rural areas: 38% as of 2017. While the urbanization rate was similar to Algeria at the beginning of the 1980s, at approximately 40%, today it lies 10 percentage points below its neighbor, and far below the levels reached in Jordan and Lebanon. This relatively high share of rural population has repercussion on access to health infrastruc-ture (cf. part 1.3.2).
Table 1.2 contrasts demographic indicators in Morocco with the MENA averages. Morocco, and the MENA region, have low total fertility rates, at respectively 2.5 and 2.8 births per woman. This indicator has experienced a sharp fall during the 1980s and 1990s: in 1980, the average number of birth per woman was close to 6 (5.7 in Morocco, and 6.2 in the MENA region). The wanted fertility rate in Morocco is now below the
Table 1.2 – Demography: selected indicators by groups of countries
LIC MENA MIC MAR year fertility
Fertility rate, total (births per woman) 4.6 2.8 2.3 2.5 2016 Wanted fertility rate (births per woman) 4.3 1,8a 2013
Contraceptive prevalence, any methods (%) 34.2 61.4 65.1 67,4b 2014 Contraceptive prevalence, modern methods (%) 29.6 50.6 49.7 58,6b 2014 population structure by age
Age dependency ratio (% of working-age population) 84.5 58.2 50.7 51.9 2017 Age dependency ratio, old (% of working-age population) 6.2 8.1 11.1 10.3 2017 Age dependency ratio, young (% of working-age population) 77.2 49.2 38.7 41.6 2017 Population ages 0-14 (% of total) 42.1 31.3 25.8 27.4 2017 Population ages 15-64 (% of total) 54.5 63.6 66.7 65.8 2017 Population ages 65 and above (% of total) 3.4 5.1 7.4 6.8 2017
Source: World Bank WDI.
LIC: Low Income Countries; MENA : Middle East and North Africa (excl. high income); MIC : Middle Income Countries; MOR : Morocco ayear: 2004 byear: 2011
natural replacement rate, at 1.8 child per woman. Modern contraceptive use is high in comparison to middle and low income countries: 58.6% of women use them, compared to 49.7% in middle income countries. As always, these country averages mask important differences between urban and rural areas.
The decline in fertility reflects profound changes that the societies of the southern border of the Mediterranean have undergone in the past 30 years, such as the postpone-ment of the average age at the first marriage, and increase in divorce rates (Boudarbat and Ajbilou, 2007). Economic determinants, such as the high youth unemployment, are of course part of the phenomenon; the entry into adult life, defined by the formation of a household of one’s own, is complicated by lack of access to quality jobs and housing (1.3.1)
MENA countries have completed their demographic transition, with low mortality and fertility rates. This translates in a population structure that is characterized by a high share of working-age individuals and low dependency ratios (cf. appendix figure 1.A.2). However, in Morocco, the share of the elderly in the population has already started to increase (from 5% in 2000 to 6.8% today), and the dependency ratio is predicted to rise in the next 20 years (Bertho et al., 2017). Moreover, high unemployment rates for the youth and low female labor force participation imply that the region is not enjoying the benefits of the demographic dividend to its full extent (Dhillon and Yousef, 2011).
Labor Market
Everywhere in the MENA region, the labor market is characterized by the exclusion of the youth and low female labor force participation. In Morocco and the MENA region, female labor force participation rate are respectively of 26.8 and 20 % of the working age population; by contrast, across middle-income countries, the average rate is 50% (1.3). In the region, youth unemployment represents lies at 27% of the labor force, against 14% in middle income countries. In Morocco, the youth unemployment rate is slightly lower, at 18%; youth unemployment has come down since the peak of the 1990s, when it stood upwards of than 25%, but it has been stagnating at current levels since the mid-2000s (see figure 1.A.3 in the appendix).
Youth unemployment The unemployment estimates of the ILO do not provide an accurate picture of the extent of youth exclusion. The distinction between “unemployed” and “inactive” is fuzzy, due to the absence of formal unemployment insurance mech-anisms. For instance, in Morocco, there is more movement between employment and inactivity than there is between employment and unemployment (Verme et al., 2016). Statistics on the precise numbers of young not in employment, education or training (NEET) are hard to come by, but separate studies suggest that they are at least as numer-ous as the unemployed (Banque Mondiale, 2012).
High youth unemployment has persisted despite rising education levels. In Morocco, post-secondary education has increased quickly over the past 16 years, reaching 30% of the relevant age group in 2015 (cf. figure 1.A.5 in appendix). The gap between men and women in tertiary education has disappeared and more women than men graduate from university each year (Bougroum and Ibourk, 2011). Primary education, which had long been lagging behind, was the object of large public investments in the 2000s; primary education is now universal, even in remote rural areas. Yet the literacy remains low in international comparison (table 1.4), as do the enrollment rate in secondary education (see figure 1.A.4 in appendix).
Although young university graduates have the highest unemployment rates in the population, this does not imply that the higher-educated are the most disadvantaged on the labor market (Banque Mondiale et HCP, 2017; El Aynaoui and Ibourk, 2018). It is not clear to what extent this high unemployment of graduates is attributable to a lack of labor demand, due for instance to insufficient competition in goods and services markets or to rigid hiring and firing rules (Agénor and El Aynaoui, 2005; Tzannatos, Diwan, and Ahad, 2016), and to what extent they are attributable to supply-side factors, such as the mismatch between skills acquired in training and those demanded on the labor market, or to queuing for public sector jobs (Chauffour, 2012).
Table 1.3 – Labor market indicators, by groups of countries
LIC MENA MIC MOR year Labor force participation, female (% of pop. 15-64) 66.6 20.0 50.0 26.8 2017 Labor force participation, male (% of pop. 15-64) 81.3 75.7 80.7 78.8 2017 Labor force, female (% of labor force) 45.5 20.6 37.4 26.1 2017 Employment to population ratio, 15+, female (%) 60.7 16.8 43.3 22.5 2017 Employment to population ratio, 15+, male (%) 76.1 67.9 72.5 67.4 2017 Employment to population ratio, 15+, total (%) 68.3 43.4 58.0 44.4 2017 Unemployment, total (% of labor force) 5.7 11.9 5.4 9.3 2017 Youtn unemployment, total (% of labor force 15-24) 10.9 27.0 13.7 18.0 2017 Self-employed, total (% of total employment) 77.1 31.5 49.6 53.7 2017 Vulnerable employment, total (% of total employment) 75.0 26.2 46.5 50.7 2017 Wage and salaried workers, total (% of total employment) 22.9 68.5 50.4 46.3 2017 Source: modeled ILO estimates, World Bank WDI. LIC: Low Income Countries; MENA : Middle East and North Africa ; MIC : Middle Income Countries; MOR : Morocco
Table 1.4 – Literacy rates, by groups of countries
LIC MEA MIC MOR year Literacy rate, adult female (% of females ages 15 and above) 52.8 72.6 81.6 59.1a 2016
Literacy rate, adult male (% of males ages 15 and above) 68.6 86.2 89.6 80.4a 2016
Literacy rate, adult total (% of people ages 15 and above) 60.6 79.6 85.6 69.4a 2016
Literacy rate, youth female (% of females ages 15-24) 69.2 88.5 91.5 87.8a 2016
Literacy rate, youth male (% of males ages 15-24) 76.6 93.0 94.0 94.6a 2016 Literacy rate, youth total (% of people ages 15-24) 72.9 90.8 92.8 91.2a 2016 Source: World Bank WDI. LIC: Low Income Countries; MENA : Middle East and North Africa ; MIC : Middle Income Countries; MOR : Morocco ayear: 2012
The first of these explanation refers to the fact that a high percentage of high school graduates are oriented towards non-technical studies in university (Bougroum and Ibourk, 2011), a tendency aggravated in the case of Morocco by the linguistic policy3. The
sec-ond explanation holds that young graduates unemployment principally reflects queuing phenomena for public sector jobs. The difference in amenities between the public and the private sector is such that a lot of university graduates prefer public sector employment, event at the price of a steep discount on their wages (Banque Mondiale, 2012). Anecdo-tal evidence for this phenomenon can be found in the fact that an organized movements of the “unemployed university graduates” (diplômés chômeurs) exists, that lobbies since the end of the 1980s for direct recruitment in the administration (Emperador Badimon, 2011).
Low female labor force participation The other common characteristic of Middle East and North African societies is the low level of female employment, which compares
3While the teaching in public schools is done in Arabic, at university level the system switches to
negatively to countries with similar level of economic development outside of the region. Female employment has remained flat over the past three decades, despite rising educa-tion levels and falling fertility. As noted by Karshenas, Moghadam, and Alami (2014), the lack of women on the labor market comes mainly from the middle of the skills and education distribution. while employment rates are (relatively) high at graduate level as well as for uneducated women, women in MENA countries are less present in mid-level positions and occupations.
Given that no obvious economic feature seems to account for low female labor force participation levels, one widespread view is widespread that this is due to cultural fac-tors, in particular strict gender roles in patriarchal societies, where the woman is pre-dominantly seen as the “keeper of the household”, and a “wife and mother” first. Using the World Values Survey polls, Diwan, Tzannatos, and Akin (2018) find that respondent from Arab World countries have indeed low levels of acceptance of the women’s work outside home. There is also ample qualitative evidence on this issue (see for instance Mernissi 1987 or Lecestre-Rollier 2015).
However, cultural explanations are hard to reconcile with the some stylized facts. For instance, if Middle Eastern and Northern African societies appear at outliers now, it wasn’t always the case. Karshenas, Moghadam, and Alami (2014) show that, in 1980, the female labor force participation was in line with the average in middle income countries, suggesting that specific path-dependencies may be at play (Gaddis and Klasen, 2014).
1.3.2
Lower outcomes in health and poverty
High poverty and inequality despite recent growthMorocco’s economy, devoid of significant amounts of natural resources, is more depen-dent on the primary sector than other countries in the region; annual growth rates are still very much correlated with agricultural growth (Vergne, 2014). In the 1990s, average growth was slow, due to the after-effect of the structural adjustment plan that Morocco had to undertake in the late 1980s. Following an economic liberalization of the economy in the mid-1990s, growth picked up in the 2000s, reaching an 3.52% per year over the decade (figure 1.2), behind the average of middle income countries (4.6%), but higher than in the MENA region. GDP growth has slowed down since 2010, to 2.2% per year on average, against 4% in middle income countries (although this rate is still higher than the regional average of 1%).
In Morocco, the economic growth of the past two decades has been accompanied by significant poverty reduction (figure 1.A.1 in appendix). Extreme poverty, measured by the $ 1.90 a day line (in 2011 USD PPP) has reached insignificant levels (1% of the
Figure 1.2 – Average per capita GDP growth, by sub-period
source: World Bank, WDI database.
population in 2013). Absolute poverty, at the $3.20 a day line, has been divided almost fourfold in the space of 15 years (from 28.2% of the population to 7.7% in 2013).
This does not mean that the problem of poverty has been “solved” in the Kingdom4. In
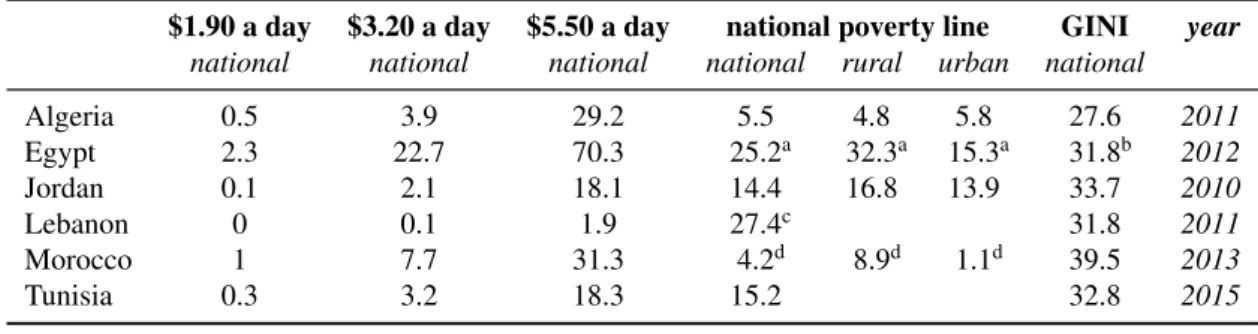
2013, 31.3% of the population lived below the $5.50 a day line that marks the beginning of a “global middle class” (Banerjee and Duflo, 2008). Among the countries in the region, Morocco has one of the higher poverty rates (together with Egypt, cf. table 1.5), when measured at international lines. But at the national poverty line, Morocco has the lowest poverty headcount of the region, at 4.2% of the population. This is indicative of the low level at which the national poverty line is set, close to the extreme poverty line5. Besides
the regular reevaluation to take into account increases in the price index, the poverty line has not been updated since the 1980s (ONDH, 2016c).
Finally, inequalities are higher in Morocco than in the rest of the region: the consump-tion-based Gini index lies at 39.5 (table 1.5). One of the drivers of this high level of inequality is the difference in living standards between the cities and the countryside. These urban-rural differentials are apparent in the poverty headcount: the poverty rate is of 8.9% in rural areas, against 1.1% in cities (at national poverty lines), again one of the biggest relative differentials in the region.
4Although the official discourse occasionally comes close to affirming so cf. HCP (2015), p.11 5In 2014, the national poverty line was set at 12DH a day, corresponding to 1.1 EUR, or 2.4 PPP USD
Table 1.5 – absolute poverty rates at World Bank lines, by country
$1.90 a day $3.20 a day $5.50 a day national poverty line GINI year national national national national rural urban national Algeria 0.5 3.9 29.2 5.5 4.8 5.8 27.6 2011 Egypt 2.3 22.7 70.3 25.2a 32.3a 15.3a 31.8b 2012 Jordan 0.1 2.1 18.1 14.4 16.8 13.9 33.7 2010 Lebanon 0 0.1 1.9 27.4c 31.8 2011 Morocco 1 7.7 31.3 4.2d 8.9d 1.1d 39.5 2013 Tunisia 0.3 3.2 18.3 15.2 32.8 2015 Source: World Bank WDI. Poverty lines expressed in 2011 PPP USD.
last year available for each country. ayear: 2010 byear: 2015 cyear: 2012 dsource: HCP
Health and healthcare
With the exception of life expectancy, Morocco’s performance in increasing the health of its inhabitants lags behind other countries in the region (figure 1.6). The maternal mortality ratio is 50% higher than MENA average (121 per 100,000 live birth, against 81 in the MENA region). Neo-natal and under-five mortality rates are also slightly higher than the regional average, reflecting the lower percentage of birth attended by skilled health staff (73.6% in Morocco against 85.6% in the region).
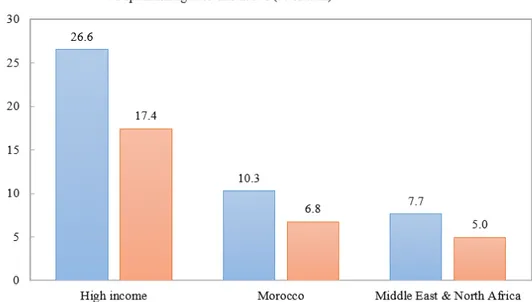
This can be linked to lower levels of spending in health care, and higher reliance on private financing (figure 1.7). At 5.5% of GDP, Morocco’s overall spending on health care is below the average for MENA country (5.8% of GDP); expressed in terms of PPP USD per capita, it also lies below the average of middle-income countries (435 USD PPP per capita against an average of 560 USD PPP per capita in middle income countries). Public expenditure on health care is particularly low : 189 PPP USD per person and per year in 2015, against 284 PPP USD in middle income countries and 351 PPP USD in MENA countries.
These figures are national averages that mask regional differences. Public health care spending by inhabitant varies by a factor of 5 according to the region: from 128 DH per inhabitant in the northern region of Taza-Al Hoceima to 640 DH per inhabitant in the southern region of Laâyoune-Sakia el Hamra (cf. figure 1.A.6 in this chapter’s appendix).
1.3.3
Social protection in Morocco and the MENA region
From a conservative-authoritarian model to residual anti-poverty programsKarshenas, Moghadam, and Alami (2014) describe the social system of MENA countries as following a conservative-authoritarian model. Similarly to the “Bismarckian” welfare states of Continental Europe, they are corporatist and family-oriented. But in difference to their European counterparts, they are governed in a top-down manner, without
involve-Table 1.6 – Indicators of health outcomes, by groups of countries
LIC MENA MIC MOR year Life expectancy at birth, total (years) 62.5 73.3 71.1 75.6 2017 Maternal mortality ratio (per 100,000 live births) 479 81 180 121 2017 Infant mortality rate (per 1,000 live births) 48.6 19.3 27.8 20 2017 Neonatal mortality rate (per 1,000 live births) 26.4 12.7 17.9 14.4 2017 under-5 mortality rate (per 1,000 live births) 69.1 23.1 36.2 23.3 2017 Births attended by skilled health staff (% of total) 58.6 85.9 82.9 73.6a 2014 Immunization, measles (% of children ages 12-23 months) 74.3 86.6 85.9 99.0 2017 Prevalence of stunting (% of children under 5) 36.5 15.8 23.6 14.9a 2017 Prevalence of wasting (% of children under 5) 7.4 7.6 8 2.3a 2017 Prevalence of severe wasting (% of children under 5) 2 3.2 2.7 1a 2017 Source: all data from World Bank WDI. LIC: Low Income Countries; MENA : Middle East and North Africa; MIC : Middle Income Countries; MOR : Morocco ayear 2011
Table 1.7 – Indicators of health spending, by groups of countries
LIC MENA MIC MAR year Physicians (per 1,000 people) 0.31 1.12 1.28 0.62a 2013 Hospital beds (per 1,000 people) 1.21b 1.23 2.38 0.90 2011 Current health expenditure (% of GDP) 6.1 5.8 5.4 5.5 2015 Current health expenditure per capita, PPP $ 98 724 560 435 2015 General government health expenditure per capita, PPP $ 19.8 351.1 284.2 188.5 2015 General government health expenditure (% of CHE) 19.6 47.7 52.6 43.3 2015 General government health expenditure (% of GDP) 1.2 2.8 2.8 2.4 2015 General government health expenditure (% of GGE) 9.4c 7.7 2015 Private health expenditure (% of CHE) 50.6 51.7 46.5 55.7 2015 Private health expenditure per capita (current US$) 18.8 118.6 119.5 89.0 2015 Private health expenditure per capita, PPP $ 49.7 369.3 269.6 242.5 2015 Out-of-pocket expenditure (% of CHE) 44.2 46.0 36.5 53.1 2015 Source: all data from World Bank WDI. LIC: Low Income Countries; MENA : Middle East and North Africa (excl. High income); MIC : Middle Income Countries; MOR : Morocco
CHE: Current Health Expenditures; GGE : Government General Expenditures ayear 2011 byear 2006 cyear 2009
ment of organized labor. Their creation in the post-independence period of was tightly linked to the process of state-building, with tne secondary objective of creating a social support base (Richards and Waterbury, 2008). These systems provided free schooling, healthcare, subsidized staples and public utilities, as well as pension plans and (often) housing subsidies for government employees, financed mainly by general government revenue (often dominated by natural resource rents). Although not formally part of the social system, the policy of guaranteed employment for university graduates was also per-ceived as being an integral part of the “social pact” that characterized post-independence, modernizing MENA states.
This relatively generous package of benefits was not universal; its coverage was lim-ited to (mostly male) employees of the public sector. The self-employed, domestic work-ers, informal as well as agricultural workers were de facto excluded. The financing of these regimes appeared unsustainable in the 1980s, when the majority of the middle-income MENA countries experienced public budget or balance-of-payment imbalances that led to macroeconomic reforms, in the form of reduced public expenditure and open-ing of markets (Yousef, 2004). One of the main victims of this period of macroeconomic adjustment period is the policy of guaranteed recruitment for university graduates.
The return to economic growth of the 2000s did not led to an expansion of the old-style social programs. In its stead, countries put in place various anti-poverty programs (World Bank, 2011) . While possibly poverty-reducing, they may also lead to an increas-ing fragmentation of social systems; and in practice, they are often quite small (Alami, 2017). In chapter 2, we study one of such programs, the RAMED system of free hospital care, that was put in place in 2012 in Morocco.
In any case, this renewed focus on poverty alleviation was not enough to prevent the social grievances that led to the Arab spring revolts. Nor, crucially, were they sufficient to warrant the suppression of food and fuel subsidies that constitute a significant drag on public finances, especially for non-oil-producing countries. These represented an average of 7.1 of GDP in 2009 across MENA countries, and close to one third of government ex-penditure in Morocco in 2012, at the height of the oil price spike (Ministère des Finances, 2014).
The legacy of colonialism in Morocco
As in the political domain (Hibou, 2006), the legacy of colonial rule has left a lasting imprint on the organization of the healthcare system in Morocco. We briefly outline some characteristics of Morocco’s experience of colonialism that may contribute to an understanding of the issues it faces today.