HAL Id: tel-01730805
https://tel.archives-ouvertes.fr/tel-01730805
Submitted on 13 Mar 2018
HAL is a multi-disciplinary open access
archive for the deposit and dissemination of sci-entific research documents, whether they are pub-lished or not. The documents may come from teaching and research institutions in France or abroad, or from public or private research centers.
L’archive ouverte pluridisciplinaire HAL, est destinée au dépôt et à la diffusion de documents scientifiques de niveau recherche, publiés ou non, émanant des établissements d’enseignement et de recherche français ou étrangers, des laboratoires publics ou privés.
Risk management in supply chains : a simulation and
model-based approach
Noah Ben Jbara
To cite this version:
Noah Ben Jbara. Risk management in supply chains : a simulation and model-based approach. Business administration. Université Grenoble Alpes, 2018. English. �NNT : 2018GREAI003�. �tel-01730805�
THÈSE
Pour obtenir le grade de
DOCTEUR DE LA COMMUNAUTE UNIVERSITE GRENOBLE ALPES
Spécialité : Genie industriel Arrêté ministériel : 25 mai 2016
Présentée par
NOAH BEN JBARA
Thèse dirigée par Gülgün ALPAN Codirigée par Pierre DAVID
Préparée au sein du Laboratoire GSCOP dans l'École Doctorale IMEP2
Risk management in supply
chains: a simulation and
model-based approach
Thèse soutenue publiquement le « 30/01/2018 », Devant le jury composé de :
M. Khaled HADJ-HAMOU
Professeur, INSA Lyon, Président
M. Hamid ALLAOUI
Professeur, Université d’Artois, Rapporteur
M. Laurent GENESTE
Professeur, Ecole nationale d’ingénieurs de Tarbes, Rapporteur
Mme. Gülgün ALPAN
Maître de conférences, HDR, Grenoble-INP, Directrice de thèse
M. Pierre DAVID
«Que je plains ceux que n'éclaire pas, dans leurs heures sombres, le grand jour de l'éternité !» Citation d’Anne BARRATIN (1894)
A
CKNOWLEDGEMENTFirstly, I would like to express my sincere gratitude to my advisors Gülgün ALPAN and Pierre DAVID for their continuous support, their patience and the energy they spend for assisting me conducting this Ph.D. work. I want to thank them for their guidance, for their availability and for all the ideas, the corrections and the restructuring they provide. Their advices and comments were very valuable for improving the quality of this work and for upgrading my skills.
Besides my advisors, I would like to thank my friends and the members of my music team “Mosaique” starting with my music tutor Aziz DHIB and my best musician friend Mohamed Amine DERBAL and I want to thank also the Tunisian cultural center of Grenoble for the activities they organize. Thanks to them I had a great time performing the Luth instrument and enjoying good music. Furthermore, I want to thank my neighbors and friends Amine DANDACHY and Hassen KANJ for their kindness and hospitality.
I want to thank the members of G-SCOP laboratory especially the ones who spend efforts for creating a good working climate through organizing special events that enhance synergy and friendship. Big thanks go to my family members who supported me in each important step of my life and in achieving my goals.
Finally, I want to thank Rhone-Alpes region for funding this Ph.D.
R
EMERCIEMENTSPremièrement, Je veux exprimer mes sincères remerciements à mes encadrants Gülgün ALPAN et Pierre DAVID pour l’Energie dépensée pour m’assister dans ce travail. Je les remercie pour toutes les corrections, les restructurations, les idées fournies et pour leur disponibilité. Leurs conseils et commentaires étaient d’une grande valeur dans l’amélioration de la qualité de ce travail et dans le développement de mon niveau en général.
En plus de mes encadrants, je veux remercier mes amis ainsi que les membres de mon groupe de musique Mosaïque commençant par mon professeur de musique Aziz DHIB et mon meilleur ami musicien Mohamed Amine DERBAL et je remercie aussi le centre culturel tunisien de Grenoble pour les activités qu’ils organisent. Grace à eux j’ai passé un bon temps pour maîtriser le luth, toute en profitant de la belle musique. Je remercie également mes voisins Amine DANDACHY et Hassen KANJ pour leur gentillesse et hospitalité.
J’adresse mes remerciements aussi aux membres du laboratoire G-SCOP et surtout ceux qui ont essayé de créer une bonne ambiance de travail en organisant des événements qui améliorent la synergie et l’amitié. J’adresse un grand merci aux membres de ma famille qui m’ont toujours supporté dans chaque étape importante de ma vie et dans l’atteinte de mes objectifs.
R
ESUMEE
NF
RANÇAISLes chaînes logistiques (CL) sont en continuelle évolution. Elles changent de configuration, de taille, d'étendue géographique ou de gestion. De nouveaux types de SCs apparaissent grâce au développement technologique et à la mondialisation. Par exemple, l’introduction de la modularité dans les ordinateurs Dell a transformé la CL pour que les utilisateurs fassent une partie de l’assemblage. Le développement des technologies de recyclage et de récupération ont fait apparaitre des problématiques de logistique inverse. Le développement de plateformes sécurisées de paiement électronique a ouvert la voie pour le développement des chaînes logistiques digitales comme celle d’Amazon.
Les chercheurs et les gestionnaires des chaines logistiques n’ont cessé de développer des approches de gestion pour s’adapter aux changements des SCs. Depuis longtemps lesefforts se sont concentrés sur la réduction des coûts, l’amélioration de la rentabilité et la compétitivité. Un exemple de ces approches est le Lean mangement, développée par Toyota au Japon. L’adoption de ces approches s’accompagne par l’apparition de nouveaux défis. Plusieurs chercheurs ont souligné que les avantages de ces approches (niveaux de stocks réduits, délais de livraison plus courts) ont rendu les CL plus vulnérables aux perturbations locales et mondiales ((Regardez par exemple, (Enyinda et al. 2008), (Pfohl et al. 2013);(Tuncel & Alpan 2010)).
La vulnérabilité est inhérente au développement dynamique des SCs et à leur complexité. Comme l'a révélé (Jüttner 2005), 44% des entreprises couvertes par son étude s'attendent à ce que la vulnérabilité de leurs chaînes logistique augmente au cours des cinq prochaines années
Au cours des dernières années, de nombreuses chaînes logistiques ont subi des perturbations qui ont eu des répercussions négatives sur leur performance. Selon une étude réalisée par (Simchi Levi et al. 2013) sur un échantillon de 209 entreprises internationales, les perturbations de la CL ont induit des impacts négatifs sur la performance financière pour 54% d’entre elles et 64% ont déclaré une baisse de leurs niveaux de service.
Les entreprises ont parfois des difficultés à surmonter ces perturbations comme l’ont évoqué (Hendricks & Singhal 2005). Un célèbre exemple est celui d’Ericsson. En effet comme l’ont décrit (Norrman & Jansson 2004), suite à un orage, un incendie s’est déclaré dans la "salle blanche" d’un fournisseur. La destruction des équipements a interrompu l'envoi de puces radiofréquences à Ericsson. Comme Ericsson n'avait qu'un seul fournisseur pour ce type de composant, la société a perdu sa capacité à vendre et à livrer un de ses produits phares.
Plusieurs mois de production de téléphones portables ont été perdus poussant Ericsson à stopper son activité de téléphonie mobile. Le coût de cette rupture a été estimé à environ 200 millions de dollars.
Les managers des chaines logistiques rencontrent des échecs dans la gestion de leurs risques. Comme révélé par (Hind & Craighead 2010) pour des sociétés comme Boeing, Cisco et Pfizer, les pertes et / ou dépenses imprévues ont dépassé 2 milliards de dollars en raison des décisions inefficaces en 2001.
(Chopra & ManMohan 2014) indiquent que plusieurs enquêtes ont montré qu’il est difficile pour les managers d’évaluer les actions de maîtrise de risque d’un point de vue de leur efficacité économique. Ceci entraîne des réticences à investir dans des mesures de prévention. De plus, une étude relayée par (Marchese & Paramasivam 2013) conduite par Deloitte sur 600 CL révèle que de nombreuses entreprises ne maîtrisent pas la gestion des risques.
En effet, seuls 33% des interviewés ont utilisé des approches de gestion des risques pour gérer de manière proactive leurs risques. Aussi 45% ont estimé que leur gestion des risques était peu ou pas efficace.
Plusieurs raisons expliquent les échecs. La raison principale selon (Jüttner 2005), est le faible degré de mise en œuvre des instruments de gestion du risque pour les CL. Même si ils sont implémentés, de nombreuses entreprises présentent des processus de gestion des risques immatures. En effet, comme l'a révélé l'étude de (Simchi Levi et al. 2013), 59% des entreprises étudiées ont mis en place des processus immatures, ni proactifs ni flexibles pour traiter les incidents.
Une autre raison est que les entreprises comprennent mal la gestion des risques des CL. Pour (Jüttner 2005), la maitrise des risques dans les CL est encore souvent vue comme une tâche spécifique à l'entreprise, alors que celle-ci doit couvrir des risques partagés avec les entreprises partenaires. En effet, comme expliqué par (Chopra & ManMohan 2014), traiter un risque individuellement et oublier les interconnexions peut mener à exacerber d’autres risques. De plus, les actions prises par une entreprise pour traiter un risque peuvent augmenter le niveau de risque pour ses partenaires. Les entreprises ont aussi tendance à faire l’erreur de gérer en priorité les risques récurrents à faible impact tout en ignorant les risques à fort impact et de faible vraisemblance.
Les managers des CL ont besoin d’outils et méthodes pour améliorer leur gestion des risques. Même si plusieurs approches existent et font partie de la boîte à outils des managers, elles ne
couvrent pas encore toutes les exigences. La littérature professionnelle et scientifique s’intéresse de plus en plus à ce sujet.
L'objectif de cette thèse est d’apporter sa contribution pour surmonter certaines lacunes relevées par la littérature. Le premier sujet auquel nous contribuons est le manque d'outils pour permettre aux gestionnaires de CL de construire un modèle conceptuel de leur système et ses risques associés. Notre but est également de fournir un modèle pouvant être traduit en un modèle de simulation. Le but est d’être capable de construire une représentation objective et comparable d’un CL et d’obtenir une représentation exploitable avec les techniques de transformation de modèles.
L’analyse par simulation est un outil puissant adapté à l’évaluation des CL. De nombreux chercheurs à l’instar de ((Wu et al. 2006), (Cigolini et al. 2011)) ont cependant repéré que la difficulté rencontrée dans la construction des modèles de simulation freine l’adoption de ces techniques par la communauté. En effet, pour les managers, simuler une CL reste encore une tâche difficile et coûteuse qui exige des efforts d'apprentissage et des compétences avancées. Une des raisons est que les logiciels de simulation actuels utilisent des blocs de construction qui sont souvent éloignés du domaine des CL ou qui ont un faible niveau de granularité par rapport aux éléments à modéliser.
Par conséquent, certains chercheurs proposent des environnements de modélisation pour la simulation qui définissent des méta-modèles pour les CL. La plupart des solutions proposées dans la littérature n’arrivent pas encore à totalement représenter les connaissances du domaine des CL. De plus, la plupart de ces environnements ne prennent pas en compte la modélisation des risques. Cela s'explique en partie par le manque de consensus sur la définition et la catégorisation des risques dans les CL.
Pour surmonter cela, trois questions de recherche sont posées dans ce travail:
• Comment définir un environnement de modélisation pour la simulation qui puisse être facilement adopté par les gestionnaires des SCs?
• Comment définir des éléments de modélisation qui seront à la fois génériques et capables de couvrir le domaine des SCs?
• Comment intégrer efficacement les risques dans les outils de modélisation pour la simulation?
Notre objectif a donc été de proposer les éléments nécessaires à la constitution d’un environnement de modélisation pour les CL et leurs risques permettant une construction « facile » des modèles conceptuels et en imaginant leur transition vers des modèles simulables.
Pour réussir cela des auteurs comme ((Beamon 1998), (Min & Zhou 2002),… ) ont introduit la nécessité d’utiliser un langage de modélisation pour décrire et analyser dynamiquement les scénarios de la SC.
Pour cela notre travail est d’abord de définir un langage de modélisation. Ceci a été réalisé en proposant un méta-modèle pour exprimer la structure des CL, le comportement des CLs, les risques inhérents à ces systèmes.
Ce méta-modèle définit un ensemble de blocs de construction interconnectables. Il est présenté sous la forme d'un profil SysML, qui peut être instancié pour modéliser tout ou partie d’une CL.
Pour maximiser l’acceptabilité des concepts proposés dans le méta-modèle nous nous sommes basés sur l'analyse des processus décrits dans la référence SCOR. La référence SCOR est l'une des références des plus utilisées dans l'industrie; elle fournit une description textuelle des processus des CL et les associe à un ensemble d’indicateurs de performances. Les concepts de SCOR sont centrés sur une présentation statique des processus. Nous avons donc du réinterpréter les références SCOR pour à la fois décrire les structures physiques des CL et proposer des versions exécutables des opérations. La proposition peut donc être vue comme une extension de SCOR facilitant la connexion à des activités de simulation.
Nous proposons ainsi, des blocs de modélisation qui couvrent les flux transférés entre les opérations de la CL décrites dans SCOR en tant que entrée/sortie des processus. Nous proposons également une extension de SCOR pour prendre en compte les relations et les interactions qui existent entre les partenaires de la CL.
Nous proposons de définir des algorithmes détaillés pour chaque opération décrite dans les processus de SCOR. Enfin, nous proposons un ensemble de briques de construction pour les risques.
Le deuxième point important de la contribution est le support apporté à la création d’un modèle simulable et facilement paramétrable pour permettre la réalisation de campagnes d’expérimentation.
Suite à l’analyse de la littérature nous avons constaté que peu de travaux fournissent une méthode explicite pour construire un modèle de simulation pour une CL. Certains travaux fournissent des blocs de modélisation spécifiques au domaine de la SC sans préciser comment les traduire pour la simulation, comme le travail de (Persson 2011). Un deuxième point délicat relevé dans la littérature est l’absence d’un consensus sur la façon de simuler des risques. Il est en effet difficile de proposer une catégorisation permettant de couvrir à des fins de simulation la variété des risques qu’un CL peut rencontrer. Pour cela nous avons choisi d’étendre les travaux de (Saleh Ebrahimi et al. 2012) en proposant leur traduction vers des modèles de simulation.
Nous avons donc cherché à répondre aux deux questions suivantes :
• Comment traduire simplement et rapidement un modèle conceptuel de CL en un modèle de simulation ?
• Comment assister les gestionnaires de CL dans l'expérimentation de leur modèle de simulation pour évaluer différents scénarios ?
Nous avons donc développé des routines de traduction permettant de créer à partir d’un modèle conceptuel de la SC exprimé avec notre méta-modèle, un modèle de simulation à mettre en œuvre pour simuler les scénarios voulus.
Notre approche décrit comment traduire les éléments de structure de la SC ainsi que les entrée/sortie des blocs d’opérations et des modules exprimant le comportement et les risques.. La traduction est illustrée par la construction de bibliothèques de modules de simulation ARENA.
La solution fournie permet aux utilisateurs de construire rapidement leurs propres modèles de simulation. Différentes étapes sont suivies allant de la traduction de la structure à l’injection de profils de risques en passant par le paramétrage des politiques de gestion de la chaîne. La façon de paramétrer les modèles pour obtenir différents scenarios est également discutée. Les solutions développées dans cette thèse ont été testées sur une étude de cas. Les résultats montrent comment elles peuvent favoriser l’analyse des risques. L’étude de cas a fourni également des éléments de vérification des méta-modèles, de leur traduction et des
bibliothèques de modules de simulation. L'analyse des résultats de simulation montre que l'outil est efficace pour évaluer les impacts des risques sur les performances d’une CL.
Les travaux réalisés ouvrent d’autres directions de recherche. Notamment, le développement de bibliothèques pour les politiques de gestion des risques des CL. En effet, plusieurs auteurs ont souligné le besoin de définir des contre-mesures réactives pour faire face aux perturbations auxquelles sont confrontés les CL (Ivanov et al. 2014).
Une autre direction est de développer des algorithmes spécifiques pour optimiser les performances des politiques de gestion de risques en tirant profit des possibilités fournies par les combinaisons possibles entre simulation et optimisation.
Une troisième direction consiste à aborder l'intégration de l’environnement de modélisation pour la simulation dans le processus de gestion des risques de l’entreprise. En effet, un problème classique à aborder consiste à trouver la meilleure façon de modéliser les données recueillies auprès des acteurs de la SC pour alimenter le modèle de simulation. En outre, le développement d'un système dynamique « en ligne » pour la gestion des risques qui comprend un module pour chaque étape du processus de gestion de risques est aussi un objectif pertinent.
T
ABLE OF CONTENTSAcknowledgement ... 3
Remerciements ... 3
Résumé En Français ... 4
Introduction ... 21
Chapter 1: Literature review ... 26
Summary ... 26
Introduction ... 26
1.1 Literature review about supply chains analysis and modeling ... 27
1.1.1 Supply chain analysis methods ... 27
1.1.1.1 Descriptive methods ... 28
1.1.1.2 Quantitative methods ... 31
1.1.2 Modeling frameworks for simulation ... 37
1.2 Literature review on supply chain risk management ... 42
1.2.1 SC risk identification ... 46 1.2.2 SC Risk assessment ... 49 1.2.3 SC Risk treatment ... 56 1.2.4 SC Risk monitoring ... 58 1.3. Research questions ... 59 Conclusion ... 61
Chapter 2: The framework’s development methodology ... 64
Summary ... 64
Introduction ... 64
2.1 Development of the modeling approach of the framework ... 66
2.1.1 SysML as a meta-modeling language ... 67
2.1.2 Designing the meta-model constructs ... 68
2.1.2.1 The SCOR reference model ... 69
2.1.2.2 Defining the risks modeling constructs ... 71
2.2 Development of translation guidelines and simulation modules ... 71
2.2.1 DES as simulation formalism for translating the conceptual constructs ... 72
2.2.2 ARENA as an example of a platform for translation ... 72
Conclusion ... 73
Chapter 3: The modeling framework: Creating the conceptual model... 76
Summary ... 76
Introduction ... 76
3.1 Modeling supply chain’s structure ... 77
3.1.2 The Product view ... 80
3.1.3 The infrastructure view ... 81
3.1.4. The transportation network view ... 82
3.2 Modeling the supply chain’s behavior ... 83
3.2.1 Representing flows ... 84
3.2.1.1 The material flows ... 85
3.2.1.2 The financial flows ... 85
3.2.1.3 The information flows ... 85
3.2.2 Representing the SC functions ... 88
3.2.2.1 The Operation block ... 88
3.2.2.2 The Library of supply chain Operations ... 89
3.2.3 Modeling through Roles ... 99
3.2.3.1 The Role block ... 99
3.2.3.2 The Roles library ... 99
3.2.4 Modeling the SC Processes ... 101
3.2.5 Illustrative example ... 102
3.3 Modeling the SC risks ... 104
Conclusion ... 106
Chapter4: A simulation framework: Creating and experimenting the simulation models ... 108
Summary ... 108
Introduction ... 108
4.1 The creation of the simulation models ... 109
4.1.1 Translation of the SC structure ... 110
4.1.1.1 Buffer construct translation example ... 110
4.1.1.2 The Resource construct translation example ... 111
4.1.2 Translation of the SC behavior ... 112
4.1.2.1 Translation of the Operation modeling constructs ... 112
4.1.2.2 Translation of the Flow modeling constructs ... 116
4.1.2.3 Translation of the Process modeling constructs ... 117
4.1.3 Translation of the SC risks ... 118
4.1.3.1 Translation of the propertyChangeRisk ... 119
4.1.3.2 Translation of the OperationModeRisk ... 120
4.1.3.3 Translation of the objectDestructionRisk ... 121
4.2 Experimentation of the simulation model ... 122
4.2.1 Define a scenario characterized by new policies ... 123
4.2.2 Define a scenario characterized by a different SC structure or network ... 123
Conclusion ... 126
Chapter 5: Case study: Truck-Much supply chain ... 128
Summary ... 128
Introduction ... 128
5.1 Description of the case ... 128
5.2 Modeling the structure of the SC ... 130
5.2.1 Product view ... 130
5.2.2 Actor’s network view ... 131
5.2.3 Infrastructure view ... 132
5.2.4 transportation network view ... 134
5.3 Modeling the behavior of the SC ... 136
5.3.1 Modeling the SC activities ... 136
5.3.2 Modeling the SC processes ... 138
5.4 Creating and verifying the simulation model ... 140
5.5 Simulating the model ... 147
Conclusion ... 158
Chapter 6: Conclusion ... 160
6.1 Resolved research questions and main findings ... 160
6.2 Limits Of SCOR ... 162
6.3 Limits On The Coverage Of The Proposal ... 162
6.4 Perspectives ... 163
Bibliography ... 164
A1 The library of domain specific operations ... 173
A1.1 The ISSUEMATERIAL Operation (sMi.2) ... 173
A1.2 The TEST Operation (sMi.3.2) ... 179
A1.3 The PICKANDPACK operation (C.sDi.9-sDi.10) ... 185
A1.4 The LOADVEHICLE Operation (sDi.11 ) ... 192
A1.5 The SHIPPRODUCT Operation (sDi.12+A+sSRi.5)... 199
A1.6 The RECEIVEPRODUCT Operation (sSi.2+A+sDi.13+A+sDRi.3) ... 202
A1.7 The VERIFY Operation(sSi.3+A+sDi.13+A+sDRi.3)... 208
A1.8 The TRANSFER Operation (sSi.4+A+sDRi.4+A+ sD1.8) ... 214
A2 The library of Roles... 224
A3 SC Risk countermeasures strategies proposed in literature ... 227
A4 Model of the SC case study ... 229
A4.1 Modeling the SC structure ... 229
A4.1.1 Modeling the Product view of the SC ... 229
A4.1.3 Modeling the infrastructure view of the SC ... 231
A4.1.3.1 Modeling the SC Facilities ... 231
A4.1.3.2 Modeling THE SC Resources ... 232
A4.1.3.3 Modeling the SC Buffers ... 234
A4.1.4 Modeling the transportation view of the SC ... 236
A4.1.4.1 Modeling the SC Routes and Paths ... 236
A4.1.4.2 Modeling the SC TransportationResources and TransferResources ... 237
A4.2 Modeling the SC behavior ... 238
A4.2.1 Modeling the SC activities ... 238
L
IST OF FIGURESFigure 1.1: SCOR performance management process (sE2) (provided by SCC) ... 29
Figure 1.2 : Example of a SC response matrix (Source (Alaca & Ceylan 2011)) ... 30
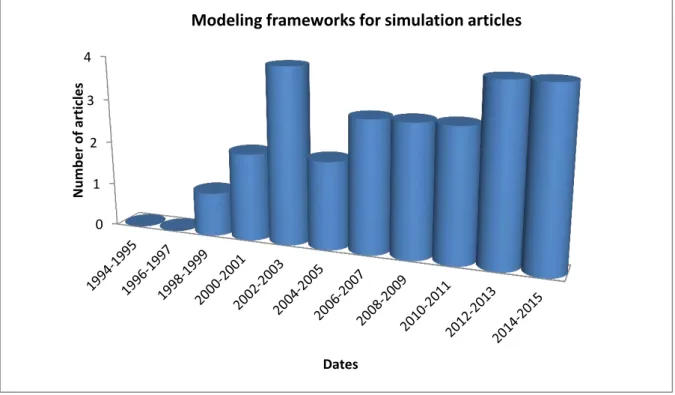
Figure 1.3: Evolution of thhe number of simulation articles ... 34
Figure 1.4: Evolution Of the number of articles concerned with modeling frameworks for simulation ... 38
Figure 1.5: Evolution of the number of SC risk articles ... 43
Figure 2.1: The framework support to simulation based on SC risk analysis ... 65
Figure 2.2: The SysML diagrams (Adapted from omgSysml ) ... 68
Figure 2.3: The description levels of SCs defined by SCOR ... 70
Figure 3.1: The framework to model the SC and the associated risks ... 77
Figure 3.2: SC Structure meta-model blocks definition diagram ... 78
Figure 3.3: The Actors’ network view blocks definition diagram ... 79
Figure 3.4: The Contract Blocks definition diagram ... 80
Figure 3.5: The Product view block definition diagram ... 80
Figure 3.6: The infrastructure view block defenition diagram ... 81
Figure 3.7: Transportation network view blocks definition diagram ... 83
Figure 3.8: The behavior meta-model block definition diagram ... 84
Figure 3.9: The flows of the SCOR Process elements “sS1.4/sS2.4 TranferProduct” and “sD1.15/sD2.15 Invoice” ... 85
Figure 3.10: block definition diagram of information flows of type “Order” ... 87
Figure 3.11: Notification block definition diagram ... 87
Figure 3.12: The Operation interaction ... 88
Figure 3.13: The OperationMode block definition diagram... 89
Figure 3.14: The Produce Operation block diagram ... 92
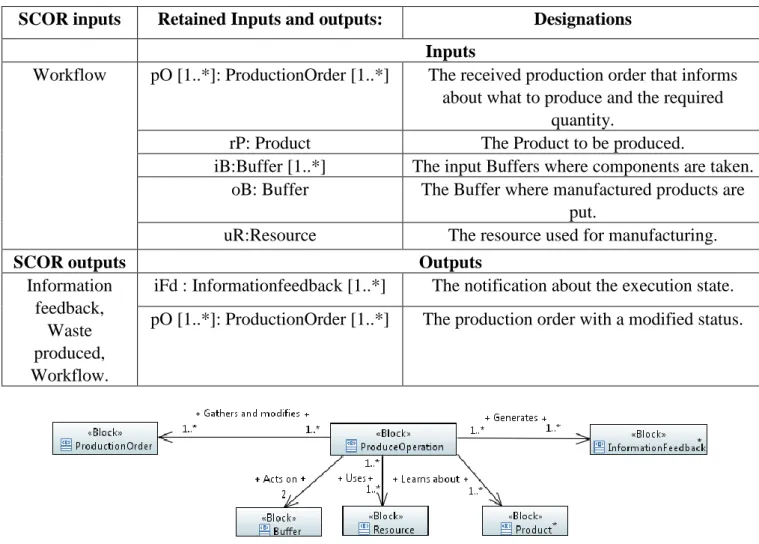
Figure 3.15: Details of the used inputs and outputs for the PRODUCE Operation ... 93
Figure 3.16: The PRODUCE Operation state machine ... 94
Figure 3.17: SC Roles block definition diagram ... 100
Figure 3.18: The Process block definition diagram... 102
Figure 3.19: Trading goods process ... 103
Figure 3.20: SC risk meta-model block definition diagram ... 106
Figure 4.1: The framework support to simulate the SC and the associated risks ... 109
Figure 4.2: The translated Buffer construct... 111
Figure 4.3: The translated Resource modeling construct ... 112
Figure 4.4: The ARENA dialog window for parametrizing the sMi.3.1 PRODUCE ... 113
Figure 4.5: Flowchart of the sMi.3.1PRODUCE Operation ARENA simulation module ... 114
Figure 4.6: Flowchart of the consumeComponents () method ARENA submodel ... 115
Figure 4.7: The template of the SCOR Operation simulation modules ... 116
Figure 4.8: The PurchaseOrder ... 117
Figure 4.9: The ARENA model of the trading goods process... 118
Figure 4.10: The ARENA template for the Risk modules ... 119
Figure 4.11: Flowchart of the propertyChangeRisk module in ARENA ... 120
Figure 4.12: Flowchart of the operationModeRisk ARENA module ... 120
Figure 4.13: Flowchart of the ARENA ObjectDestructionRisk module relative to Resource objects ... 121
Figure 4.14: Flowchart of the ARENA ObjectDestructionRisk module relative to Resource objects ... 121
Figure 4.15: Flowchart of the ARENA ObjectDestructionRisk module relative to information flow objects .... 122
Figure 4.17: The ARENA model of the trading goods process including an instantiation of the
destructObjectRisk module relative to Flow objects ... 125
Figure 5.1: Illustration of the Truck-Much Supply Chain ... 129
Figure 5.2: The object diagram of the products CGMV, Bd and Lv ... 131
Figure 5.3: A portion of the object diagram of the Actor’s network view of the structure model ... 132
Figure 5.4: The layout of the GTM facility ... 132
Figure 5.5: The Facility instance of the GTM factory... 133
Figure 5.6: Example of a Resource instance belonging to the GTM facility ... 134
Figure 5.7: Example of a Buffer instance belonging to the GTM facility ... 134
Figure 5.8: Example of a Route instance linking GTM and DistC1 ... 135
Figure 5.9: Example of an instance of the TransportationResource used for shipping to DistC1 and DistC2 facilities ... 135
Figure 5.10: Example of a TransferResource’s instance linked with the used Path ... 136
Figure 5.11: The instances of the ROLE consructs relative to TRUCKMUCH ... 137
Figure 5.12: Instance of the SMI.3 PRODUCE OPERATION relative to TRUCKMUCH ... 137
Figure 5.13: The Activity diagram modeling the aggregated SC process ... 138
Figure 5.14 : The Activity diagram modeling the GTM sub-process... 139
Figure 5.15: Example of translation of the sMi.3 Produce Operation instance into an ARENA module ... 142
Figure 5.16: An example of ARENA model where Operation patterns are connected ... 143
Figure 5.17: The ARENA model of the studied SC process ... 143
Figure 5.18: Temporal variation of GTM inventory levels after executing modules ... 146
Figure 5.19: Impacts on the RL2.2 %Delivery Performance To Customer Commit Date ... 155
Figure 5.20: Impacts on The Average Inventroy Per Day ... 155
Figure 5.21: Impacts on The RL1.2 % Of Orders Delivered In Full ... 156
Figure 5.22: Impacts on the Production Resource utilization ... 156
Figure A1.1: The ISSUEMATERIAL Operation block definition diagram ... 173
Figure A1.2: Details of the used inputs and outputs for the ISSUEMATERIAL Operation ... 175
Figure A1.3: State Machine Of The ISSUEMATERIAL Operation’s Standard Mode ... 176
Figure A1.4: The TEST Operation Block definition diagram ... 180
Figure A1.5: Details Of The Used Imputs And Outputs For The TEST Operation ... 181
Figure A1.6: The state machine of the algorithm of the standard Mode of the TEST Operation ... 182
Figure A1.7: The PICKANDPACK Operation Block definition diagram ... 186
Figure A1.8: Details Of The Used Imputs And Outputs For The PICK AND PACK Operation ... 187
Figure A1.9: The state machine of the algorithm of the PICKANDPACK Operation... 188
Figure A1.10: The LOADVEHICLE Operation Block ... 192
Figure A1.11: Details of the used inputs and outputs for the LOADVEHICLE Operation ... 194
Figure A1.12: The state machine of the Algorithm of the LOADVEHICLE Operation ... 195
Figure A1.13: The SHIPPRODUCT Operation block Definition diagram ... 200
Figure A1.14: Details Of The Used Imputs And Outputs For The SHIPPRODUCT Operation ... 200
Figure A1.15: The state machine of the SHIPPRODUCT Operation ... 201
Figure A1.16: The RECEIVEPRODUCT Operation block Definition diagram ... 204
Figure A1.17: Details Of The Used Imputs And Outputs For The THE RECEIVEPRODUCT Operation... 204
Figure A1.18: The state machine of the RECEIVEPRODUCT Operation ... 205
Figure A1.19: The VERIFY Operation block Definition diagram ... 210
Figure A1.20: Details Of The Used Imputs And Outputs For The VERIFY Operation ... 210
Figure A1.21: The state machine of the VERIFY Operation ... 211
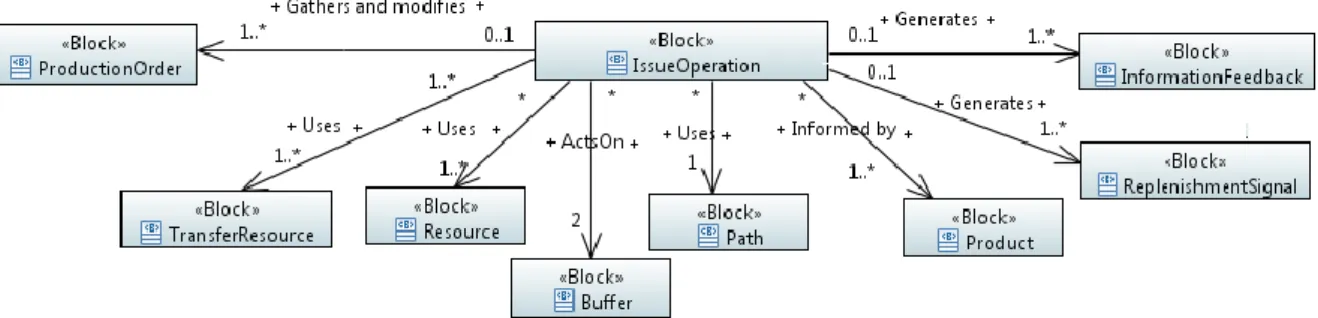
Figure A1.22: TRANSFER Operation block Definition diagram ... 216
Figure A1.24: The state machine of the TRANSFER Operation ... 219
Figure A4.1: The Object diagram of The products CGMV, BD AND LV ... 229
Figure A4.2: The Instance Diagram Of The Contract Between TruckMuch And DC1 ... 229
Figure A4.3: The Instance Diagram of The Contract Between TruckMuch And DC2 ... 230
Figure A4.4: The Instance Diagram of The Contract Between TruckMuch And Supplier2 ... 230
Figure A4.5: The Instance Diagram of The Contract Between TruckMuch Supplier1 ... 230
Figure A4.6: The instance Diagram Of The GTM Facility ... 231
Figure A4.7: The instance Diagram Of The DistC1 Facility ... 231
Figure A4.8: The Instance Diagram Of The DISTC2 Facility ... 231
Figure A4.9: The instance Diagram Of The Supplier1 ... 232
Figure A4.10: The Instance Diagram Of The SUPPLIER2 ... 232
Figure A4.11: The resource instances diagram belonging to GTM Facility ... 232
Figure A4.12: The resource instances diagram belonging to DistC1 Facility ... 233
Figure A4.13: The Resource Instances Diagram Belonging To DISTC2 Facility ... 233
Figure A4.14: The resource instances diagram belonging to Supplier1 Facility... 233
Figure A4.15: The resource instances diagram belonging to Supplier2 Facility... 234
Figure A4.16: The Buffer instance belonging to GTM Facility ... 234
Figure A4.17: The Buffer instance belonging to DistC1 Facility ... 235
Figure A4.18: The Buffer instance belonging to DistC2 Facility ... 235
Figure A4.19: The Buffer instance belonging to Supplier1 Facility ... 235
Figure A4.20: The Buffer instance belonging to Supplier2 Facility ... 236
Figure A4.21: The SC Route insttances ... 236
Figure A4.22: The Path instance belonging to GTM ... 236
Figure A4.23: The SC TransportationResource instances ... 237
Figure A4.24: The SC transferResource instances ... 238
Figure A4.25: The instances of the Roles constructs relative to TRUCKMUCH ... 238
Figure A4.26: The instances of the Roles constructs relative to Supplier1 ... 239
Figure A4.27: The instances of the roles constructs relative to Supplier2 ... 239
Figure A4.28: The instances of the roles constructs relative to DistC1 ... 240
Figure A4.29: The instances of the Roles constructs relative to DistC2 ... 240
Figure A4.30: The activity diagram modeling the aggregated SC Process of the case study ... 241
Figure A4.31: The activity diagram modeling the sub-process of GTM ... 242
Figure A4.32: The activity diagram modeling the sub-process of Supplier1 ... 243
Figure A4.33: The activity diagram modeling the sub-process of Supplier2 ... 243
Figure A4.34: The activity diagram modeling the sub-process of DistC1 ... 243
L
IST OFT
ABLESTable 1.1: Comparison of the three major simulation formalisms (interpreted from (Heath et al. 2011)) ... 37
Table 1.2: Review of modeling frameworks for simulation ... 41
Table 1.3: Review of common SC risk definitions in the literature ... 44
Table 1.4: Some common literature’s definitions of SC risk management ... 45
Table 1.5: Common SC risk management process steps in literature ... 45
Table 1.6: Literature methods for SC risk identification ... 47
Table 1.7: SC risk categories in literature ... 48
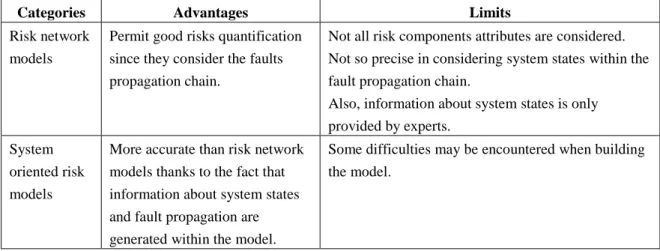
Table 1.8: Advantages and limits of SC risk assessment models ... 52
Table 1.9: Review of simulation based risks assessment literature ... 55
Table 1.10 : Supply risk mitigation approaches and related strategies (proposed by (Chopra & ManMohan 2014)) ... 57
Table 1.11: Mitigation approach integration in simulation (proposed by (Talluri et al. 2013)) ... 58
Table 2.1: Simulation software evaluation by SC practitioners (proposed by (Cimino et al. 2010)) ... 73
Table.3.1: The library of Operations ... 91
Table 3.2 Retained inputs and ouputs from SCOR for the PRODUCE Operation ... 92
Table 3.3: Internal variables used in the PRODUCE Operation algorithm ... 95
Table 3.4 : The receiveAndReleaseProductionOrders method ... 95
Table 3.5: The determineTheQuantityToProduce method ... 96
Table 3.6 : The reserveResource method ... 96
Table 3.7: The verifyComponentsAvailability method ... 97
Table 3.8: The consumeComponents method ... 97
Table 3.9: The AdjustTheManufacturedProductInventory Method ... 98
Table 3.10: The releaseResource method... 98
Table 3.11: The notifyAboutExecution method ... 99
Table 3.12: Correspondence Between the Maker Role and the SCOR process elements ... 100
Table 3.13: Actors’ roles’ configuration ... 102
Table 3.14: Excerpt of Deliver operations relative to the manufacturer (D) ... 103
Table 3.15: SC Risks Literature Crosschecked With The Proposed Risk Categories (Saleh Ebrahimi et al.(2012)) ... 105
Table 4.1: The translation of the behavior modeling constructs ... 112
Table 4.2: Declaration of a part of the internal variables of the Produce operation ... 113
Table 5.1: Example of the translation of some of the instances of Truck Much structure ... 141
Table 5.2: Resources settings ... 144
Table 5.3: Transportation Resources settings ... 144
Table 5.4: Transfer Resources settings... 145
Table 5.5: Buffers settings ... 145
Table 5.6: Theoretical calculation of the outputs of the Issue module ... 147
Table 5.7: Adopted performances metrics ... 147
Table 5.8: Resources settings ... 149
Table 5.9: Transportation Resources settings ... 149
Table 5.10: Transfer Resources settings ... 150
Table 5.11: Buffers settings ... 150
Table 5.12: Demand Arrivals (Final client’s demands) ... 150
Table 5.13: risk experiments ... 151
Table 5.14: Results for the base scenario ... 152
Table 5.16: Results for the supply cease (R2) ... 153
Table 5.17: Results for an error in the purchase order quantity (R3) ... 154
Table 5.18: Results for combination of an error for purchase order quantity and a supply cease (R4) ... 154
Table 5.19: Results for combination of a supply delay and a supply cease (R5) ... 155
Table A1.1: Retained inputs and outputs for the ISSUEMATERIAL Operation from the SCOR model ... 174
Table A1.2: The Internal Variables Of The ISSUEMATERIAL Operation algorithm ... 177
Table A1.3: Retained Inputs And Outputs From The SCOR Model For The TEST Operation ... 180
Table A1.4: Internal variables used in the algorithm of the TEST Operation ... 183
Table A1.5: Retained Inputs and Outputs From The SCOR Model For The PICKANDPACK Operation ... 186
Table A1.6: The internal variables used in the algorithm of the PICKANDPACK Operation ... 189
Table A1.7: SCOR retained inputs and outputs for the LOADVEHICLE Operation ... 193
Table A1.8: The internal variables of the algorithm of the standard Mode of the LOADVEHICLE OPERATION ... 196
Table A1.9: Retained Inputs and Outuputs From The SCOR Model For The SHIPPRODUCT Operation ... 199
Table A1.10: Internal variables used in the algorithm of the standard mode of the SHIPPRODUCT Operation 201 Table A1.11: Retained Inputs and Outuputs From The SCOR Model For The Operation RECEIVEPRODUCT ... 203
Table A1.12: Internal variables used in the algorithm of the standard mode of The RECEIVEPRODUCT Operation ... 206
Table A1.13 : Retained inputs and outputs for the VERIFY Operation from the SCOR model ... 209
Table A1.14: Internal variables used in the algorithm of the standard mode of THE VERIFY Operation ... 211
Table A1.15 : Retained Inputs and Outuputs From The SCOR Model For The TRANSFER Operation ... 215
L
IST OFA
CRONYMS SC: Supply Chain,SCM: Supply Chain Management, SCRM: Supply Chain Risk Management, SCOR: Supply Chain Operations Reference, ABS: Agent Based Simulation,
DES: Discrete Events Simulation, SDS: System Dynamics Simulation, SysML: Systems Modeling Language, UML: Unified Modeling Language,
L
IST OF CONVENTIONS“ProcessElement”: The names of the SCOR process elements are given in bold characters
between inverted commas.
OPERATION: The name of each operation we propose for the library is put in uppercase. PropertyNames: The properties names of the proposed blocks are put in italic letters. BlockName: The SysML block names have always the first letter in uppercase.
he supply chains (SC) keep evolving over the years. They change in configuration, in size, in geographic extent and in the way they are managed. New kinds of SCs appear thanks to technological development and globalization. The emergence of a new product with new characteristics changes the SC configuration. For instance, Dell modular computers are partially assembled by users. The development of recycling technology resulted in the appearance of reverse SCs. The development of safe electronic payment platforms opened the way for cyber supply chains such as Amazon. Supply chains may also disappear due to a lack of demand, such as the disc storage technology SCs. The first SCs analysis studies appeared with consultants who wanted to communicate the need to develop better ways to manage resources and assets. As revealed by (Ellram & Cooper 2014) the first definition for SC management was primarily written more than 30 years ago, first appearing in the practitioner literature in 1982. This uncovered to academicians the need to develop solutions for this issue. The debate about SC management is still open and still growing for academia to keep with the development of SCs. As revealed by (Ellram & Cooper 2014) the Wall Street Journal recently reported that more universities are adding SCM majors and increasing their programs as demand for supply chain management (SCM) majors grows among employers.
For a long time, the focus of SCM was on improving the cost efficiency of SCs as stated by (Christopher & Lee 2004). Many approaches were developed which are concerned with reducing the cost across the entire supply chain and giving companies the opportunity to better compete against other players in the market as stated by (Manuj et al. 2008). SC practitioners make a lot of effort on the implementation of cost effective management techniques. An example of such approaches is Lean management, developed by Toyota in Japan. The wide adoption of these approaches brought more challenges. As stated by many researchers (See for instance, (Enyinda et al. 2008), (Pfohl et al. 2013);(Tuncel & Alpan 2010)) the potential benefits in the shape of decreased inventory levels, shorter lead times, minimal delays and material buffers have made supply chains more vulnerable to local and global disturbances.
The vulnerability is inherent to the dynamic development of SCs and their increased complexity. As revealed by (Jüttner 2005) through their exploratory study, 44% of the responding companies expect the vulnerability of their supply chains to increase within the next five years. (Simchi-levi et al. 2015) provide a set of factors that increases the operational vulnerability of SCs in automotive industry. Among the provided factors, we cite the measures taken by companies to maximize the operational effectiveness. These measures result in more dependency to more concentrated suppliers. Another factor stated by the authors is the company measures for decreasing supply cost through only concentrating on the sources that provide more fiscal incentives and that are more capable of decreasing their products costs. This pushed suppliers to constraint their production capacity and to outsource in emerging unstable markets. Another cited factor is the lack of standardization in products that makes the manufacturing capability concentrated in few suppliers.
(Thun & Hoenig 2011) explain how outsourcing and offshoring increase SC vulnerabilities. They state that outsourcing raises the amount of interfaces and the dependency between companies and the offshoring increases the complexity and the exposition to failures of cross-national connections. Other vulnerability factors were highlighted by (Trkman & McCormack 2009) such as market and technological turbulences. The market turbulence arises from the
heterogeneity and the rapid changes in the composition of customers and their preferences, while the technological turbulence refers to the degree to which technology changes over time within an industry and the effects of those changes on the industry.
In the last years, many supply chains were subject to disruptions and witnessed negative impacts on their performance. According to a study made by (Simchi Levi et al. 2013) on a sample of 209 companies with a global footprint, disruptions incurred negative impact on the business financial performance of many companies. In fact, 54% of the companies said that sales revenue was negatively affected and 64% of them suffered a decline in their customer service levels. Across all the operational KPIs examined, at least 60% of the enterprises reported a 3% or higher loss of value. Furthermore, based on their exploratory quantitative survey, (Hendricks & Singhal 2005) conclude that firms do not recover quickly from the negative effects of disruptions. A famous example of a SC disruption that highly impacted its relative SC is the Ericsson case. As described by (Norrman & Jansson 2004) a lightning bolt hit an electric line in New Mexico which caused a fire at a production “clean rooms” cell of Ericsson’s supplier plant. This fire destroyed the production cell equipments and interrupted the shipment of radio-frequency chips to Ericsson. Since Ericsson had only one supplier of this kind of chips, the company lost its capability to sell and deliver one of its key consumers during its booming “market window”. Many months of mobile phone production were lost which pushed Ericsson’s to decide to withdraw from the mobile phone business. The cost of this supply disruption was calculated as approximately $200 million.
Supply chain managers encounter failures in managing their risks. As revealed by (Hult & Craighead 2010) companies like Boeing, Cisco, and Pfizer encountered unexpected losses and/or expenses of more than $2 billion due to ineffective supply chain risk management (SCRM) decisions in 2001. (Chopra & ManMohan 2014) state that surveys have shown that managers do little to prevent incidents since the solutions to reduce risks are not weighed against SC cost efficiency. Also, a recent study by (Marchese & Paramasivam 2013) from Deloitte consulting firm on 600 Supply Chains and top executives revealed that many companies do not master SC risk management. In fact, only 33% used risk management approaches to proactively and strategically manage supply chain risks based on their operating environment conditions and 45% felt that their risk management was only somewhat effective or not effective at all. Many reasons can explain this. The major reason is the low implementation degree of the instruments of supply chain risk management (Jüttner 2005). Even if they are implemented many companies have an immature risk management process. In fact, as revealed by a the study of (Simchi Levi et al. 2013) 59 % out of the investigated companies have immature processes in place to effectively address incidents. Their SCRM processes are neither proactive nor flexible. Another reason is the fact that companies misunderstand SC risk management. As discussed by (Jüttner 2005) SCRM is still understood in many industries primarily as a company-specific task, or companies have not only to focus on their risks but also the risks of their partners. This is what makes SCRM a more difficult task, since dealing with an individual risk and forgetting the inter-connections can end up exacerbating another as stated by (Chopra & ManMohan 2014). Authors argue that actions taken by any company in the supply-chain can increase the risk for any other participating company. Authors highlight that another failure of SCRM in companies is the consideration of recurrent, low-impact risks while ignoring high-impact, low-likelihood risks.
Recently encountered SC failures such as the ones reported above brought the issue of SCRM to the forefront. The awareness about having effective SCRM processes increases every day within the industry. James Steele, the program director of SCRM of CISCO, the global information, and communication Technology Company, explained, in an interview published by (U.S. Resilience Project 2011), how his company’s perception of SCRM evolved. He said: “In the past, supply chain operations were “cared-about” only when things went wrong. The focus was not on increasing the business, but on keeping the trains running on time. Over the past 15 years, there has been a sea of change in supply chain management. It has become a strategic capability for many companies, and it continues to get the resources, visibility and focus needed to manage as a platform for growth. For Cisco, this “change” has meant an increase in risk intelligence and agility on supply chain resiliency capabilities, which are a key element in this evolution”. Similarly, based on their empirical study of 142 French companies’ managers, (Lavastre et al. 2012) suggest integrating SCRM as a management function that is inter-organizational in nature and closely related to strategic and operational realities of the activity in question.
SC practitioners need to be assisted for improving their SCRM. Even if many risk management approaches exist and are part of the toolbox of managers they still do not cover all requirements.
The main issue treated in this Ph.D. is assisting the SC practitioners using simulation for analyzing the risks threatening their SCs, through promoting a quicker and easier construction of simulation models and through enabling risk scenarios’ experimentation.
We will conduct an analysis of the relevant literature for identifying why the available tools do not satisfy needs of the SC practitioners. More precisely, we will investigate why the usage of simulation for risk analysis is still modest and what are the difficulties to overcome. Hence, we start by investigating the current analysis methods for SCs with a focus on the frameworks proposed for simulation. We identify a set of requirements for an easy to use and an effective framework. Then we investigate the particularities of the SC risk management domain with a focus on the SC risk analysis methods.
The main proposition of this thesis is a framework for modeling and simulating risks in SCs. The framework integrates a metamodel and modelling elements libraries developed with SysML to represent SCs. It is associated with a translation guideline enabling the construction of simulation models using the defined metamodel.
The work is documented in this disseration as follows:
In the first chapter we provide a literature review about SC analysis, modeling and risk management, we identify the literature gaps and we cite the main research questions resolved in this dissertation. In the second chapter, we describe the adopted methodology for the development of the framework. In the third chapter, we introduce the part of the framework enabling the creation of conceptual models for SC. In the fourth chapter we introduce the simulation framework and the methodology for translating the conceptual model into a simulation model and for experimenting risk scenarios. The fifth chapter presents a case study exemplifying the deployment of the proposed approach. In the last chapter, we summarize findings and we discuss perspectives.
C
HAPTER
1
C
HAPTER1
:
L
ITERATURE REVIEWS
UMMARYhen dealing with the analysis of risks in SCs, two major fields are called. The first one is SC analysis and the second one is SC risk management.
In this chapter we provide a state of the art about those two fields. Namely, we investigate the various methods used for general purpose SC analysis and more specifically for analyzing risks. We provide a snapshot of the current developments of the two fields and we highlight the literature gaps.
Concerning SC analysis, we show that modeling the SC is of prime importance to enable catching its complexity and that the selected modeling method may restrict the reachable analysis results. We review descriptive methods such as the SCOR reference model and quantitative methods that are often specialized for optimization or simulation. Descriptive approaches are easy to handle for SC practioners but provide poor analysis features while quantitative approaches give interesting analysis results but at a high appropriation cost. We sketch an opportunity to merge modeling approach based on descriptive principles with quantitave modeling to obtain tangible results. Namely, we show that performing simulation of SC with discrete event simulation techniques is particularly adapted. Nevertheless, the literature shows that these simulation techniques are costly to set up and that a structured modeling approach may be of interest.
The second part of this chapter discusses the treatment of risks within SC. Based on the literature analysis we show that the concept of risk has been tackled with various visions in the past. Several taxonomies of risks threatening SC have been used, each one implying a way of regarding risk (for example focus on risk perimeter, origin or magnitude). Therefore, to clarify our purpose, we present the retained definition of risk and precise the vision of the risk analysis process for SCs. We discuss and adopt a risk classification based on risk impacts and oriented to SC simulation.
The chapter is presenting our roadmap to contribute to SC risk management, namely to support the deployment of simulation approaches within the risk assessment phase of the risk management process.
I
NTRODUCTIONThis first chapter of the dissertation presents the state of the art on the current method and tools utilized form SC analysis. Through this review, we want to highlight the current tendencies on SC modeling, SC analysis and to highlight the problems addressed. SC analysis is very vast, therefore, we give an overview on research on SC and make focuses on specific areas to which we want to contribute. These topics are on modeling and simulating SCs for risk analysis.
In section 1.1, we present the current techniques developed for SC analysis, namely, we investigate the most popular approaches for modeling SCs. We present the descriptive methods aiming at describing the flows, the stakeholders and the relationships existing on the SCs. We review, for example, SCOR model and Value Stream Mapping. We also present
quantitative approaches such as optimization methods and simulation. We discuss the pros and cons of each technique and then we put a stress on simulation frameworks as it is one priority of our contribution. By doing so, we want to rise important requirements for proposing a valuable modeling and simulation framework for SC analysis.
Section 1.1 places the general concepts used for SC study. We then explore the specificities of risk analysis. In section 1.2, we detail the field of SC Risk Management (SCRM). We first propose some framing definitions based on literature analysis. Then, we detail SCRM process through the 4 phases: risk identification, risk assessment, risk treatment and risk monitoring. When analyzing the risk identification literature, we propose the risk categorization that is adopted in this dissertation. Finally, in section 1.3, we position our work on the global map of SCRM and propose our research objectives on the basis of the given literature review.
1.1
L
ITERATURE REVIEW ABOUT SUPPLY CHAINS ANALYSIS ANDMODELING
SC analysis is an important task that most of the companies have to conduct. It has the following goals: identify weaknesses and strengths of the current SC (prioritize markets, prioritize products, etc.) and predict their future evolutions, evaluate the various improvement possibilities, define best parameters and configurations (required capacity, inventory security level, inventory replenishment level, best partners, etc.). Supply chain analysis is a well-studied subject in the literature. In this section, a literature review on supply chain analysis is conducted. We investigate the different methods used to analyze the SC, from descriptive methods to quantitative methods
1.1.1 SUPPLY CHAIN ANALYSIS METHO DS
SC analysis is the group of tasks that aim to understand and evaluate SCs. We call SC a network of organizations that are involved, through upstream and downstream linkages, in the different processes and activities that produce value in the form of products and services in the hands of the ultimate consumer, as defined by (Christopher & Lee 2004). The SC analysis is a prerequisite for SC management. It helps to understand the relations between the SC elements and to identify the way by which the parameters impacting the SC performance need to be modified in order to achieve goals. (Bullinger & Kühner 2010) state that a profound and continuous analysis of the entire SC is necessary to achieve SC excellence. The authors argue that a suitable SC analysis needs to include the definition of performance units, the measurement of holistic performance with the ability to drill-down results and the interpretation of results in term of performance. An important task widely integrated into SC analysis methods is to model the studied system. In fact, as stated by (Bullinger & Kühner 2010) the major research and development activities in the area of supply chain analysis have resulted in modeling concepts. The purpose of modeling is to understand, analyze, and hopefully solve the problems that might appear in the problem domains as stated by (Kasi 2005). Modeling enables better SC decisions by helping firms to highlight the synergy of inter-functional and inter-organizational integration and coordination across the supply chain (Min & Zhou 2002).
We identify two categories of methods used for SC analysis:
Descriptive methods: They propose the way to collect information about a set of metrics
and the way to evaluate their evolution. The metrics might be textual or quantitative. Usually, the methods integrate calculation formulas and provide suggestions and best practices in order to react against a given evolution.
Quantitative methods: They propose a way to design a model to capture the dynamics of
the SC and the way to analyze it. They often result in mathematical or computational models. Unlike the descriptive methods, the resulting models can be “executed” or “resolved” in order to evaluate the performance of the SC.
1.1.1.1 DESCRIPTIVE METHODS
Various descriptive methods are proposed by researchers and are used by SC practitioners. A set of these methods provides textual taxonomies to describe the SC parts (A generic description of SC domain knowledge), in order to facilitate modeling, analysis and performance evaluation. Examples of these methods are supply chain operations reference (SCOR), value reference model (VRM) and value stream mapping (VSM). The methods generally integrate both qualitative and quantitative prescriptions. The qualitative prescriptions address the way to describe the performed functions, to select the performance measures, to gather related information and to analyze them. The quantitative prescriptions address the way that some of the metrics need to be calculated. The calculation is usually simple (e.g., SCOR provides the formula “[Total Perfect Orders] / [Total Number of Orders )”
to calculate the “RL1.11 Perfect Order Fulfillment” performance metric).
SUPPL Y CHA IN OPE RA T IO N S RE F E RE N CE (SCOR)
A well-known descriptive method is SCOR (Supply chain Council (2012)). The SCOR model provides a framework for measuring the performance of the SC at different levels: From top to bottom, starting with a business process to end with the SC process elements or operations. SCOR provides performance measures (e.g. Return on Working Capital) that enable linking strategic objectives of SC to operational ones (e.g. Produce and test cycle time). The framework is based on a generic description of SC operations that start from the process (plan, deliver, make, source and return) to end up with subprocess elements. This is to permit comparability (to compare different supply chains and different supply chain strategies) and root cause analysis (e.g., to find the root cause of a degraded value of Perfect Order Fulfillment metric). The framework supports the design of the SC by providing a set of best practices mapped into the process elements. For example, the “Perfect Order Fulfillment” metric provides a good indication on how well every facet of a supply chain (planning, sourcing, manufacturing, and delivery) are tuned and coordinated to meet customer demand. Furthermore, the SCOR model contains the Perfect Order Fulfillment metric definition, calculation methods, and best practices. Managers can implement one of the proposed best practices that fits with the studied gap for correction.
SCOR provides a three-step process that describes how performance management needs to be handled: Performance measurement, performances analysis, and improvement. In each of
1
these steps, the manager needs to use concepts provided by SCOR such as SCOR metrics. This process is shown in figure 1.1. (Bullinger & Kühner 2010) propose an approach based on SCOR performance metrics. This one incorporates a measurement methodology integrating bottom-up and top-down performance measures as a hybrid balanced measurement approach. The measurement approach integrates SCOR metrics into the proposed supply network scorecards to form an integrated measurement system. Different stages of the SCM activities, as well as different perspectives on the value creation process are covered by the measurement system by following the principles of a balanced measurement method introduced in (Sellitto et al. 2015).
FIGUR E 1.1: SCOR PER FORM ANCE M ANAGEM ENT PR OC ESS (SE2) (PROVIDED BY SCC)
VA L U E ST R E A M MA P P I N G ( V S M )
Another popular and highly employed method is the Value stream mapping (VSM). VSM is a lean-management method that may be used to analyze the current state of a SC and to design a future state described as a value stream. A value stream is an end-to-end set of activities that are collectively valuable to a customer as stated by (Brown 2009). The customer may be the ultimate, external customer or an internal user of the value stream. As stated by (Hines & Rich 1997), the difference between the traditional supply or value chain and the value stream is that the former includes the whole activities of all the companies involved, whereas the latter refers only to the specific parts of the firms that actually add value to the specific product or service under consideration. The SC response matrix, one of the famous VSM tools, is based on a mapping approach that seeks to portray in a simple diagram the critical lead-time constraints, as stated by Taylor et al. (2001). The tool permits the analysis of the relation between lead times and the inventory level in different steps of the SC. Figure 1.2 provides an illustration of this tool. The horizontal axis in response matrix represents a cumulative lead-time for the operations plan and transfer in the supply chain. The vertical axis represents cumulative inventory in days in every stage of the supply chain.
FIGUR E 1.2 : EXAM PLE OF A SC RESPONSE M ATR IX (SOURC E (Alaca & Ceylan 2011))
OT H E R D E S C R I P T I V E M E T H O D S
Other descriptive methods are proposed in the literature. Some of them propose an approach similar to the SCOR model. Namely, the VRM approach defines a textual description of the operations performed within the SC (Brown 2009). Some methods focus on the procedure of performance metrics measurement and analysis (for example see (Cai et al. 2009) while others focus on facilitating building SC descriptive models (for example see (Kim & Rogers 2005)). For instance, (Cai et al. 2009) propose a systematic approach for measuring the performance of SCs that integrates a descriptive part consisting of the definition of the relationships among SC metrics. The description of the intricate relationships among SC KPI enables analyzing the deviations leading to the non-achievement of SC goals.
Another descriptive method is the one proposed by (Kim & Rogers 2005). The method defines a procedure for building SC object-oriented models using the unified modeling language (UML). The procedure includes five steps to define different views of the model to be built (Vision view (defines visions and goals), function view (functional domains and functional requirements), process view (defines business processes), structure/static view (defines resources and organization), behavior/dynamic view (interaction analysis)) using a set of classes such as the process class. Authors propose two steps to integrate business rules into the model as follows: Identifying business rules and expressing them in the object-oriented model.
SUM M A RY O F DE SCR IPT I V E M E T HO DS
Thanks to the literature review of the descriptive analysis methods, we find that these methods focus on three aspects:
First, providing a detailed description of the SC components with the associated
performance metrics (See, for example, SCOR, VRM, and VSM).
Second, providing a way to measure the performance metrics and the way to analyze them
(See, for example, (Cai et al. 2009)).
Third, providing a procedure to build SC models (see, for example, (Kim & Rogers 2005)).
The first aspect has the benefit of enhancing the understanding of SC managers about their SCs through clarifying the various functions and also has the benefit of providing consistent performance metrics for measuring the SC attributes. In fact, the taxonomy proposed by SCOR provides SC practitioners with a common framework that can easily be used to compare and communicate about the SC measured performances. SCOR is stated (Albores et
al. 2006) to become a de facto standard that has gained considerable popularity with practitioners.
The second aspect has the benefit of improving the accuracy of the way by which the manager defines metrics, measures their values and interprets their evolution.
The third aspect has the benefit of enhancing the understanding of the modeled system. In fact, as stated by (Robinson 2004) 50% of the benefits of analysis can be obtained only by modeling the system, since, while modeling, modelers gain a thorough understanding of the system.
1.1.1.2 QUANTITATIVE METHODS
The second type of SC analysis methods is the quantitative methods. They are based on the analysis of the outputs of the computational experiments for a model describing the SC dynamics. Different from the descriptive methods, the quantitative methods provide a model that does not only serve to enhance understanding about the SC and measure current performance but may also serve to make computational experiments to have quantitative results. We distinguish two main types of quantitative models widely used in literature. They are the optimization models and the simulation models. Other models exist but more specific for some SC functions and are not discussed here (e.g. forecasting models). In next sections, we investigate the two main types of quantitative models (optimization and simulation) with a focus on simulation models since they are adopted in this Ph.D. work. Optimization models are used to solve a given decision problem. They have been well studied in operations research over the last 50 years and they have been extensively used in SC modeling and analysis. We do not have the ambition to review this extensive literature in detail in this thesis since there are already numerous comprehensive literature reviews on this issue. Recent literature reviews focus on a given current prominent field rather than tackling the use of optimization models in SC analysis in general. Hence, as stated by (Asgari et al. 2016) the current prominent fields are risk management, sustainability, and globalization. (Fahimnia et al. 2015) provide a literature review of the quantitative models used for SC risk management. (Snyder et al. 2016) provide a literature review of the models used for disruption modeling. They organized the reviewed works into six categories: evaluating supply disruptions, strategic decisions, sourcing decisions, contracts and incentives, inventory and facility location. (Seuring 2013) provides a literature review of modeling approaches for sustainable SC management. The author highlights a weak line among papers using multi-objective programming which is the focus on a single company/supply chain. Also, (Brandenburg et al. 2014) provide a literature review on the usage of quantitative models for sustainable SC management. The authors state that managerial decision-making is often supported by optimization methods. (Matinrad et al. 2013) highlight some of the trends in SC network modeling such as the increased consideration for uncertainty and multi-echelon/stage supply chains, while a decreased interest for multi-period modeling.
To explain how optimization models are used for SC analysis, we present some examples of use in SC risk analysis since this field is the focus of our Ph.D. work. In fact, (Sawik 2015) propose a stochastic MIP model for a multi-stage supply chain under disruption risks. The