European Journal of Orthodontics 36 (2014) 67–73 doi:10.1093/ejo/cjt005
Advance Access publication 4 March 2013
© The Author 2013. Published by Oxford University Press on behalf of the European Orthodontic Society. All rights reserved. For permissions, please email: [email protected]
Sample size in orthodontic randomized controlled trials: are
numbers justified?
Despina Koletsi*, Nikolaos Pandis** and Padhraig S. Fleming***
*Department of Orthodontics, School of Dentistry, University of Athens, Greece, **Department of
Orthodontics and Dentofacial Orthopedics, Dental School/Medical Faculty, University of Bern, Switzerland, and ***Barts and The London School of Medicine and Dentistry, Institute of Dentistry, Queen Mary University of London, UK.
Correspondence to: Nikolaos Pandis, 29 P. Zafiropoulou Street, Corfu 49100, Greece. E-mail: [email protected]
SUMMARY Sample size calculations are advocated by the Consolidated Standards of Reporting Trials (CONSORT) group to justify sample sizes in randomized controlled trials (RCTs). This study aimed to analyse the reporting of sample size calculations in trials published as RCTs in orthodontic speciality journals. The performance of sample size calculations was assessed and calculations verified where possible. Related aspects, including number of authors; parallel, split-mouth, or other design; single- or multi-centre study; region of publication; type of data analysis (intention-to-treat or per-protocol basis); and number of participants recruited and lost to follow-up, were considered. Of 139 RCTs iden-tified, complete sample size calculations were reported in 41 studies (29.5 per cent). Parallel designs were typically adopted (n = 113; 81 per cent), with 80 per cent (n = 111) involving two arms and 16 per cent having three arms. Data analysis was conducted on an intention-to-treat (ITT) basis in a small minority of studies (n = 18; 13 per cent). According to the calculations presented, overall, a median of 46 participants were required to demonstrate sufficient power to highlight meaningful differences (typically at a power of 80 per cent). The median number of participants recruited was 60, with a median of 4 participants being lost to follow-up. Our finding indicates good agreement between pro-jected numbers required and those verified (median discrepancy: 5.3 per cent), although only a minor-ity of trials (29.5 per cent) could be examined. Although sample size calculations are often reported in trials published as RCTs in orthodontic speciality journals, presentation is suboptimal and in need of significant improvement.
Introduction
Randomized trials are considered the gold standard for assessment of the efficacy and safety of interventions and are established in the orthodontic literature. The precedence of randomized studies relates to the potential to limit bias and confounding effects, which are more likely in obser-vational studies and non-randomized trials. However, ran-domized trials are expensive, as well as being time and labour intensive; it is imperative, therefore, that studies have adequate power to demonstrate a clinically important treatment difference if such a difference exists, while being able to correctly conclude that no such difference exists as indicated (Machin et al., 1997; Schulz and Grimes, 2005). Notwithstanding this, unjustifiably large studies carry additional expense, risk wasting resources, and may even be unethical, as patients can be unnecessarily exposed to potentially ineffective therapy.
Studies with small sample sizes tend to be less reliable and are more likely to be inconclusive due to inadequate statistical power (Freiman et al., 1978; Altman, 1980;
Wooding, 1994; Halpern et al., 2002). There is a close rela-tionship between power and sample size; as sample size
increases, study power also rises. Recruitment of an appro-priate sample involves a trade-off between power, feasibil-ity of the study, ethics, and credibilfeasibil-ity of the findings. In view of these issues, it is recommended practice to include a sample size calculation and justification in both research protocols and in reports of randomized trials (Schulz et al., 2010a, b).
Power calculations should be considered during the design stage of clinical trials, being of little value after the trial is conducted. At the end of the trial, power may be assessed by examining the precision of the estimates by observing the width of associated confidence intervals. The chief components of the calculation include power (typically 80–90 per cent), type I error or alpha (usually 0.01 or 0.05), assumptions in the control group (including mean response and variance), and expected treatment effect. Assumptions pertaining to the control group are usually predetermined based on published results or piloting, with the expected treatment effect tantamount to a clinically meaningful effect. However, incorrect assumptions of expected treatment effects and their variance at the design stage may lead to insufficient power (Vickers, 2003; Schulz and Grimes, 2005). A study designed to detect a clinically
important difference with a power of 80 per cent assumes an 80 per cent chance of correctly observing a difference if such a difference exists. Conversely, it also assumes a 20 per cent chance of failing to identify a difference (false negative) when such a difference does exist. Allowing a small likelihood (10–20 per cent) of a false-negative outcome (type II error or beta) is unavoidable because to guarantee 100 per cent power would necessitate an infinite number of participants. Type I error (or alpha) refers to false-positive results and indicates a willingness to accept a 5 per cent (P = 0.05) chance of observing a statistically significant difference when no such difference exists between the treatment groups.
The aim of this study was to assess the quality of report-ing of sample size calculations in trials published as RCTs in eight leading orthodontic journals, to ascertain the num-ber of participants typically recruited to clinical trials in orthodontics, to assess the accuracy of calculations, and to identify factors associated with correct performance of sample size calculations in orthodontic speciality journals.
Materials and methods
Reports of randomized controlled trials in eight lead-ing orthodontic journals durlead-ing a 20-year period up to September 2012 were accessed by two authors (DK, PSF). Journals included were American Journal of Orthodontics and Dentofacial Orthopedics (AJODO), Angle Orthodontist (ANGLE), European Journal of Orthodontics (EJO), Orthodontics and Craniofacial Research (OCR), Australian Orthodontic Journal (AOJ), Journal of Orofacial Orthopedics (JO Orthop), Art and Science of Orthodontics and Dentofacial Enhancement (formerly World Journal of Orthodontics; WJO), and Journal of Orthodontics (JO). Relevant articles were hand-searched from the chosen jour-nals. Two authors (DK, PSF) screened the titles and abstracts of potentially relevant articles. A range of randomized tri-als, including those with two or more arms, parallel group, factorial, cluster, and crossover designs were all included. Follow-up studies of earlier reports were omitted, however.
The full reports and any supplementary material for all selected papers were accessed. A standard data collection form was piloted by 2 authors (DK, PSF) on 10 selected papers. Details of the a priori sample size calculation, as reported in the Materials and methods section, were recorded. In particular, the conduct of a sample size cal-culation was noted. If conducted, the target sample size, number of participants recruited, number of participants lost to follow-up, type of analysis (intention-to-treat or per-protocol basis), and details of the power calculation includ-ing power, type I error, assumptions in the control group (standard deviation for continuous outcomes, and pro-portion of events for dichotomous and time-to-event out-comes), and the expected treatment effect (mean difference
for continuous outcomes, and difference in the proportion of events in the treatment group for dichotomous and time-to-event outcomes) were recorded. Additional general charac-teristics recorded included the following:
1. Single- or multi-centre study (binary): Assessed by affiliation details and supplementary information on the location of the study, as described in the Materials and methods section.
2. Number of authors in the publication.
3. Geographical area: The geographic region of the first author was recorded and categorized as Europe, Americas, or Asia/other.
4. Statistician/methodologist involvement (binary): Inferred from author affiliations.
5. Statistical significance (binary): Assessment of signifi-cance or otherwise.
Sample size calculations for each article reporting sufficient data to allow replication were repeated. Where only alpha val-ues were omitted, an alpha (α) risk of 0.05 with a two-tailed test to replicate the calculation was inferred. Sample size calculations were replicated with statistical software using the sampsi and stpower family of commands (Stata 12.1, Statacorp, College Station, Texas, USA). For articles where sample size recalculation was feasible, the standardized dif-ference (per cent) between the actual and estimated sample sizes was calculated according to the following formula:
Sample size used Sample size recalculated Sample size use
−
dd 100× (1)
Statistical analysis
Descriptive statistics were obtained for the total number of articles identified in each journal, location, number of researchers, and other characteristics, as well as conduct of sample size calculation in individual studies. Chi-square test and Fisher’s exact test were used as required to test the association of trial characteristics such as journal, conti-nent of publication, number of authors, design, number of research centres and arms, significance of results, and use of intention-to-treat (ITT) or other analysis, with sufficient reporting or otherwise of sample size calculation details. No further statistical analyses were undertaken because of the small number of reports with adequate sample size calcu-lation details. All statistical analyses were conducted with statistical software (Stata 12.1, Stata Corp, College Station, Texas, USA).
Results
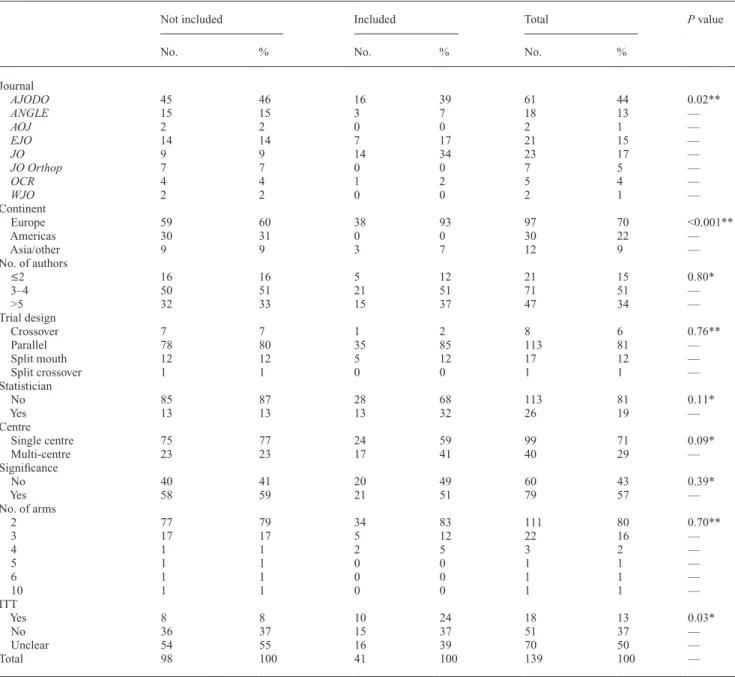
A total of 139 eligible RCTs were identified in eight leading orthodontic speciality journals (Table 1, Figure 1). The highest percentage of RCTs were published in AJODO (n = 61; 44 per cent), with the bulk of the remaining studies
published in JO (n = 23; 17 per cent), EJO (n = 21; 15 per cent), and ANGLE (n = 18; 13 per cent). The majority of studies were undertaken in a single centre (n = 99; 71 per cent); most were published by European researchers (n = 97; 70 per cent), with parallel designs predominating (n = 113; 81 per cent). Eighty per cent (n = 111) of studies involved two arms, 16 per cent (n = 22) had three arms, whereas only 4 per cent had more than three groups. Statisticians or methodologists were involved in authorship in 26 studies (19 per cent), with a slight majority of studies
reporting statistically significant main outcomes (n = 79; 57 per cent). Data analysis was conducted on an ITT basis in a small minority of studies (n = 18; 13 per cent). In half of the analysed RCTs (n = 70), it was unclear whether ITT or per-protocol analyses were intended.
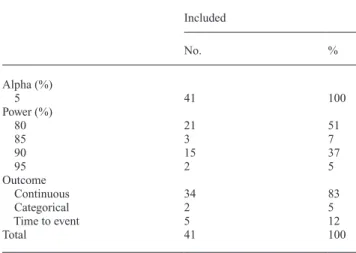
Sufficient information to permit verification of the sample size calculation was provided in only 41 (29.5 per cent) trials (Table 2, Figure 2). A power of 80 per cent was used in most of these studies (n = 21; 51 per cent), whereas 90 per cent power was pre-specified in 15 studies (37 per cent). Table 1 Characteristics of the 139 included randomized controlled trials.
Not included Included Total P value
No. % No. % No. %
Journal AJODO 45 46 16 39 61 44 0.02** ANGLE 15 15 3 7 18 13 — AOJ 2 2 0 0 2 1 — EJO 14 14 7 17 21 15 — JO 9 9 14 34 23 17 — JO Orthop 7 7 0 0 7 5 — OCR 4 4 1 2 5 4 — WJO 2 2 0 0 2 1 — Continent Europe 59 60 38 93 97 70 <0.001** Americas 30 31 0 0 30 22 — Asia/other 9 9 3 7 12 9 — No. of authors ≤2 16 16 5 12 21 15 0.80* 3–4 50 51 21 51 71 51 — >5 32 33 15 37 47 34 — Trial design Crossover 7 7 1 2 8 6 0.76** Parallel 78 80 35 85 113 81 — Split mouth 12 12 5 12 17 12 — Split crossover 1 1 0 0 1 1 — Statistician No 85 87 28 68 113 81 0.11* Yes 13 13 13 32 26 19 — Centre Single centre 75 77 24 59 99 71 0.09* Multi-centre 23 23 17 41 40 29 — Significance No 40 41 20 49 60 43 0.39* Yes 58 59 21 51 79 57 — No. of arms 2 77 79 34 83 111 80 0.70** 3 17 17 5 12 22 16 — 4 1 1 2 5 3 2 — 5 1 1 0 0 1 1 — 6 1 1 0 0 1 1 — 10 1 1 0 0 1 1 — ITT Yes 8 8 10 24 18 13 0.03* No 36 37 15 37 51 37 — Unclear 54 55 16 39 70 50 — Total 98 100 41 100 139 100 —
AJODO, American Journal of Orthodontics and Dentofacial Orthopedics; ANGLE, Angle Orthodontist; EJO, European Journal of Orthodontics; OCR, Orthodontics and Craniofacial Research; AOJ, Australian Orthodontic Journal; JO Orthop, Journal of Orofacial Orthopedics; Art and Science of Orthodontics and Dentofacial Enhancement (formerly World Journal of Orthodontics; WJO); and JO, Journal of Orthodontics. ITT, intention-to-treat
analysis.
Continuous outcomes predominated in these studies (n = 34; 83 per cent), with relatively few having either time-to-event (n = 5) or categorical (n = 2) outcomes (Table 2). Based on the complete calculations presented in these 41 RCTs, a median of 46 participants were required to demonstrate sufficient power; however, a median of 60 participants was recruited in each study suggesting over-recruitment of 30.4 per cent to offset attrition. Overall, the median number of participants lost to follow-up was four (Table 3). The cut-off point for statistical significance (alpha) was set at 0.05 in all of these trials.
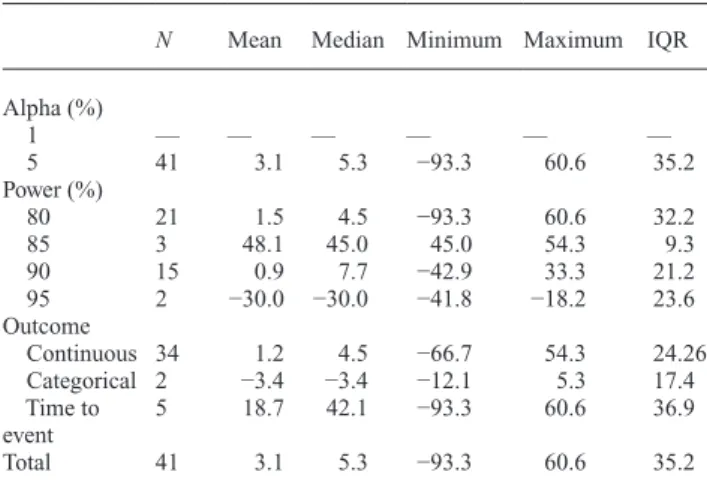
Sample size calculations were repeated in the 41 studies where it was possible to do so to assess their veracity (Tables 4 and 5, Figure 3); an overall median discrepancy of 5.3 per cent (per cent standardized difference) between presented
and recalculated sample sizes was found. Median percentage difference between the presented and recalculated sample sizes ranged from –93.3 to 60.6 per cent. Studies where data analysis was undertaken explicitly on an intention-to-treat or per-protocol basis had similar calculations, with discrep-ancies of 6.1 and 8.7 per cent, respectively. More accurate sample size calculations were found in studies with power of 80 per cent (4.5 per cent) than in those reported to have either 85 (45 per cent) or 95 per cent (–30.0 per cent) power. Discussion
The Consolidated Standards of Reporting Trials (CONSORT) group is clear that accurate and transparent reporting of the specifics of sample size estimation for RCTs is essential (Schulz et al., 2010a, b). This study is the first to analyse execution of sample size calculations in orthodontic journals. The overall results were disappoint-ing, with most studies (70.6 per cent) failing to present a complete calculation permitting the calculation to be verified. For the small number of trials (29.4 per cent) in which sample recalculation was feasible, there was good overall agreement between recruited and required samples. However, this leaves a lot of room for speculation about the remaining 70.6 per cent of the trials. Our results are compa-rable to a similar research conducted in six general medical
Figure 2 Bar graph showing frequencies of randomized controlled trials
(RCTs) justifying sample size calculations by year.
Table 3 Number of participants recruited, required, and
dropouts.
N Mean Median Minimum Maximum IQR
Recruited 41 70 60 12 187 26
Dropouts 41 9 4 0 50 11
Required 41 57 46 12 176 28
IQR=interquartile range
Figure 1 Flow chart of included studies.RCTs, randomized controlled
trials.
Table 2 Type of outcome, alpha level, and power level for RCTs
where sample calculations were shown and could be recalculated. Included No. % Alpha (%) 5 41 100 Power (%) 80 21 51 85 3 7 90 15 37 95 2 5 Outcome Continuous 34 83 Categorical 2 5 Time to event 5 12 Total 41 100
journals, which demonstrated correct performance of sam-ple size calculations in 34 per cent of studies, with sufficient data present to allow their replication (Charles et al., 2009). However, a similar study on surgical publications alluded to sample size estimation in just 19 per cent of studies (Ayeni
et al., 2012). Therefore, it is important that sample size cal-culations are presented more thoroughly both in dentistry generally and in orthodontics. Failing that, if sample size calculations continue to be unclear or unreliable, it has been suggested that their use should be discontinued (Bacchetti, 2002).
According to the complete sample size calculations obtained, the median number of participants required in
orthodontic research studies is 46. This number of subjects is generally realistic and achievable. It is impossible to speculate whether researchers genuinely arrived at these figures based on valid assumptions in the control group and truly important standardized differences. Clearly, however, there is a temptation for researchers to deduce a figure that is realistic, of reasonable cost and feasibility, yet of sufficient credibility to warrant publication of the research. It is known that sample size assumptions can be doctored when planning research studies, by retrofitting the effect sizes to the available sample; this technique has been referred to as ‘sample size samba’ (Schulz and Grimes, 2005). A limitation of the present study is that outcomes Table 4 Standardized percentage difference for each trial characteristic.
N Mean Median Minimum Maximum IQR
Journal AJODO 16 −6.1 3.5 −93.3 45.0 38.4 ANGLE 3 −0.5 0.0 −9.1 7.7 16.8 EJO 7 −9.2 0.0 −66.7 28.9 39.9 JO 14 19.6 16.1 −41.9 60.6 33.4 OCR 1 16.7 16.7 16.7 16.7 0.0 WJO — — — — — — AOJ — — — — — — JO Orthop — — — — — — Continent Europe 38 5.2 6.5 −93.3 60.6 32.8 Americas — — — — — — Asia/other 3 −23.4 −12.5 −66.7 9.1 75.8 No. of authors ≤2 5 −12.6 −9.1 −42.9 23.1 49.4 3–4 21 −0.3 4.0 −93.3 60.6 41.4 >5 15 13.2 8.7 −18.2 54.3 23.7 Trial design Crossover 1 0.0 0.0 0.0 0.0 0.0 Parallel 35 0.1 4.5 −93.3 54.3 24.2 Split mouth 5 25.1 42.1 −66.3 60.6 31.7 Split crossover — — — — — — Statistician No 28 6.7 8.7 −66.7 60.6 27.9 Yes 13 −4.6 3.0 −93.3 60.6 27.3 Centre Single centre 24 −2.3 4.3 −93.3 60.6 41.7 Multi-centre 17 10.8 8.7 −41.8 54.3 23.7 Significance No 20 −0.3 6.6 −93.3 60.6 53.0 Yes 21 6.4 5.3 −42.9 60.6 9.1 No. of arms 2 34 8.2 8.7 −93.3 60.6 28.9 3 5 −13.1 −12.5 −31.3 0.0 3.4 4 2 −42.3 −42.3 −42.9 −41.7 1.2 ITT Yes 10 3.3 6.1 −42.9 45.0 24.2 No 15 7.3 8.7 −41.8 54.3 35.2 Unclear 16 −0.9 4.6 −93.3 60.6 54.3 Total 41 3.1 5.3 −93.3 60.6 35.2
AJODO, American Journal of Orthodontics and Dentofacial Orthopedics; ANGLE, Angle Orthodontist; EJO, European Journal of Orthodontics; OCR, Orthodontics and Craniofacial Research; AOJ, Australian Orthodontic Journal; JO Orthop, Journal of Orofacial Orthopedics; Art and Science of Orthodontics and Dentofacial Enhancement (formerly World Journal of Orthodontics; WJO); and JO, Journal of Orthodontics. Blank subcategory cells
were based on research reports in isolation. No attempts were made to liaise with researchers to ascertain whether assumptions had been manipulated to produce realistic sample sizes. Consequently, the results presented equate to a ‘best-case scenario’, with manipulation of sample sizes impossible to identify with the design used. Alterations in sample calculations can also be evaluated following completion of the study by comparing final publications to published protocols. Attempts were made to identify protocols for published studies; however, these were rarely
accessible, as is often the case with orthodontic literature (Benson, 2011).
This study confirms that sample size reporting is occurring more frequently, with just 4 per cent of reports alluding to a calculation in 1980 (Meinert et al., 1984). However, the trial instead demonstrates that calculations typically lack the requisite information to permit replication. The magnitude of miscalculation shown in the complete reviews was small. Although not specifically explored in the current study, common reasons for discrepancies may relate to incorrect statistical handling of nested designs (for example, multiple observations on multiple teeth within patients), which may be susceptible to clustering effects with outcomes more closely matched within clusters than between them (Kerry and Bland, 1998). Similarity within clusters decreases the amount of unique information compared with observations obtained without clustering; the required sample size in clustered designs increases accordingly (Kerry and Bland, 1998). The increase in sample size required in cluster-randomized designs can be determined using the design effect, which is related to the intra-class correlation coefficient (ICC) according to the following formula: D = 1 + (m − 1) ρ, where m is the number of observations per cluster and ρ = ICC. Higher ICC values require an increase in the necessary sample size in a clustered trial to maintain similar levels of power. Accurate sample calculations for clustered designs requires information relating to either the within-cluster correlation (ICC) or the between-cluster variability (coefficient of variation). However, this information is usually lacking.
ITT analysis is increasingly advocated in randomized tri-als, allowing the benefits of randomization to be preserved throughout the trial. The alternative approach is per-protocol analysis, where dropouts from clinical studies are ignored in the analysis. The latter approach is likely to represent a best-case scenario and may risk susceptibility to attrition bias due to uneven loss to follow-up. Consequently, ITT princi-ples are advocated for tests of effectiveness of interventions in real-world, pragmatic studies. The present study revealed that ITT analysis was clearly described and undertaken in only a minority of studies (13 per cent). Furthermore, although ITT analysis was referred to in a number of other studies, closer scrutiny of the flow of participants con-tradicted this assertion. This finding is in keeping with research on medical journals (Gravel et al., 2007) alluding to a much greater percentage of studies (62 per cent) using ITT, whereas a significant percentage of these violated the principles of ITT. Erroneous handling of dropouts in stud-ies labelled as using ITT analyses ranged from 10 (Hollis and Campbell, 1999) to 58 per cent (Kruse et al., 2002). It is, therefore, important that data analysis is pre-specified at the protocol stage and undertaken and reported accordingly, allowing a more informed discussion of the implications of research findings.
Table 5 Standardized percentage difference based on alpha
level, power level, and type of outcome.
N Mean Median Minimum Maximum IQR
Alpha (%) 1 — — — — — — 5 41 3.1 5.3 −93.3 60.6 35.2 Power (%) 80 21 1.5 4.5 −93.3 60.6 32.2 85 3 48.1 45.0 45.0 54.3 9.3 90 15 0.9 7.7 −42.9 33.3 21.2 95 2 −30.0 −30.0 −41.8 −18.2 23.6 Outcome Continuous 34 1.2 4.5 −66.7 54.3 24.26 Categorical 2 −3.4 −3.4 −12.1 5.3 17.4 Time to event 5 18.7 42.1 −93.3 60.6 36.9 Total 41 3.1 5.3 −93.3 60.6 35.2
Blank subcategory cells indicate that insufficient information was available to allow calculations related to those characteristics to be repeated. -1 00 -5 0 0 50 -1 00 -5 0 0 50
AJODO ANGLE EJO
JO OCR Total stan da rd iz ed _d iffe re nc e (% ) Graphs by journal
Figure 3 Box plots of percentage standardized difference between
origi-nal and recalculated sample size for randomized controlled trials (RCTs) in individual orthodontic journals and the overall percentage. Only jour-nals with trials allowing for sample size recalculation are shown: AJODO,
American Journal of Orthodontics and Dentofacial Orthopedics; ANGLE, Angle Orthodontist; EJO, European Journal of Orthodontics; OCR, Orthodontics and Craniofacial Research; and JO, Journal of Orthodontics.
The present study has exposed a divide between the emphasis placed on sample size calculations by journals, ethical review committees, and funding agencies on the one hand and existential practice on the other. It appears that sample size calculations are reported less often than should be the case and, when presented, are sometimes inaccurate and often outlined in insufficient detail to permit verification. It is, therefore, important that, if the emphasis on sample size estimation is to continue, peer reviewers and editors be encouraged to scrutinize whether calcula-tions are presented completely. To facilitate this, publish-ers may make available electronic software that may also permit quick and simple replication of the calculation to test its veracity. Unless sound practices are encour-aged, underpowered trials will continue to be published. Although such studies may be combined in meta-analy-ses, there remains a body of opinion that underpowered studies are unethical and may lead to incorrect interpre-tation of results, particularly when clinical importance is confused with statistical significance. Consequently, the importance of improving the current methods of sample size estimation in published research is clear. Failing that, alternative approaches to sample size estimation should be considered.
Finally, it should be noted that conclusions from this study should be viewed with caution as the proportion of RCTs providing enough data for confirmation of sample calculations was low. Nevertheless, it should be borne in mind that RCTs are often of better methodological qual-ity compared to non-randomized trials and other studies. It is therefore reasonable to speculate that a large body of existing evidence may be founded on incorrectly powered studies.
Conclusions
Although sample size calculations are typically reported in trials published as RCTs in orthodontic speciality jour-nals, complete presentation is suboptimal. Consequently, reporting of sample size estimation is in need of significant improvement.
References
Altman D G 1980 Statistics and ethics in medical research: III How large a sample? British Medical Journal 281: 1336–1338
Ayeni O, Dickson L, Ignacy T A, Thoma A 2012 A systematic review of power and sample size reporting in randomized controlled trials within plastic surgery. Plastic and Reconstructive Surgery 130: e78–e86 Bacchetti P 2002 Peer review of statistics in medical research: the other
problem. British Medical Journal 324: 1271–1273
Benson P 2011 Registration of clinical trials. Journal of Orthodontics 38: 75–76
Charles P, Giraudeau B, Dechartres A, Baron G, Ravaud P 2009 Reporting of sample size calculation in randomised controlled trials: review. British Medical Journal 338: b1732
Freiman J A, Chalmers T C, Smith H Jr, Kuebler R R 1978 The importance of beta, the type II error and sample size in the design and interpretation of the randomized control trial. Survey of 71 “negative” trials. The New England Journal of Medicine 299: 690–694
Gravel J, Opatrny L, Shapiro S 2007 The intention-to-treat approach in randomized controlled trials: are authors saying what they do and doing what they say? Clinical Trials 4: 350–356
Halpern S D, Karlawish J H, Berlin J A 2002 The continuing unethical conduct of underpowered clinical trials. The Journal of the American Medical Association 288: 358–362
Hollis S, Campbell F 1999 What is meant by intention to treat analysis? Survey of published randomised controlled trials. British Medical Journal 319: 670–674
Kerry S M, Bland J M 1998 Analysis of a trial randomised in clusters. British Medical Journal 316: 54
Kruse R L, Alper B S, Reust C, Stevermer J J, Shannon S, Williams R H 2002 Intention-to-treat analysis: who is in? Who is out? The Journal of Family Practice 51: 969–971
Machin D, Campbell M, Fayers P, Pinol A 1997 Sample Size Tables for Clinical Studies, 2nd edn. Blackwell Science, Oxford
Meinert C L, Tonascia S, Higgins K 1984 Content of reports on clinical trials: a critical review. Controlled Clinical Trials 5: 328–347
Schulz K F, Altman D G, Moher D; CONSORT Group. 2010a CONSORT 2010 statement: updated guidelines for reporting parallel group ran-domised trials. PLoS Medicine 7: e1000251
Schulz K F, Altman D G, Moher D; CONSORT Group. 2010b CONSORT 2010 statement: updated guidelines for reporting parallel group ran-domised trials. Journal of Clinical Epidemiology 63: 834–840 Schulz K F, Grimes D A 2005 Sample size calculations in randomised
tri-als: mandatory and mystical. Lancet 365: 1348–1353
Vickers A J 2003 Underpowering in randomized trials reporting a sample size calculation. Journal of Clinical Epidemiology 56: 717–720 Wooding W M 1994 Planning Pharmaceutical Clinical Trials. John Wiley