Effects of clinical breakpoint changes in CLSI guidelines 2010/2011
and EUCAST guidelines 2011 on antibiotic susceptibility test
reporting of Gram-negative bacilli
Michael Hombach*, Guido V. Bloemberg and Erik C. Bo¨ttger
Institut fu¨r Medizinische Mikrobiologie, Universita¨t Zu¨rich, 8006 Zu¨rich, Switzerland
*Corresponding author. Tel:+41-44-634-27-00; Fax: +41-44-634-49-06; E-mail: mhombach@imm.uzh.ch
Received 22 September 2011; returned 7 November 2011; revised 10 November 2011; accepted 14 November 2011 Objectives: The aim of this study was to analyse the effects of clinical breakpoint changes in CLSI 2010 and 2011 guidelines and EUCAST 2011 guidelines on antibiotic susceptibility testing (AST) reports.
Methods: In total, 3713 non-duplicate clinical isolates of Enterobacteriaceae, Pseudomonas aeruginosa, Stenotrophomonas maltophilia and Acinetobacter baumannii were analysed. Inhibition zone diameters were determined for b-lactams, carbapenems, fluoroquinolones, aminoglycosides and trimethoprim/sulfamethoxazole. CLSI 2009– 11 and EUCAST 2011 clinical breakpoints were applied.
Results: Changes in resistance as defined per the guidelines affected individual species and drug classes differ-ently. The cefepime resistance rate in Escherichia coli and Enterobacter cloacae increased from 2.1% and 1.3% to 8.2% and 6.9%, respectively, applying CLSI 2009–11 versus EUCAST 2011 guidelines. Ertapenem resistance rates in E. cloacae increased from 2.6% with CLSI 2009 to 7.2% for CLSI 2010 and 2011, and to 10.1% when applying EUCAST 2011. Cefepime and meropenem resistance rates in P. aeruginosa increased from 12.2% and 20.6% to 19.8% and 27.7%, respectively, comparing CLSI 2009 –11 with EUCAST 2011. Tobramycin and gen-tamicin resistance rates in A. baumannii increased from 15.9% and 25.4% to 34.9% and 44.4% applying CLSI 2009– 11 versus EUCAST 2011.
Conclusions: Higher resistance rates reported due to breakpoint changes in CLSI and EUCAST guidelines will result in increasing numbers of Gram-negative bacilli reported as multidrug resistant. AST reports classifying amoxicillin/clavulanic acid, cefepime or carbapenem resistance will lead clinicians to use alternative agents. Upon implementation of the EUCAST guidelines, laboratories should be aware of the implications of modified drug susceptibility testing reports on antibiotic prescription policies.
Keywords: resistance rates, Enterobacteriaceae, non-fermenting Gram-negative bacilli
Introduction
The European Committee for Antimicrobial Susceptibility Testing (EUCAST) has published guidelines for performance and inter-pretation of antibiotic susceptibility testing (AST).1 Laboratories in Europe are encouraged to change their AST system to facilitate comparability of AST results. The CLSI has updated its recom-mendations for interpretation of in vitro drug susceptibility testing results in the CLSI 2010 and 2011 guidelines; this update is based on clinical data, pharmacokinetic –pharmacody-namic (PK –PD) properties and MIC distributions, in part adopting EUCAST strategies.2,3
In particular for Gram-negative bacilli, significant changes in AST interpretation are notable. Inhibition zone diameter breakpoints for Enterobacteriaceae, Pseudomonas aeruginosa and Acinetobacter
baumannii defining susceptibility to third-generation cephalospor-ins, carbapenems and fluoroquinolones are significantly higher in the EUCAST 2011 version compared with CLSI 2009 breakpoints.1,4 Most recently, CLSI recommended higher zone diameter suscepti-bility breakpoints for third-generation cephalosporins and carba-penems in its 2010 and 2011 updates, while breakpoints for fluoroquinolones were not changed.2,3
The main difference between EUCAST and CLSI is the elimin-ation, or at least a reduction of, the intermediate AST category. EUCAST has, in part, removed the intermediate zone, because PKs/PDs and limited clinical data do not support an intermediate category. Consequently, AST reports are simplified by reporting an isolate as either susceptible or resistant. This strategy will change AST reports, mostly by reporting isolates as resistant that were formerly considered intermediate. Additionally, higher
#The Author 2011. Published by Oxford University Press on behalf of the British Society for Antimicrobial Chemotherapy. All rights reserved. For Permissions, please e-mail: journals.permissions@oup.com
diameter breakpoints will enhance increasing resistance rates reported for Gram-negative bacilli.5,6The definition of multidrug-resistant bacteria is commonly based on the presence of resist-ance to antibiotic agents from several different antibiotic classes.7A change in resistance rates of individual classes of anti-biotic drugs will therefore inevitably influence the rate of multidrug-resistant isolates reported by the microbiological laboratory.
Adoption of new guidelines and breakpoints can have a significant effect on ASTreports of diagnostic laboratories, with con-comitant changes in antibiotic prescription by clinicians.8This study aimed at comparing the new standards with respect to changes in epidemiological parameters, i.e. reported rates of susceptibility and resistance of Gram-negative bacteria when applying CLSI 2009–11 and EUCAST 2011. The results of this study will support clinical microbiological laboratories in correct interpretation and antibiotic therapy recommendations to clinicians during the transition phase from the CLSI system to the EUCASTsystem. Close interaction with and information from clinicians is needed to avoid uncertain-ties in the interpretation of changes in AST reports.
Methods
Clinical isolates
In total, 3713 non-duplicate clinical isolates of Gram-negative bacilli isolated during a 17 month period from January 2010 to May 2011 in our clinical microbiological laboratory were included in the study. Our clinical laboratory primarily serves the 850 bed university hospital of Zurich. The 3713 isolates comprised 2834 Enterobacteriaceae (1360
Escherichia coli, 424 Klebsiella pneumoniae, 159 Klebsiella oxytoca, 306 Enterobacter cloacae, 75 Enterobacter aerogenes, 87 Citrobacter freundii, 68 Citrobacter koseri, 73 Serratia marcescens, 63 Morganella morganii, 47 Proteus vulgaris, 148 Proteus mirabilis and 24 Hafnia alvei), 656 P. aeruginosa, 160 Stenotrophomonas maltophilia and 63 A. baumannii.
Susceptibility testing
For susceptibility testing, the disc diffusion method according to Kirby– Bauer was used. Antibiotic discs were obtained from Becton Dickinson (Franklin Lakes, NJ, USA). Susceptibility testing was done on Mueller– Hinton agar (bioMe´rieux, Marcy l’E´toile, France) using McFarland 0.5 from overnight cultures followed by incubation at 358C for 16– 18 h.
Inhibition zone diameters were determined and recorded in the automated Sirweb/Sirscan system (i2a, Montpellier, France). Inhibition zone diameters were interpreted according to EUCAST 2011 and CLSI 2009– 11 guidelines, respectively (see Tables1and2).
Comparison of CLSI 2009 – 11 and EUCAST 2011
breakpoints
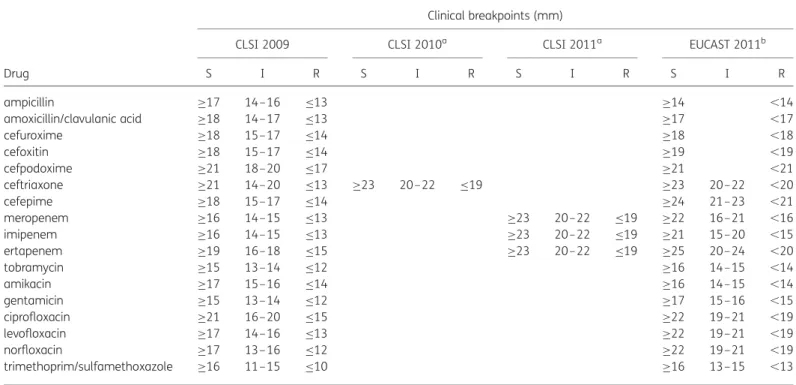
Inhibition zone diameters were used to compare CLSI 2009–11 recom-mended diameter breakpoints with EUCAST 2011 clinical breakpoints for Enterobacteriaceae. For P. aeruginosa, S. maltophilia and A. baumannii, in-hibition zone diameter breakpoints as recommended in the CLSI 2009–11 AST guidelines were compared with EUCAST 2011 clinical breakpoints, since CLSI did not change breakpoints for these species from 2009 to 2011. EUCAST eliminates, in part, the intermediate category for some anti-biotics such as amoxicillin/clavulanic acid. For other drugs such as ceftriax-one, an intermediate (or indeterminate) zone is kept but not specifically mentioned in the EUCAST breakpoint tables. Tables 3 and 4 list CLSI Table 1. Clinical breakpoint values of CLSI 2009– 11 and EUCAST 2011 for AST of Enterobacteriaceae
Drug
Clinical breakpoints (mm)
CLSI 2009 CLSI 2010a CLSI 2011a EUCAST 2011b
S I R S I R S I R S I R ampicillin ≥17 14–16 ≤13 ≥14 ,14 amoxicillin/clavulanic acid ≥18 14–17 ≤13 ≥17 ,17 cefuroxime ≥18 15–17 ≤14 ≥18 ,18 cefoxitin ≥18 15–17 ≤14 ≥19 ,19 cefpodoxime ≥21 18–20 ≤17 ≥21 ,21 ceftriaxone ≥21 14–20 ≤13 ≥23 20 –22 ≤19 ≥23 20–22 ,20 cefepime ≥18 15–17 ≤14 ≥24 21–23 ,21 meropenem ≥16 14–15 ≤13 ≥23 20– 22 ≤19 ≥22 16–21 ,16 imipenem ≥16 14–15 ≤13 ≥23 20– 22 ≤19 ≥21 15–20 ,15 ertapenem ≥19 16–18 ≤15 ≥23 20– 22 ≤19 ≥25 20–24 ,20 tobramycin ≥15 13–14 ≤12 ≥16 14–15 ,14 amikacin ≥17 15–16 ≤14 ≥16 14–15 ,14 gentamicin ≥15 13–14 ≤12 ≥17 15–16 ,15 ciprofloxacin ≥21 16–20 ≤15 ≥22 19–21 ,19 levofloxacin ≥17 14–16 ≤13 ≥22 19–21 ,19 norfloxacin ≥17 13–16 ≤12 ≥22 19–21 ,19 trimethoprim/sulfamethoxazole ≥16 11–15 ≤10 ≥16 13–15 ,13
S, susceptible; I, intermediate; R, resistant.
aCLSI categories without value: interpretation guidelines were not changed compared with the previous version. bEUCAST categories without value: interpretative category does not exist (intermediate category only).
2009–11 and EUCAST 2011 clinical breakpoints and note the EUCAST in-ferred intermediate zone. For certain drugs, e.g. ceftazidime, cefotaxime and piperacillin/tazobactam, the EUCAST guidelines contain other antibiot-ic disc loads than the CLSI guidelines.1Only drugs were included in this comparison for which the same antibiotic disc loads are recommended in the CLSI and EUCAST system, i.e. ampicillin, amoxicillin/clavulanic acid, cefuroxime, cefoxitin, cefpodoxime, ceftriaxone, cefepime, meropenem, imipenem, ertapenem, tobramycin, amikacin, gentamicin, ciprofloxacin, levofloxacin, norfloxacin and trimethoprim/sulfamethoxazole.
Results
Enterobacteriaceae species
In aggregate, resistance rates to cefepime, ceftriaxone and ertape-nem increased from 1.6%, 9.5% and 1.0% (CLSI 2009) to 6.3%, 14.2% and 1.6%/2.2% (CLSI 2010/2011 and EUCAST 2011, respect-ively; see Table3).
Due to elimination of the intermediate zone for amoxicillin/ clavulanic acid by EUCAST 2011, the resistance rate (corrected for natural resistance in several species, e.g. Enterobacter spp., Citrobacter freundii) increased from 6.0% to 20.6% comparing CLSI 2009–11 with EUCAST 2011.
The overall resistance rates to fluoroquinolones moderately increased, e.g. the resistance rate to levofloxacin increased
from 14.7% to 18.3% comparing CLSI 2009 –11 with EUCAST 2011 (see Table 3). Increased fluoroquinolone resistance was noted for all Enterobacteriaceae species except E. coli, C. koseri and P. vulgaris, e.g. in E. coli resistance rates to fluoroquinolones were similar comparing CLSI 2009–11 with EUCAST 2011 (Table 3). The most important species-specific changes are described below.
E. coli
As observed in the trends for Enterobacteriaceae spp., resistance rates to cefepime and ceftriaxone increased from 2.1% (CLSI 2009) to 8.2% (EUCAST 2011) and from 9.9% (CLSI 2009) to 13.7% (CLSI 2010/11 and EUCAST 2011), respectively. Due to elimination of the intermediate zone, the resistance rate for amoxicillin/clavulanic acid increased from 6.6% to 23.7% com-paring CLSI 2009–11 with EUCAST 2011 (see Table3).
K. pneumoniae
Resistance rates to fluoroquinolones increased from 12.0%, 10.1% and 13.2% to 17.5%, 15.8% and 19.8% for ciprofloxacin, levofloxacin and norfloxacin, respectively, comparing CLSI 2009 – 11 with EUCAST 2011.
K. oxytoca
The resistance rate to ceftriaxone markedly increased from 0.6% (CLSI 2009) to 10.1% (CLSI 2010/2011 and EUCAST 2011).
E. cloacae, E. aerogenes and C. freundii
The resistance rate to cefepime in E. cloacae and E. aerogenes increased from 1.3% and 0% to 6.9% and 2.6% comparing CLSI 2009–11 with EUCAST 2011.
The resistance rate to ertapenem in E. cloacae, E. aerogenes and C. freundii increased from 2.6%, 11.7% and 0% with CLSI 2009/ 2010 to 7.2%, 11.7% and 0% for CLSI 2011 and to 10.1%, 14.3% and 1.1% with EUCAST 2011, respectively. Concomitantly, the susceptibility rate to ertapenem in E. cloacae decreased from 94.8% (CLSI 2009/2010) to 78.4% (CLSI 2011 and EUCAST 2011). Resistance rates to fluoroquinolones in E. cloacae increased from 2.6%, 2.3% and 0% to 6.0%, 6.5% and 1.8% for ciprofloxa-cin, levofloxacin and norfloxaciprofloxa-cin, respectively, comparing CLSI 2009– 11 with EUCAST 2011. For E. aerogenes and C. freundii the same trends as in E. cloacae were noted.
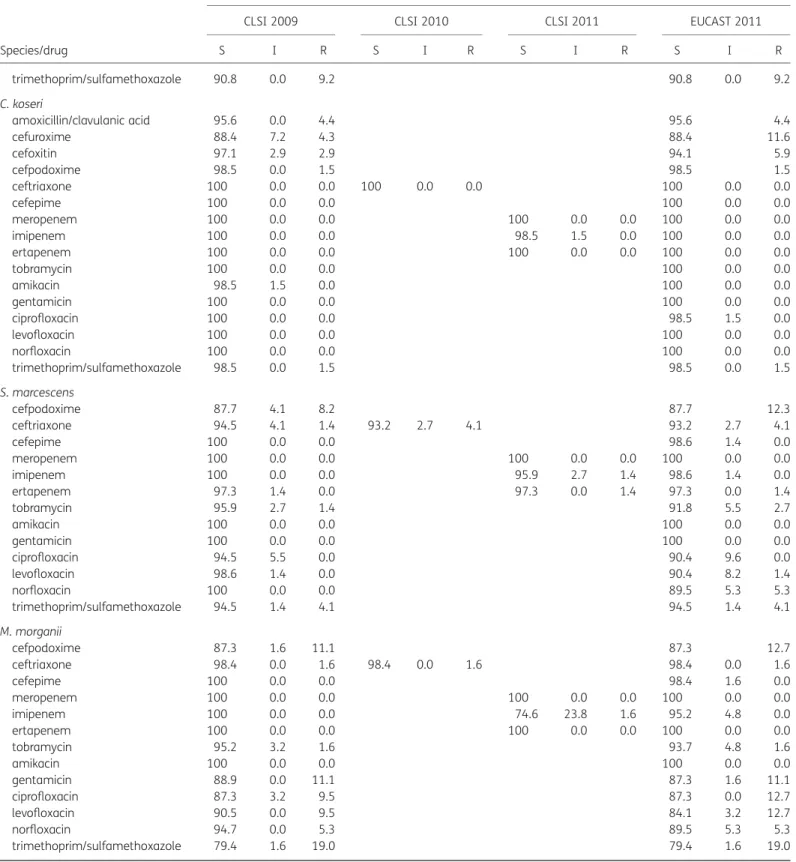
S. marcescens
The resistance rate for ciprofloxacin remained at 0%. However, resistance rates to levofloxacin and norfloxacin increased from 0% to 1.4% and 5.3% when applying CLSI 2009 –11 standards compared with EUCAST 2011 standards, respectively.
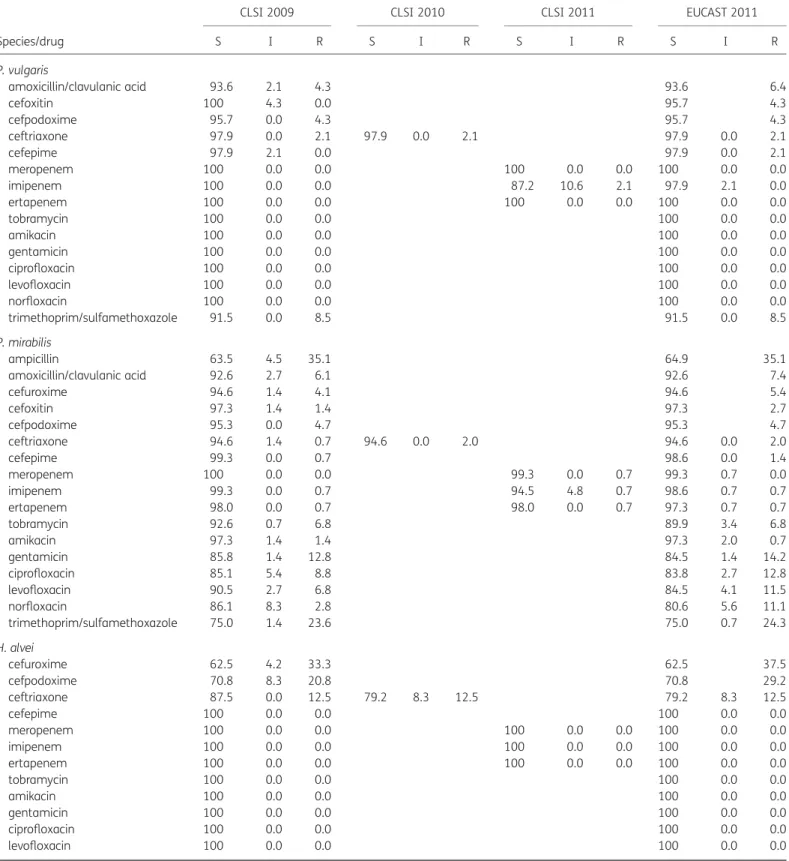
C. koseri, M. morganii, P. mirabilis, P. vulgaris and H. alvei
Only marginal changes in resistance and susceptibility rates were demonstrated for C. koseri, M. morganii, P. mirabilis, P. vulgaris and H. alvei (Table3).
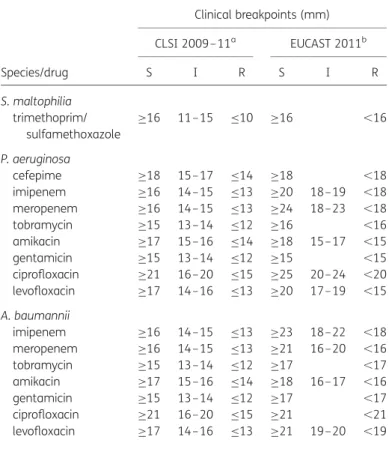
Table 2. Clinical breakpoint values of CLSI 2009– 11 and EUCAST 2011 for AST of glucose non-fermenting Gram-negative bacilli
Species/drug Clinical breakpoints (mm) CLSI 2009– 11a EUCAST 2011b S I R S I R S. maltophilia trimethoprim/ sulfamethoxazole ≥16 11–15 ≤10 ≥16 ,16 P. aeruginosa cefepime ≥18 15–17 ≤14 ≥18 ,18 imipenem ≥16 14–15 ≤13 ≥20 18–19 ,18 meropenem ≥16 14–15 ≤13 ≥24 18–23 ,18 tobramycin ≥15 13–14 ≤12 ≥16 ,16 amikacin ≥17 15–16 ≤14 ≥18 15–17 ,15 gentamicin ≥15 13–14 ≤12 ≥15 ,15 ciprofloxacin ≥21 16–20 ≤15 ≥25 20–24 ,20 levofloxacin ≥17 14–16 ≤13 ≥20 17–19 ,15 A. baumannii imipenem ≥16 14–15 ≤13 ≥23 18–22 ,18 meropenem ≥16 14–15 ≤13 ≥21 16–20 ,16 tobramycin ≥15 13–14 ≤12 ≥17 ,17 amikacin ≥17 15–16 ≤14 ≥18 16–17 ,16 gentamicin ≥15 13–14 ≤12 ≥17 ,17 ciprofloxacin ≥21 16–20 ≤15 ≥21 ,21 levofloxacin ≥17 14–16 ≤13 ≥21 19–20 ,19
S, susceptible; I, intermediate; R, resistant. aCLSI 2009– 11 guidelines were not changed.
bEUCAST categories without value: interpretative category does not exist (intermediate category only).
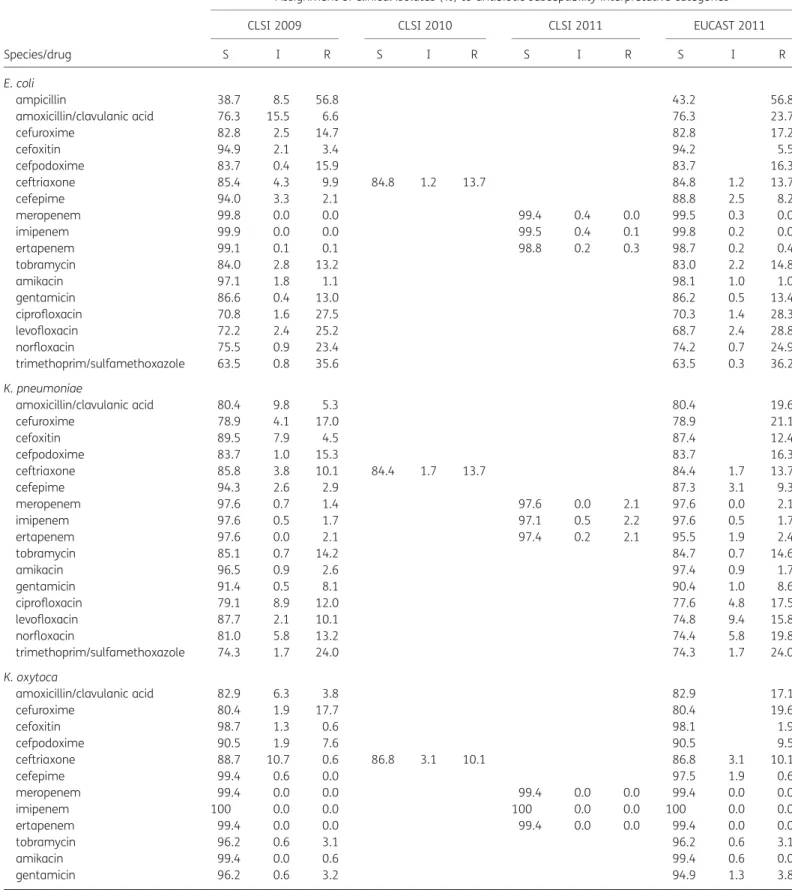
Table 3. Assignment of Enterobacteriaceae clinical isolates to interpretative category according to CLSI 2009–11 and EUCAST 2011a
Species/drug
Assignment of clinical isolates (%) to antibiotic susceptibility interpretative categories
CLSI 2009 CLSI 2010 CLSI 2011 EUCAST 2011
S I R S I R S I R S I R E. coli ampicillin 38.7 8.5 56.8 43.2 56.8 amoxicillin/clavulanic acid 76.3 15.5 6.6 76.3 23.7 cefuroxime 82.8 2.5 14.7 82.8 17.2 cefoxitin 94.9 2.1 3.4 94.2 5.5 cefpodoxime 83.7 0.4 15.9 83.7 16.3 ceftriaxone 85.4 4.3 9.9 84.8 1.2 13.7 84.8 1.2 13.7 cefepime 94.0 3.3 2.1 88.8 2.5 8.2 meropenem 99.8 0.0 0.0 99.4 0.4 0.0 99.5 0.3 0.0 imipenem 99.9 0.0 0.0 99.5 0.4 0.1 99.8 0.2 0.0 ertapenem 99.1 0.1 0.1 98.8 0.2 0.3 98.7 0.2 0.4 tobramycin 84.0 2.8 13.2 83.0 2.2 14.8 amikacin 97.1 1.8 1.1 98.1 1.0 1.0 gentamicin 86.6 0.4 13.0 86.2 0.5 13.4 ciprofloxacin 70.8 1.6 27.5 70.3 1.4 28.3 levofloxacin 72.2 2.4 25.2 68.7 2.4 28.8 norfloxacin 75.5 0.9 23.4 74.2 0.7 24.9 trimethoprim/sulfamethoxazole 63.5 0.8 35.6 63.5 0.3 36.2 K. pneumoniae amoxicillin/clavulanic acid 80.4 9.8 5.3 80.4 19.6 cefuroxime 78.9 4.1 17.0 78.9 21.1 cefoxitin 89.5 7.9 4.5 87.4 12.4 cefpodoxime 83.7 1.0 15.3 83.7 16.3 ceftriaxone 85.8 3.8 10.1 84.4 1.7 13.7 84.4 1.7 13.7 cefepime 94.3 2.6 2.9 87.3 3.1 9.3 meropenem 97.6 0.7 1.4 97.6 0.0 2.1 97.6 0.0 2.1 imipenem 97.6 0.5 1.7 97.1 0.5 2.2 97.6 0.5 1.7 ertapenem 97.6 0.0 2.1 97.4 0.2 2.1 95.5 1.9 2.4 tobramycin 85.1 0.7 14.2 84.7 0.7 14.6 amikacin 96.5 0.9 2.6 97.4 0.9 1.7 gentamicin 91.4 0.5 8.1 90.4 1.0 8.6 ciprofloxacin 79.1 8.9 12.0 77.6 4.8 17.5 levofloxacin 87.7 2.1 10.1 74.8 9.4 15.8 norfloxacin 81.0 5.8 13.2 74.4 5.8 19.8 trimethoprim/sulfamethoxazole 74.3 1.7 24.0 74.3 1.7 24.0 K. oxytoca amoxicillin/clavulanic acid 82.9 6.3 3.8 82.9 17.1 cefuroxime 80.4 1.9 17.7 80.4 19.6 cefoxitin 98.7 1.3 0.6 98.1 1.9 cefpodoxime 90.5 1.9 7.6 90.5 9.5 ceftriaxone 88.7 10.7 0.6 86.8 3.1 10.1 86.8 3.1 10.1 cefepime 99.4 0.6 0.0 97.5 1.9 0.6 meropenem 99.4 0.0 0.0 99.4 0.0 0.0 99.4 0.0 0.0 imipenem 100 0.0 0.0 100 0.0 0.0 100 0.0 0.0 ertapenem 99.4 0.0 0.0 99.4 0.0 0.0 99.4 0.0 0.0 tobramycin 96.2 0.6 3.1 96.2 0.6 3.1 amikacin 99.4 0.0 0.6 99.4 0.6 0.0 gentamicin 96.2 0.6 3.2 94.9 1.3 3.8 Continued
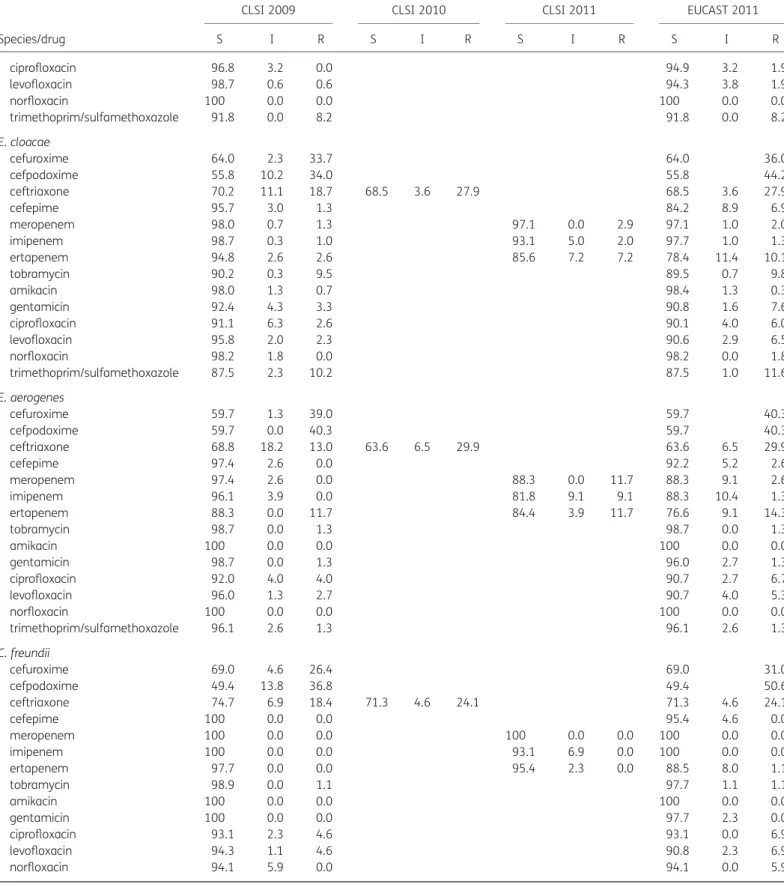
Table 3. Continued
Species/drug
Assignment of clinical isolates (%) to antibiotic susceptibility interpretative categories
CLSI 2009 CLSI 2010 CLSI 2011 EUCAST 2011
S I R S I R S I R S I R ciprofloxacin 96.8 3.2 0.0 94.9 3.2 1.9 levofloxacin 98.7 0.6 0.6 94.3 3.8 1.9 norfloxacin 100 0.0 0.0 100 0.0 0.0 trimethoprim/sulfamethoxazole 91.8 0.0 8.2 91.8 0.0 8.2 E. cloacae cefuroxime 64.0 2.3 33.7 64.0 36.0 cefpodoxime 55.8 10.2 34.0 55.8 44.2 ceftriaxone 70.2 11.1 18.7 68.5 3.6 27.9 68.5 3.6 27.9 cefepime 95.7 3.0 1.3 84.2 8.9 6.9 meropenem 98.0 0.7 1.3 97.1 0.0 2.9 97.1 1.0 2.0 imipenem 98.7 0.3 1.0 93.1 5.0 2.0 97.7 1.0 1.3 ertapenem 94.8 2.6 2.6 85.6 7.2 7.2 78.4 11.4 10.1 tobramycin 90.2 0.3 9.5 89.5 0.7 9.8 amikacin 98.0 1.3 0.7 98.4 1.3 0.3 gentamicin 92.4 4.3 3.3 90.8 1.6 7.6 ciprofloxacin 91.1 6.3 2.6 90.1 4.0 6.0 levofloxacin 95.8 2.0 2.3 90.6 2.9 6.5 norfloxacin 98.2 1.8 0.0 98.2 0.0 1.8 trimethoprim/sulfamethoxazole 87.5 2.3 10.2 87.5 1.0 11.6 E. aerogenes cefuroxime 59.7 1.3 39.0 59.7 40.3 cefpodoxime 59.7 0.0 40.3 59.7 40.3 ceftriaxone 68.8 18.2 13.0 63.6 6.5 29.9 63.6 6.5 29.9 cefepime 97.4 2.6 0.0 92.2 5.2 2.6 meropenem 97.4 2.6 0.0 88.3 0.0 11.7 88.3 9.1 2.6 imipenem 96.1 3.9 0.0 81.8 9.1 9.1 88.3 10.4 1.3 ertapenem 88.3 0.0 11.7 84.4 3.9 11.7 76.6 9.1 14.3 tobramycin 98.7 0.0 1.3 98.7 0.0 1.3 amikacin 100 0.0 0.0 100 0.0 0.0 gentamicin 98.7 0.0 1.3 96.0 2.7 1.3 ciprofloxacin 92.0 4.0 4.0 90.7 2.7 6.7 levofloxacin 96.0 1.3 2.7 90.7 4.0 5.3 norfloxacin 100 0.0 0.0 100 0.0 0.0 trimethoprim/sulfamethoxazole 96.1 2.6 1.3 96.1 2.6 1.3 C. freundii cefuroxime 69.0 4.6 26.4 69.0 31.0 cefpodoxime 49.4 13.8 36.8 49.4 50.6 ceftriaxone 74.7 6.9 18.4 71.3 4.6 24.1 71.3 4.6 24.1 cefepime 100 0.0 0.0 95.4 4.6 0.0 meropenem 100 0.0 0.0 100 0.0 0.0 100 0.0 0.0 imipenem 100 0.0 0.0 93.1 6.9 0.0 100 0.0 0.0 ertapenem 97.7 0.0 0.0 95.4 2.3 0.0 88.5 8.0 1.1 tobramycin 98.9 0.0 1.1 97.7 1.1 1.1 amikacin 100 0.0 0.0 100 0.0 0.0 gentamicin 100 0.0 0.0 97.7 2.3 0.0 ciprofloxacin 93.1 2.3 4.6 93.1 0.0 6.9 levofloxacin 94.3 1.1 4.6 90.8 2.3 6.9 norfloxacin 94.1 5.9 0.0 94.1 0.0 5.9 Continued
Table 3. Continued
Species/drug
Assignment of clinical isolates (%) to antibiotic susceptibility interpretative categories
CLSI 2009 CLSI 2010 CLSI 2011 EUCAST 2011
S I R S I R S I R S I R trimethoprim/sulfamethoxazole 90.8 0.0 9.2 90.8 0.0 9.2 C. koseri amoxicillin/clavulanic acid 95.6 0.0 4.4 95.6 4.4 cefuroxime 88.4 7.2 4.3 88.4 11.6 cefoxitin 97.1 2.9 2.9 94.1 5.9 cefpodoxime 98.5 0.0 1.5 98.5 1.5 ceftriaxone 100 0.0 0.0 100 0.0 0.0 100 0.0 0.0 cefepime 100 0.0 0.0 100 0.0 0.0 meropenem 100 0.0 0.0 100 0.0 0.0 100 0.0 0.0 imipenem 100 0.0 0.0 98.5 1.5 0.0 100 0.0 0.0 ertapenem 100 0.0 0.0 100 0.0 0.0 100 0.0 0.0 tobramycin 100 0.0 0.0 100 0.0 0.0 amikacin 98.5 1.5 0.0 100 0.0 0.0 gentamicin 100 0.0 0.0 100 0.0 0.0 ciprofloxacin 100 0.0 0.0 98.5 1.5 0.0 levofloxacin 100 0.0 0.0 100 0.0 0.0 norfloxacin 100 0.0 0.0 100 0.0 0.0 trimethoprim/sulfamethoxazole 98.5 0.0 1.5 98.5 0.0 1.5 S. marcescens cefpodoxime 87.7 4.1 8.2 87.7 12.3 ceftriaxone 94.5 4.1 1.4 93.2 2.7 4.1 93.2 2.7 4.1 cefepime 100 0.0 0.0 98.6 1.4 0.0 meropenem 100 0.0 0.0 100 0.0 0.0 100 0.0 0.0 imipenem 100 0.0 0.0 95.9 2.7 1.4 98.6 1.4 0.0 ertapenem 97.3 1.4 0.0 97.3 0.0 1.4 97.3 0.0 1.4 tobramycin 95.9 2.7 1.4 91.8 5.5 2.7 amikacin 100 0.0 0.0 100 0.0 0.0 gentamicin 100 0.0 0.0 100 0.0 0.0 ciprofloxacin 94.5 5.5 0.0 90.4 9.6 0.0 levofloxacin 98.6 1.4 0.0 90.4 8.2 1.4 norfloxacin 100 0.0 0.0 89.5 5.3 5.3 trimethoprim/sulfamethoxazole 94.5 1.4 4.1 94.5 1.4 4.1 M. morganii cefpodoxime 87.3 1.6 11.1 87.3 12.7 ceftriaxone 98.4 0.0 1.6 98.4 0.0 1.6 98.4 0.0 1.6 cefepime 100 0.0 0.0 98.4 1.6 0.0 meropenem 100 0.0 0.0 100 0.0 0.0 100 0.0 0.0 imipenem 100 0.0 0.0 74.6 23.8 1.6 95.2 4.8 0.0 ertapenem 100 0.0 0.0 100 0.0 0.0 100 0.0 0.0 tobramycin 95.2 3.2 1.6 93.7 4.8 1.6 amikacin 100 0.0 0.0 100 0.0 0.0 gentamicin 88.9 0.0 11.1 87.3 1.6 11.1 ciprofloxacin 87.3 3.2 9.5 87.3 0.0 12.7 levofloxacin 90.5 0.0 9.5 84.1 3.2 12.7 norfloxacin 94.7 0.0 5.3 89.5 5.3 5.3 trimethoprim/sulfamethoxazole 79.4 1.6 19.0 79.4 1.6 19.0 Continued
Table 3. Continued
Species/drug
Assignment of clinical isolates (%) to antibiotic susceptibility interpretative categories
CLSI 2009 CLSI 2010 CLSI 2011 EUCAST 2011
S I R S I R S I R S I R P. vulgaris amoxicillin/clavulanic acid 93.6 2.1 4.3 93.6 6.4 cefoxitin 100 4.3 0.0 95.7 4.3 cefpodoxime 95.7 0.0 4.3 95.7 4.3 ceftriaxone 97.9 0.0 2.1 97.9 0.0 2.1 97.9 0.0 2.1 cefepime 97.9 2.1 0.0 97.9 0.0 2.1 meropenem 100 0.0 0.0 100 0.0 0.0 100 0.0 0.0 imipenem 100 0.0 0.0 87.2 10.6 2.1 97.9 2.1 0.0 ertapenem 100 0.0 0.0 100 0.0 0.0 100 0.0 0.0 tobramycin 100 0.0 0.0 100 0.0 0.0 amikacin 100 0.0 0.0 100 0.0 0.0 gentamicin 100 0.0 0.0 100 0.0 0.0 ciprofloxacin 100 0.0 0.0 100 0.0 0.0 levofloxacin 100 0.0 0.0 100 0.0 0.0 norfloxacin 100 0.0 0.0 100 0.0 0.0 trimethoprim/sulfamethoxazole 91.5 0.0 8.5 91.5 0.0 8.5 P. mirabilis ampicillin 63.5 4.5 35.1 64.9 35.1 amoxicillin/clavulanic acid 92.6 2.7 6.1 92.6 7.4 cefuroxime 94.6 1.4 4.1 94.6 5.4 cefoxitin 97.3 1.4 1.4 97.3 2.7 cefpodoxime 95.3 0.0 4.7 95.3 4.7 ceftriaxone 94.6 1.4 0.7 94.6 0.0 2.0 94.6 0.0 2.0 cefepime 99.3 0.0 0.7 98.6 0.0 1.4 meropenem 100 0.0 0.0 99.3 0.0 0.7 99.3 0.7 0.0 imipenem 99.3 0.0 0.7 94.5 4.8 0.7 98.6 0.7 0.7 ertapenem 98.0 0.0 0.7 98.0 0.0 0.7 97.3 0.7 0.7 tobramycin 92.6 0.7 6.8 89.9 3.4 6.8 amikacin 97.3 1.4 1.4 97.3 2.0 0.7 gentamicin 85.8 1.4 12.8 84.5 1.4 14.2 ciprofloxacin 85.1 5.4 8.8 83.8 2.7 12.8 levofloxacin 90.5 2.7 6.8 84.5 4.1 11.5 norfloxacin 86.1 8.3 2.8 80.6 5.6 11.1 trimethoprim/sulfamethoxazole 75.0 1.4 23.6 75.0 0.7 24.3 H. alvei cefuroxime 62.5 4.2 33.3 62.5 37.5 cefpodoxime 70.8 8.3 20.8 70.8 29.2 ceftriaxone 87.5 0.0 12.5 79.2 8.3 12.5 79.2 8.3 12.5 cefepime 100 0.0 0.0 100 0.0 0.0 meropenem 100 0.0 0.0 100 0.0 0.0 100 0.0 0.0 imipenem 100 0.0 0.0 100 0.0 0.0 100 0.0 0.0 ertapenem 100 0.0 0.0 100 0.0 0.0 100 0.0 0.0 tobramycin 100 0.0 0.0 100 0.0 0.0 amikacin 100 0.0 0.0 100 0.0 0.0 gentamicin 100 0.0 0.0 100 0.0 0.0 ciprofloxacin 100 0.0 0.0 100 0.0 0.0 levofloxacin 100 0.0 0.0 100 0.0 0.0 Continued
P. aeruginosa
Resistance rates to cefepime, imipenem and meropenem in P. aeruginosa increased from 12.2%, 25.5% and 20.6% to 19.8%, 30.4% and 27.7% comparing CLSI 2009–11 standards with EUCAST 2011 standards, respectively (see Table4).
Resistance rates to gentamicin increased from 18.6% to 25.2% with CLSI 2009– 11 standards compared with EUCAST 2011 stan-dards due to elimination of the intermediate category by EUCAST. Resistance rates to ciprofloxacin and levofloxacin increased from 15.9% and 21.3% to 29.7% and 30.8% with CLSI 2009 –11 standards compared with EUCAST 2011 standards, respectively.
S. maltophilia
Trimethoprim/sulfamethoxazole is the only substance for which EUCAST 2011 provides AST breakpoints. No significant differences in the CLSI 2011 system were found except the elimination of the intermediate category by EUCAST and a resulting slight increase in the resistant category (9.4% and 10.6% resistance rate comparing CLSI 2009 –11 with EUCAST 2011; see Table4).
A. baumannii complex
Resistance rates to tobramycin and gentamicin increased from 15.9% and 25.4% to 34.9% and 44.4% comparing CLSI 2009 –
11 standards with EUCAST 2011 standards, while the resistance rate to amikacin remained unchanged (34.9%). In the case of tobramycin and gentamicin, the increased resistance rate results from the elimination of the intermediate zone in the EUCAST system. The gentamicin susceptibility rate was compar-able in both the CLSI 2009–11 and the EUCAST 2011 system (58.7% and 55.6%, respectively). In the case of tobramycin, however, the increased resistance rate was accompanied by a decrease in the susceptibility rate (84.1% with the CLSI 2009 – 11 versus 77.8% with the EUCAST 2011 system; see Table4).
Discussion
Many European laboratories are currently preparing to implement the new EUCAST guidelines for AST.1 Besides the national AST systems (e.g. in Germany, France, the UK and Sweden), many labora-tories, in particular in countries without a national AST system, have been using CLSI guidelines for many years.2–4Prior to implementing new guidelines in the diagnostic microbiology laboratory, the con-sequences of changed AST reports need to be considered to prevent misunderstandings in interpretation. The introduction of new guidelines should be accompanied by communicating the scientific rationale and the practical implications of changes in AST reporting.9 In this study the interpretation of AST for
Table 3. Continued
Species/drug
Assignment of clinical isolates (%) to antibiotic susceptibility interpretative categories
CLSI 2009 CLSI 2010 CLSI 2011 EUCAST 2011
S I R S I R S I R S I R
norfloxacin 100 0.0 0.0 100 0.0 0.0
trimethoprim/sulfamethoxazole 100 0.0 0.0 100 0.0 0.0
All Enterobacteriaceae speciesb
ampicillin 41.2 4.2 54.6 45.4 54.6 amoxicillin/clavulanic acid 79.4 12.3 6.0 79.4 20.6 cefuroxime 77.2 3.8 19.1 77.2 22.8 cefoxitin 94.7 3.2 3.2 93.6 6.4 cefpodoxime 80.6 2.2 17.2 80.6 19.4 ceftriaxone 85.2 5.3 9.5 84.0 1.8 14.2 84.0 1.8 14.2 cefepime 95.9 2.4 1.6 90.6 3.1 6.3 meropenem 99.4 0.2 0.4 98.8 0.2 1.0 98.9 0.5 0.6 imipenem 99.4 0.2 0.4 96.7 2.3 1.0 98.8 0.8 0.5 ertapenem 98.6 0.4 1.0 97.3 1.1 1.6 95.7 2.2 2.2 tobramycin 88.2 1.7 10.1 87.2 1.7 11.0 amikacin 97.6 1.3 1.1 98.3 0.9 0.8 gentamicin 90.3 0.8 8.9 89.4 0.9 9.7 ciprofloxacin 80.3 3.6 16.1 79.3 2.5 18.2 levofloxacin 83.3 2.0 14.7 78.0 3.7 18.3 norfloxacin 82.4 2.0 15.6 80.0 1.8 18.3 trimethoprim/sulfamethoxazole 74.5 1.1 24.4 74.5 0.7 24.8
S, susceptible; I, intermediate; R, resistant.
aDrugs to which species are naturally resistant are not listed. CLSI categories without value: interpretation guidelines were not changed compared with the previous version. EUCAST categories without value: interpretative category does not exist (applies to intermediate category only). bValues were corrected for natural resistance.
Gram-negative bacilli using the CLSI guidelines of 2009 –11 and the EUCAST 2011 system was investigated.
Implementation of EUCAST 2011 will lead to significantly more isolates of Gram-negative species being reported resistant to extended-spectrum cephalosporins (ceftriaxone, cefepime), carbapenems and fluoroquinolones (Tables1and2). The same applies to the CLSI 2011 standards. Since usage volume and resistance rate for an individual drug are generally linked, higher numbers of Gram-negative bacilli reported resistant to third-generation cephalosporins, carbapenems and fluoroquino-lones will most likely lead to an increased therapeutic usage volume and thus increased selection pressure on other anti-microbial classes or drugs such as aminoglycosides, trimetho-prim/sulfamethoxazole, fosfomycin or nitrofurantoin.10–12
The effects of a change from CLSI 2009 to CLSI 2010/2011 or from CLSI 2009 to EUCAST 2011 differ between Enterobacteriaceae species: for example, while the resistance rate for fluoroquinolones in E. coli remains almost unchanged, E. cloacae and K. pneumoniae are more frequently reported as resistant to these antibiotics using EUCAST 2011 (Table3). This finding is most probably related to the different natural diameter distributions of individual Enterobacter-iaceae species as compared with the breakpoints, which are defined for the whole Enterobacteriaceae family. In the EUCAST
diameter distribution tables (available at http://www.eucast.org/ zone_diameter_distributions/), the putative wild-type population of E. cloacae, for example, shows a diameter range of 20 – 38 mm and 19–33 mm for ciprofloxacin and levofloxacin, re-spectively, while the putative wild-type population of E. coli shows a diameter range of 25– 42 mm and 26 –39 mm for cipro-floxacin and levocipro-floxacin, respectively. Considering the uniform re-sistant breakpoint definitions for both drugs and species, the lower average diameters of E. cloacae readings explain the greater increase in fluoroquinolone resistance rates compared with E. coli. We suggest that species-adapted breakpoints for Enterobacteriaceae species would eliminate these artefacts and improve interpretation of AST.
Reportedly the number of extended-spectrum b-lactamase (ESBL)-producing strains isolated in the clinical laboratory is increasing, and ESBL-producing isolates are frequently treated with carbapenems, thereby selecting for carbapenemase-producing strains.13–15The EUCAST 2011 and CLSI 2011 guide-lines have led to a paradigm change in AST reporting of ESBL-producing isolates. Until 2009 the CLSI guidelines recommended reporting in vitro intermediate and susceptible AST results for third- and fourth-generation cephalosporins as resistant in con-firmed ESBL producers. In its 2008 expert rules EUCAST recom-mended changing the interpretation of AST results of third- and fourth-generation cephalosporins from ‘susceptible’ to ‘inter-mediate’ and from ‘inter‘inter-mediate’ to ‘resistant’ for confirmed ESBL producers.16 These recommendations have been aban-doned. Classification as susceptible, intermediate or resistant is now based on the reading of inhibition zone diameters alone, and not on interpretative reading, i.e. considering the underlying resistance mechanism.17,18Based on the new EUCAST and CLSI recommendations, a significant fraction of ESBL-producing strains will be categorized as susceptible to third- and fourth-generation cephalosporins.19In a recent study we showed cef-tazidime to be more frequently categorized as susceptible (22.9%) in ESBL producers, whereas the susceptibility rate to cefo-taxime was low (0.8%). This finding is probably due to the high prevalence of CTX-M ESBL types in our study population, which resembles the epidemiological situation in Europe.20One effect of implementing the new EUCAST and CLSI guidelines is treatment of ESBLs with third- and fourth-generation cephalosporins, and thus less frequent use of carbapenems, reducing selection pres-sure on this increasingly used drug family.21 In contrast, the increased diameter breakpoints for third- and fourth-generation cephalosporins in EUCAST will result in higher resistance rates reported for those drugs. Carbapenems will most likely be chosen to serve as alternative substances due to their currently low resistance rates, broad activity and low side effects. It is diffi-cult to predict which effect will prevail: less frequent use of carba-penems due to using third- and fourth-generation cephalosporins for ESBL-producing isolates, or more frequent use of carbapenems due to higher resistance rates reported for third- and fourth-generation cephalosporins resulting from increased diameter breakpoints. One limitation of this study is the exclusion of ceftazi-dime, cefotaxime and piperacillin/tazobactam. Analyses were done in a routine microbiological laboratory using CLSI disc con-tents. EUCAST uses lower disc loads than CLSI (10 mg/disc, 5 mg/ disc and 30/6 mg/disc EUCAST versus 30 mg/disc, 30 mg/disc and 100/10 mg/disc CLSI for ceftazidime, cefotaxime and piperacillin/ tazobactam, respectively), making interpretation of diameters
Table 4. Assignment of glucose non-fermenting Gram-negative bacilli clinical isolates to interpretative categories according to CLSI 2009–11 and EUCAST 2011 guidelines
Species/drug
Assignment of clinical isolates (%) to antibiotic susceptibility interpretative categories CLSI 2009–11 EUCAST 2011a S I R S I R P. aeruginosa cefepime 80.2 7.6 12.2 80.2 19.8 imipenem 71.7 2.4 25.5 67.0 2.3 30.4 meropenem 73.5 3.5 20.6 63.0 8.8 27.7 tobramycin 87.5 2.3 10.2 86.3 13.7 amikacin 80.3 4.0 15.7 76.6 7.6 15.7 gentamicin 74.8 6.6 18.6 74.8 25.2 ciprofloxacin 72.9 10.7 15.9 63.0 6.9 29.7 levofloxacin 69.2 9.5 21.3 62.8 6.4 30.8 S. maltophilia trimethoprim/sulfamethoxazole 89.4 1.3 9.4 89.4 10.6 A. baumannii imipenem 65.1 1.6 33.3 65.1 0.0 34.9 meropenem 66.7 0.0 33.3 61.9 4.8 33.3 tobramycin 84.1 0.0 15.9 77.8 34.9 amikacin 65.1 0.0 34.9 65.1 0.0 34.9 gentamicin 58.7 15.9 25.4 55.6 44.4 ciprofloxacin 51.6 3.2 45.2 51.6 48.4 levofloxacin 58.1 1.6 40.3 54.8 1.6 43.5
S, susceptible; I, intermediate; R, resistant.
aEUCAST categories without value: interpretative category does not exist (applies to intermediate category only).
with both systems impossible. Taking into account the importance of piperacillin/tazobactam in clinical practice, more studies are needed to analyse further the impact of the new AST guidelines. The number of useful antimicrobial treatment options for glucose non-fermenting Gram-negative bacilli like P. aeruginosa and A. baumannii will probably decrease after implementation of the EUCAST guidelines due to higher resistance rates. Especial-ly for P. aeruginosa, resistance rates of cefepime, carbapenems and fluoroquinolones will increase (Table4). Resistance rates of aminoglycosides in P. aeruginosa are hardly affected by changing from CLSI to EUCAST guidelines (Table4). These classes of drugs may therefore become a frequently chosen alternative, but will hardly be used as monotherapy.
No standard definitions exist to define Gram-negative bacilli as multidrug resistant, but most systems are based on the detection of non-susceptibility to several antibiotic classes.7Following imple-mentation of the CLSI 2011 and EUCAST 2011 guidelines more Gram-negative bacilli will be reported as multidrug resistant, resulting in higher rates of patients in isolation and, concomitantly, higher costs.22A higher rate of multidrug-resistant Gram-negative bacilli will not only result in higher costs for hospitals and hospital hygiene measures, but will also result in more confirmatory testing in the laboratory.
AST reports influence prescription policy and antibiotic use.8 Implementation of EUCAST guidelines will affect antibiotic pre-scription, in part because of the partial elimination of the inter-mediate category. Defining isolates as resistant that were formerly considered intermediate will most likely lead clinicians to use other antimicrobial classes.
This study was limited to the epidemiological situation in the Zurich region with low to moderate levels of resistance. The increase in resistance rates reported due to changes in guidelines may be more prominent in populations with higher levels of resistance, e.g. the Mediterranean region, since diameter distri-butions are shifted to lower mean values. In contrast, a lesser increase of reported resistance rates may be seen in regions with low resistance levels, such as Scandinavia.
Implementation of the EUCASTstandards for AST makes results in Europe more comparable, incorporating PK –PD studies and clin-ical data, e.g. the possible use of extended-spectrum cephalospor-ins versus carbapenems for ESBL-producing isolates.1 However, evidence-based clinical studies should further accompany and validate proposed changes in guidelines. During implementation of the EUCAST system, laboratories should be aware of the implications of modified AST reports on antibiotic prescription policy. Information from clinicians on changes in guidelines result-ing in apparently increased resistance rates may help to prevent excessive use of reserve antibiotic drugs. Antibiotic stewardship has been proven to effectively control antibiotic prescription, resulting in lower resistance rates.23 Considering a changed description of antimicrobial drug susceptibility in Gram-negative bacilli with higher resistance rates following implementation of the CLSI 2011 and EUCAST 2011 standards, the need for antibiotic stewardship must once more be emphasized.
Acknowledgements
We thank Professor R. Zbinden for critical comments on the manuscript prior to submission.
Funding
This work was supported by the University of Zurich.
Transparency declarations
None to declare.
References
1 European Committee on Antimicrobial Susceptibility Testing. Breakpoint Tables for Interpretation of MICs and Zone Diameters, Version 1.3, 2011. http://www.eucast.org/clinical_breakpoints (7 November 2011, date last accessed).
2 Clinical and Laboratory Standards Institute. Performance Standards for Antimicrobial Susceptibility Testing: Twentieth Informational Supplement M100-S20. CLSI, Wayne, PA, USA, 2010.
3 Clinical and Laboratory Standards Institute. Performance Standards for Antimicrobial Susceptibility Testing: Twenty-first Informational Supplement M100-S21. CLSI, Wayne, PA, USA, 2011.
4 Clinical and Laboratory Standards Institute. Performance Standards for Antimicrobial Susceptibility Testing: Nineteenth Informational Supplement M100-S19. CLSI, Wayne, PA, USA, 2009.
5 Chastre J. Evolving problems with resistant pathogens. Clin Microbiol Infect 2008; 14 Suppl 3: 3 –14.
6 Livermore DM. The threat from the pink corner. Ann Med 2003; 35: 226–34.
7 Kallen AJ, Hidron AI, Patel J et al. Multidrug resistance among Gram-negative pathogens that caused healthcare-associated infections reported to the National Healthcare Safety Network, 2006–2008. Infect Control Hosp Epidemiol 2010; 31: 528– 31.
8 MacKenzie FM, Gould IM, Bruce J et al. The role of microbiology and pharmacy departments in the stewardship of antibiotic prescribing in European hospitals. J Hosp Infect 2007; 65 Suppl 2: 73– 81.
9 Jenkins SG, Jerris RC. Critical assessment of issues applicable to development of antimicrobial susceptibility testing breakpoints. J Clin Microbiol 2011; 49 Suppl: S5– 10.
10 Harada K, Asai T. Role of antimicrobial selective pressure and secondary factors on antimicrobial resistance prevalence in Escherichia coli from food-producing animals in Japan. J Biomed Biotechnol 2010; 2010: 180682.
11 Hawkey PM, Jones AM. The changing epidemiology of resistance. J Antimicrob Chemother 2009; 64 Suppl 1: i3– 10.
12 Lai CC, Wang CY, Chu CC et al. Correlation between antibiotic consumption and resistance of Gram-negative bacteria causing healthcare-associated infections at a university hospital in Taiwan from 2000 to 2009. J Antimicrob Chemother 2011; 66: 1374–82.
13 Coque TM, Baquero F, Canton R. Increasing prevalence of ESBL-producing Enterobacteriaceae in Europe. Euro Surveill 2008; 13: pii¼19044.
14 Walsh TR. Emerging carbapenemases: a global perspective. Int J Antimicrob Agents 2010; 36 Suppl 3: S8 –14.
15 Pakyz AL, Oinonen M, Polk RE. Relationship of carbapenem restriction in 22 university teaching hospitals to carbapenem use and carbapenem-resistant Pseudomonas aeruginosa. Antimicrob Agents Chemother 2009; 53: 1983–6.
16 European Committee on Antimicrobial Susceptibility Testing. Expert Rules in Antimicrobial Susceptibility Testing, Version 1, 2008. http://www. eucast.org/expert_rules (7 November 2011, date last accessed).
17 Livermore DM, Winstanley TG, Shannon KP. Interpretative reading: recognizing the unusual and inferring resistance mechanisms from resistance phenotypes. J Antimicrob Chemother 2001; 48 Suppl S1: 87– 102.
18 Winstanley T, Courvalin P. Expert systems in clinical microbiology. Clin Microbiol Rev 2011; 24: 515– 56.
19 Wang P, Hu F, Xiong Z et al. Susceptibility of extended-spectrum-b-lactamase-producing Enterobacteriaceae according to the new CLSI breakpoints. J Clin Microbiol 2011; 49: 3127–31.
20 Polsfuss S, Bloemberg GV, Giger J et al. Comparison of European Committee on Antimicrobial Susceptibility Testing (EUCAST) and CLSI
screening parameters for the detection of extended-spectrum b-lactamase production in clinical Enterobacteriaceae isolates. J Antimicrob Chemother 2011; 67: 159–66.
21 Masterton RG. The new treatment paradigm and the role of carbapenems. Int J Antimicrob Agents 2009; 33: 105–10.
22 Lee NY, Lee HC, Ko NY et al. Clinical and economic impact of multidrug resistance in nosocomial Acinetobacter baumannii bacteremia. Infect Control Hosp Epidemiol 2007; 28: 713– 9.
23 Kaki R, Elligsen M, Walker S et al. Impact of antimicrobial stewardship in critical care: a systematic review. J Antimicrob Chemother 2011; 66: 1223– 30.