[15:20 26/6/2009 Bioinformatics-btp266.tex] Page: 1984 1984–1986
BIOINFORMATICS
APPLICATIONS NOTE
Vol. 25 no. 15 2009, pages 1984–1986doi:10.1093/bioinformatics/btp266Systems biology
CATMAID: collaborative annotation toolkit for massive
amounts of image data
Stephan Saalfeld
1, Albert Cardona
2, Volker Hartenstein
3and Pavel Toman ˇcák
1,∗1Max Planck Institute of Molecular Cell Biology and Genetics, Pfotenhauerstraße 108, Dresden, Germany,2Institute of Neuroinformatics, Uni/ETH Zürich, Winterthurerstrasse 190, Zürich, Switzerland and3Department of Molecular, Cell and Developmental Biology, University of California, Los Angeles, USA
Received on February 13, 2009; revised and accepted on April 15, 2009 Advance Access publication April 17, 2009
Associate Editor: Limsoon Wong
ABSTRACT
Summary: High-resolution, three-dimensional (3D) imaging of large
biological specimens generates massive image datasets that are difficult to navigate, annotate and share effectively. Inspired by online mapping applications like GoogleMaps™, we developed a decentralized web interface that allows seamless navigation of arbitrarily large image stacks. Our interface provides means for online, collaborative annotation of the biological image data and seamless sharing of regions of interest by bookmarking. The CATMAID interface enables synchronized navigation through multiple registered datasets even at vastly different scales such as in comparisons between optical and electron microscopy.
Availability: http://fly.mpi-cbg.de/catmaid Contact: [email protected]
1 INTRODUCTION
High-throughput and high-resolution imaging technologies generate many more images than can be practically shown in printed journals and thus these massive image datasets are presented to the scientific community through web interfaces.
Recently, a new class of large-scale biological image data emerged that focuses on high-resolution description of large biological specimens using three-dimensional (3D) microscopy techniques. Since most biological specimens are large in comparison to the scales employed by high-resolution microscopes, the entire specimens are captured by stitching many overlapping image tiles into a single canvas of virtually unlimited size. Microscopy techniques used in the tiling mode present new challenges for the annotation, analysis and sharing of gigantic datasets.
An analogy can be drawn between high-resolution imaging of large biological specimens and Geographical Information Systems (GIS) showing satellite imagery of the earth. In both cases, the raw image data must be viewed at a number of different scales to reveal notable features. Similarly, both data types become meaningful only when significant landmarks in the images are labeled. For geographical data, an impressive array of computational tools have been developed to represent the imagery overlaid with annotated features to form high-resolution maps of the planet available from everywhere via web-based interfaces. In biology,
∗To whom correspondence should be addressed.
features such as tissues, cells or organelles can be distinguished on different scale levels and serve as a map to orient in the complex anatomy of the biological entity. It is clear that large anatomical scans of biological specimens must be accompanied with proper ‘maps’ of relevant biological features to enable insights into the organization and function of biological systems. Modern neurobiology is particularly active in mapping high-resolution anatomy (Mikula et al., 2007) and patterns of gene expression (Lein
et al., 2007) in the brain.
We present here a decentralized web interface, modeled after GoogleMaps™, to navigate large multidimensional biological image datasets and collaboratively annotate features in them. We demonstrate the navigation, annotation and sharing functionality of the Collaborative Annotation Toolkit for Massive Amounts of
Image Data (CATMAID) on a serial section Transmission Electron Microscopy (ssTEM) dataset covering the neuropile of one half of
the first instar larval brain of Drosophila melanogaster.
2 IMPLEMENTATION
CATMAID combines three main components: a centralized data server, decentralized image servers and the client-side user interface (Fig. 1A).
The data server stores meta-information about datasets, users and annotations in a PostgreSQL database. The entities of the database are projects, stacks, annotations, spatial entities and users. Projects implicitly define global reference frames in 3D space and thus provide a spatial context for annotations and images. Stacks are image datasets prepared for viewing through CATMAID (see below). A stack stores its dimensions in pixels, the 3D resolution in nm/px and a base URL to the image server. Stacks reference projects through a translation vector. That is, each stack may appear in several contexts registered relative to different reference frames. All stacks referencing the same project can be navigated synchronously.
Annotations are textlabels or references to higher level semantic frameworks, e.g. ontology terms. An annotation may be referenced by an arbitrary number of spatial entities and vice versa. Spatial entities are point locations or 3D regions in a project reference frame. By this means, all image stacks in the same project context share a common set of annotations. The current implementation supports point locations and textlabels being the simplest form of spatial entities and annotations. Access to projects is modulated by user privileges whereas users are defined by a unique name and password. Optionally, projects may be visible for the public.
The user interface is implemented in Javascript. It requires no third party plugins and runs platform independent on the most popular web browsers. All interactions between the user interface and the data server are realized as
© 2009 The Author(s)
This is an Open Access article distributed under the terms of the Creative Commons Attribution Non-Commercial License (http://creativecommons.org/licenses/ by-nc/2.0/uk/) which permits unrestricted non-commercial use, distribution, and reproduction in any medium, provided the original work is properly cited.
[15:20 26/6/2009 Bioinformatics-btp266.tex] Page: 1985 1984–1986 CATMAID
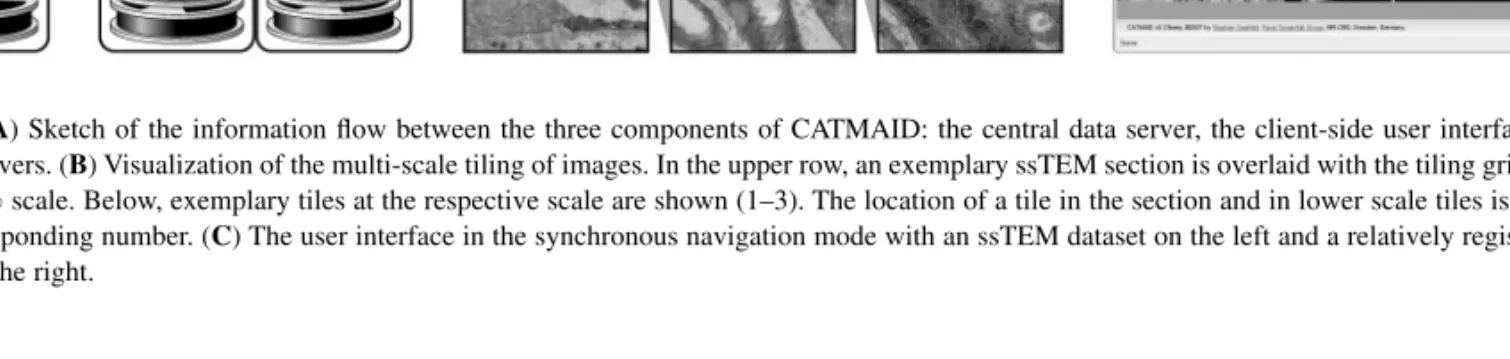
Fig. 1. (A) Sketch of the information flow between the three components of CATMAID: the central data server, the client-side user interface and several
image servers. (B) Visualization of the multi-scale tiling of images. In the upper row, an exemplary ssTEM section is overlaid with the tiling grid at 25%, 50% and 100% scale. Below, exemplary tiles at the respective scale are shown (1–3). The location of a tile in the section and in lower scale tiles is indicated with the corresponding number. (C) The user interface in the synchronous navigation mode with an ssTEM dataset on the left and a relatively registered confocal stack on the right.
asynchronous HTTP data requests using Javascript Object Notation (JSON) for data transfer. The server-side implementation is realized in PHP.
CATMAID is a web companion to the TrakEM2 software (Cardona, 2006) for management, registration and analysis of large-scale ssTEM datasets. TrakEM2 is able to export image data in CATMAID compatible format.
While the classical GIS presents the surface of a planet that is a 2D dataset, CATMAID was designed to show 3D microscopy data, in particular from serially sectioned volumes. The canvas provides the means to zoom and pan a section and navigate through the volume alongside the section index.
For rapid browsing at multiple scales, we consider each section as a tiled scale pyramid (Fig. 1B). Each scale level has half the resolution of the previous and is split into 256×256px-tiles that are saved in JPEG-compressed format. By this means, the browser requests only those tiles that are visible at once. Instead of generating the tiles on the fly from the original image data, we initially generate the whole tiled scale pyramid and store it to the file system. This results in≈11
3× the number of pixels of the
original image, which is typically reduced to about 10% storage space by JPEG-compression. Tiles are ordered by file name convention. Each section is stored in a directory whose name is the section index. A tile’s name contains the row and column in tile coordinates and the scale index i where f=1/2iis the scale factor relative to the original resolution. For example,
‘4/14_20_2.jpg’ identifies the tile at row 14 and column 20 in Section 4 at scale level 2.
The scale pyramid can be exported directly from qualified software such as TrakEM2 or alternatively generated using a custom ImageMagick shell script that is executed locally on the image server. Subsequently, the user registers the dataset as a project within the CATMAID viewer by providing a world-accessible URL pointing to the scale pyramid. In this way, the primary image data remain decentralized, while the project properties stored in a centralized database enable cross-referencing.
3 DESCRIPTION OF THE USER INTERFACE
Initially, the interface shows the project toolbar that contains a pull-down list for stack selection and input fields for user login. The main screen shows a comprehensive list containing all accessible projects and related stacks. After successful user log-in, the pull-down list and the main screen are updated respectively.
As soon as a stack is opened in the context of a project by selection in the pull-down or on the main window, the navigation toolbar appears. All stacks referencing the same project can be opened at the same time. The focused stack binds and updates all control devices in the navigation toolbar. The user can navigate all opened stacks with mouse, mouse wheel, keyboard or by using the sliders and input
fields in the navigation toolbar. Each navigation command is caught by the focused stack, transferred into the project coordinate frame and sent to the project instance. The project instance propagates the instruction to all opened stacks. In this way, all opened stacks are navigated in perfect synchrony regardless of their resolution or scale.
Annotations are placed directly on top of a stack. The textlabel toolbar provides input elements to change color and font size. Annotations reference the project as a whole, that is, each stack that is linked to the project will display all project annotations regardless of whether they were created on top of another stack.
We implemented an asynchronous message system for long-term server-side image processing tasks such as retrieval of a small 3D subset of the entire dataset (micro-stack) for offline processing. Such a job is processed on the server side and notifies the user when it is finished.
The interface can export the current view including all opened stacks, location and scale as a parameterized URL (bookmark). If invoked by such a URL, the interface immediately recovers the view. In this way, researchers can easily share bookmarks pointing to particular regions of interest.
4 RESULTS AND DISCUSSION
We demonstrate the application of the viewer on two tiled serial section TEM datasets of Drosophila first instar larval brains (http://fly.mpi-cbg.de/catmaid-suppl). The registered dataset consists of 85 sections of 60nm thickness and shows lateral neuronal layers and part of the neuropile. It was imaged using a moving stage operated by the Leginon software (Suloway et al., 2005). The images are 2048×2048px at 4nm/px and were taken with ∼6% tile overlap, 9×9 images per section, resulting in 6885 images. The tiles were registered both within and across sections using a fully automatic global registration approach implemented as part of TrakEM2 (Saalfeld et al., manuscript in preparation).
The registered Drosophila first instar larval brain dataset was converted into a CATMAID compatible scale pyramid yielding 21846 tiles per section and 1856910 tiles for the whole dataset. For such a massive 3D image mosaic covering a substantial portion of the larval brain at 4nm/px resolution, the CATMAID interface offers unprecedented flexibility in navigation, and enables collaborative
[15:20 26/6/2009 Bioinformatics-btp266.tex] Page: 1986 1984–1986 S.Saalfeld et al.
annotation and sharing of the locations of regions of interest via bookmarks. Moreover, the interface allows linked navigation of multiple registered datasets, even at vastly different resolutions such as that of electron and confocal microscopy (Fig. 1C; http://fly.mpi-cbg.de/catmaid-suppl).
The CATMAID interface is applicable to any 2D or 3D multimodal biological image datasets, as shown in examples of stitched confocal 3D volumes (http://fly.mpi-cbg.de/catmaid-suppl). The tool will become especially powerful when comparing registered 3D stacks of different biological specimens labeled to visualize tissue-specific gene expression.
Additionally, the CATMAID interface can be used to navigate, annotate and bookmark locations in any large image canvas. Some of the possible applications in biology are viewing of scientific posters and browsing large-scale in situ image datasets (Tomanˇcák et al., 2007; http://fly.mpi-cbg.de/catmaid-suppl).
Future versions of the interface will feature ontology-based project-specific semantic frameworks and interactive tools for
drawing of 3D regions of interest. We plan to expand the scope of the viewer to support an arbitrary number of dimensions allowing navigation of multimodal, time-lapse microscopy data.
Conflict of Interest: none declared.
REFERENCES
Cardona,A. (2006) TrakEM2: an ImageJ-based program for morphological data mining and 3d modeling. In Proceedings of the ImageJ User and Developer Conference, Luxembourg.
Lein,E. et al. (2007) Genome-wide atlas of gene expression in the adult mouse brain.
Nature, 445, 168–176.
Mikula,S. et al. (2007) Internet-enabled high-resolution brain mapping and virtual microscopy. NeuroImage, 35, 9–15.
Suloway,C. et al. (2005) Automated molecular microscopy: the new Leginon system.
J. Struct. Biol., 151, 41–60.
Tomanˇcák,P. et al. (2007) Global analysis of patterns of gene expression during drosophila embryogenesis. Genome Biol., 8, 145.1–145.34.