HAL Id: cea-02504285
https://hal-cea.archives-ouvertes.fr/cea-02504285
Submitted on 9 Dec 2020
HAL is a multi-disciplinary open access
archive for the deposit and dissemination of
sci-entific research documents, whether they are
pub-lished or not. The documents may come from
teaching and research institutions in France or
abroad, or from public or private research centers.
L’archive ouverte pluridisciplinaire HAL, est
destinée au dépôt et à la diffusion de documents
scientifiques de niveau recherche, publiés ou non,
émanant des établissements d’enseignement et de
recherche français ou étrangers, des laboratoires
publics ou privés.
Intact NMR spectroscopy: slow high-resolution magic
angle spinning chemical shift imaging
Covadonga Lucas-Torres, Alan Wong
To cite this version:
Covadonga Lucas-Torres, Alan Wong. Intact NMR spectroscopy: slow high-resolution magic
an-gle spinning chemical shift imaging. Analyst, Royal Society of Chemistry, 2020, 145, pp.2520-2524.
�10.1039/D0AN00118J�. �cea-02504285�
Please do not adjust margins
Please do not adjust margins
Intact NMR spectroscopy: slow high-resolution magic angle
spinning chemical shift imaging
Covadonga Lucas-Torres, Alan Wong*
High-Resolution Magic-Angle Spinning Chemical Shift Imaging (HR-MAS CSI) has recently been explored for nuclear magnetic resonance (NMR) metabolomics and showed a considerable promise in organism research. This is owing to its capability of offering a supplemental dimension – spatial metabolic distribution – in the profiling. However, HR-MAS CSI suffers from the large centrifugal stress exerted onto the sample, which inevitably hinders the metabolic assessments. Herein, a slow sample spinning strategy was implemented and evaluated. The results demonstrate a potential – with high quality data and feasibility – as a highly informative profiling approach to intact specimens.Metabolomics is one of the significant OMICS fields which study the chemical profiles of the low-molecular weight metabolites (<1 kDa) those responses to the metabolism of interest. It plays a vital role of untangling many biocomplexities in life sciences.1
This is, in fact, the consequence of the vast advancement of bioanalytical technologies; they play a significant role on the development of metabolomics. Among them, NMR spectroscopy has found tremendous success due to its simplicity and versatility of acquiring unbiased and rich metabolic information on diverse biospecimens. In particular, High-Resolution Magic-Angle Spinning (HR-MAS) is a valuable NMR tool for profiling the metabolic constituents inside the heterogeneous specimens such as whole cells and organisms, and tissues. It benefits from the capacity of offering high spectral quality data by rapidly rotating the sample at a 54.74° (magic-angle) to the NMR magnetic field. This suppresses the unwanted magnetic susceptibility line broadening ascribed within the sample. For this reason, HR-MAS NMR is a well-established technique and vastly applied. This includes intact NMR studies of a single mm-scaled organism,2 and even a
small-scaled animal.3 However, despite its versatility, HR-MAS only
offers a global metabolic view of the entire organism, masking the profiles of the specific anatomy.
Recently, an advanced development of HR-MAS methodology – with chemical shift imaging (CSI) – has been introduced2b and explored4 towards metabolomics. HR-MAS CSI
offers an additional spatial dimension for the possibility of a homogeneous profiling (i.e. localized spectroscopy along the sample rotational axis) from a heterogeneous specimen such as an intact organism. The experiment is taking advantage of the sample spinning with HR-MAS for providing the essential high quality spectral data, and a gradient field for localizing the metabolic profiles along the rotational axis z’ (magic-angle axis). Indeed, the capability of simultaneous profiling the different anatomies in a single HR-MAS CSI experiment should offer a
valuable analytical approach for intact study of an organism. However, the induced centrifugal stress by MAS exerted onto the organism can inevitably disrupt the metabolic profiles (i.e. change in the metabolic activities or even in the morphology). A common strategy for subsiding the stress is by reducing the sample spinning. For example, spinning the sample at 500 Hz instead of 5000 Hz would reduce the force by two-order of magnitude. However, the issue is the presence of the dense spinning-sideband manifolds on the spectrum (denoted as ssb), which can complicate the analysis and, sometimes, impossible. Most efforts on slow spinning HR-MAS have been focusing on suppressing these ssb by (i) manipulating the rotor-phases in the pulse-experiments,5 (ii) improving the water suppression
efficiency,6 (iii) utilizing the isotope 2H detections,7 (iv)
optimizing the sample preparations,8 and by (v) spectral
manipulation.9
This study intends to improve the HR-MAS CSI strategy for intact NMR spectroscopy by incorporating a slow sample spinning experiment together with the use of the integrated homospoil z’-gradient (for improving the feasibility). Both have yet to be explored. The experimental design is discussed and applied to a food phantom and an intact insect wasp (Vespula
germanica). The detail descriptions of the experimental
strategies and results will offer the basis for designing future intact studies with slow sample spinning HR-MAS CSI.
The integration of HR-MAS CSI pulse experiment with a ssb suppression is facilitated by the spin-echo nature in both experiments. It can be achieved by replacing the refocusing p pulse in CSI with a set of rotor-period composite p pulses (see Fig. S1). A major concern for metabolomics is the length of the experiment carrying out on susceptible specimens. This is especially of importance for a two-dimensional (2D) HR-MAS CSI with the chemical shift profile in F2 and the spatial profile in F1. As such, HR-MAS CSI can be a time demanding experiment. It depends on the number of t1 spatial encoding (denoted herein as t1CSI), and the detection sensitivity (i.e. metabolic abundance). Therefore, the choice of implementing the ssb suppression experiment must not dramatically lengthen the acquisition.
Total Suppression of Sidebands (TOSS) is a 1D ssb suppression experiment10 and should be a beneficial facto to
the integration; however, TOSS is highly susceptible to the imperfection of the p pulses and the instabilities of the spinning. Both can result in distorted spectral.11 An extensive 243-steps
phase cycling scheme are often necessary to overcome the effect of the pulse imperfections,12 and has successfully applied
The current preferred ssb suppression is a pseudo-2D Phase-Adjusted Spinning Sidebands (PASS),13 with t1 associated to the
signal evolution of the ssb (denoted herein as t1PASS, often with
8, 16 or 32 increments). Despite its 2D nature, PASS, in general, has better resistance to the pulse imperfection as compared to TOSS,11 rendering a more effective approach with a less
strenuous phase cycling scheme.5 This includes an 11-steps
cogwheel phase cycling scheme.14 Fig. S2 shows the results of
PASS with an 11-steps phase cycling.
This study incorporates the PASS experiment into the HR-MAS CSI (denoted herein as HR-PASS CSI) with an 11-steps cogwheel phase cycling scheme. HR-PASS CSI is essentially a pseudo-3D experiment by acquiring a series of individual 2D CSI spectra, each with an identical t1CSI spatial encoding but with
different t1PASS steps. In this study, an 8-steps t1PASS is applied.
As a result, the total acquisition time of HR-PASS CSI can be estimated with (11 ´ 8)·t1CSI. This is significantly shorter than
that of an incorporation with TOSS, (243)·t1CSI.
In contrast to the previous HR-MAS CSI experiments,2b,4 this
study also explores the convenience of the experimental setup by exploiting the integrated homospoil gradient field Gz (along
the magic angle z’) of a conventional HR-MAS probe, without an external pulsed field gradient (PFG) system. In general, homospoil generates a weaker gradient field (and less durable) as compared to PFG; however, the field efficiency is compensated by the proximity to the sample. But one cautious note should be considered when applying the homospoil gradient. The duty cycle (the fraction of the pulse in one acquisition) should not exceed the specification limit.15
As shown in Fig. S1b, rotor synchronization periods (tR) are
carried out throughout the pulse experiment – the echo delays (TE), the 5p PASS pulses and the gradient pulse (δ). Consequently, this study limits the spinning frequency to 500 Hz and renders a fixed value of 2 ms for δ in the experiments. Subsequently, the field-of-view (FOV) in CSI is regulated by the gradient amplitude (GZ) and the t1CSI encoding (FOV = [t1CSI] ×
[k·1Hγ·δ·GZ]-1, where k is a scaling factor and γ is the 1H
frequency).
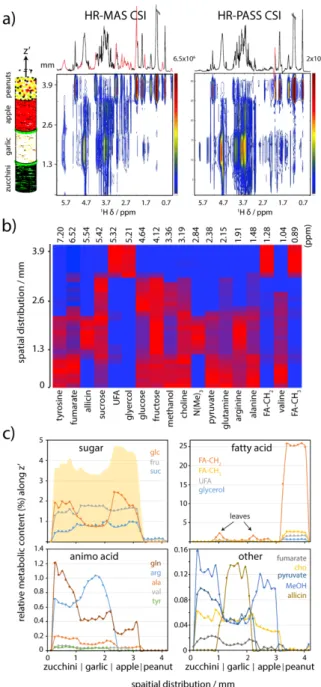
Food tissue is an excellent phantom to evaluate the capability of metabolic profiling with HR-PASS CSI owing to their uniform distributions of the metabolites in the tissue and, as necessary, it offers superior signal resolutions. The phantom consists of four distinct layers [zucchini (or courgette) – garlic – apple – ground peanuts], each with a thickness of ~1 mm, placed transversely at the centre of the rotor. A single thin individual green leaf (of about 20 µm in thickness) is strategically placed between the layers of zucchini and garlic, and garlic and apple to evaluate the spatial separation by HR-PASS CSI.
As shown in Fig. 1a, both HR-MAS CSI and HR-PASS CSI exhibit a 2D spectrum with a spatial z’ distribution (in mm) along F1, separating the individual sliced spectral profiles (in 1H d
ppm) in F2. Experimental details can be found in ESI. Both experiments were acquired with identical spatial encoding parameters, with a FOV of 8.3 mm attributed by a 64 t1CSI and
10 % of GZ. This results in a slice resolution DS (FOV / t1CSI) of
0.13 mm. As expected the acquisition time for HR-PASS CSI is 8
times longer (8 t1PASS) with a duration of two hours. However,
based on the well-defined spatial profile (Fig. S3), the data acquisition could readily shorten by half (or more) with 32 t1CSI,
which doubles the DS to 0.26 mm.
The HR-MAS CSI spectra (Figs. 1a and S4) reveal highly congested spectra with ssb signals masking some significant metabolites. For example, a large ssb appears at 6 ppm in the slice spectra associated with the garlic layer has overlapped with a set of multiplets of organosulfur allicin. In contrast, the results from HR-PASS CSI exhibit ssb-free spectra with isotropic metabolic signals. With one exception, a single ssb signal of the fatty acid methylene resonance is observed. This is ascribed from the large fatty acid content in the peanut layer. The stacked plot of the slice spectra in Fig. S5 shows distinct profiles among the different food layers. This is also supported by a principal component analysis. The superior peak resolution (with <0.02 ppm) allows for a rich metabolic identification for each layer (Tables S1-S2). It is noteworthy that a subsequent fast sample spinning (4000 Hz) HR-MAS CSI has been carried out (Fig. S5), and showed a dramatic change in the spectral profile for the individual layers, indicating a displacement of the metabolic fluids among the layers.
Exploiting the superior spectral quality data, a heatmap of the relative metabolic content (Rmet) along the z’ is constructed
(Fig. 1b). For each slice spectrum, Rmet can be estimated by the
individual metabolic integral (Imet): Rmet = [100% × Imet] / [NH-met
× Ispectral sum], where NH-met is the number of corresponding
protons, and Ispectral sum is the total integral between 0.5-8.5 ppm
excluding the water signal. This is followed by a colour coding scheme with red being the highest content and blue at zero. Subsequently, each colour box along z’ corresponds to DS. The heatmap displays a few hidden variances that are not evident from the spectra. For examples, it reveals the different sugar distributions in the layers; allicin in the garlic layer; alanine, glutamine and fumarate in the zucchini layer; and the fatty acids
Please do not adjust margins
associated within the thin layer of the green leaf (more discussion below).
Fig. 1 1H CSI spectra of a food phantom at 11.75 T with a sample spinning at 500 Hz and
with a TE of 8 ms. Experimental detail can be found in ESI. (a) 2D contour plots of HR-MAS CSI and HR-PASS CSI with the z’ spatial distribution (in mm) along F1 and the localized 1H chemical shifts (in ppm) along F2. The F2 projection of HR-MAS CSI shows a
highly congested spectrum with the ssb (highlight in red); however, HR-PASS CSI shows the contrary. (b) A heatmap showing the estimated relative metabolic content (Rmet)
along z’. The description of Rmet is discussed in the text. Each colour box along z’
corresponds to a DS of 0.13 mm with red represents the highest metabolic content and blue represents zero. (c) Heatmap z’ projection of the individual metabolite showing the metabolic distributions across the different food layers. The shaded area in the sugar plot represents the sum Rglc + Rfru + Rsuc.
The z’ projection of the heatmap (Fig. 1c) shows a greater extent of the metabolic distributions across the layers. Among the NMR observable metabolites, sugars comprise the highest – excluding fatty acids – metabolic content (ca. 1–2 %). The plot exhibits an apparent variation among the common natural sugars (sucrose, fructose and glucose) in the food tissues.
Moreover, it discloses that the apple layer consists of the highest total sugar level (i.e. sweetest among the layers) as compared to that of the garlic with the lowest. For fatty acids, the peanut layer, as excepted, consists of the highest content. However, a small – but visible – increased level of fatty acids can be located in between the food layers (zucchini | garlic and garlic | apple). Similarly, a subtle increased of choline is also found at the same z’ location. These increased contents are associated with the green leaves between the layers. Since the acquired DS, 130 µm, is much greater than the leaf thickness ~20 µm, the observed metabolic signals (including the fatty acids and choline16 and others) are expected to overlap with the
neighbouring profiles.
To illustrate the feasibility of HR-PASS CSI to a single intact organism, Figs. 2 and S6 show the resultant spectra of an insect wasp. The data were acquired with a DS of 0.26 mm and with a total acquisition time of 70 minutes. No visible body damage (or fluids) is found after the experiment. Experimental details can be found in ESI. The insect diameter (ca. 3.0 mm) is similar to the inner rotor diameter. This allows securing the insect with the longitudinal body axis aligned with the z’, and permits for profiling the transverse plane of the distant anatomical sections of a wasp: tail, mid and head. The resultant HR-PASS CSI spectra were collected with a T2-contrast (TE = 100 ms). The benefits
with a T2-contrast experiment on the wasp are shown in Fig.
S6b. The long TE: (i) improves the spectral bassline by removing the broad signals of the macromolecules such as proteins; (ii) improves the water suppression and sequentially minimizes (or even eliminates) the residual ssb; and as importantly, (ii) enhances the metabolic signals by suppressing fatty acid signals (e.g. 0.86 ppm, 1.24 ppm, 1.59 ppm …) and ssb. It is noteworthy that if a T2-contrast experiment (instead of 8 ms) was applied to
the food phantom above (Fig. 1a), it would probably subside the observed ssb of the methylene fatty acid.
About 20 metabolites are tentatively identified (Table S3), and a few resolved metabolic signals are exploited in the heatmap analysis (Figs. 2 and S7). The corresponding z’ projection reveals the individual metabolic profile across the anatomical sections. The results show that the tail consists of a higher content of fatty acid as compared other sections. Interestingly, it also able to locate the venom region within the tail. Based on the heatmap analysis, the size of the venom region is about 1 mm along z’. It is known that venom contains three significant metabolites:17 (1) amine-derivatives (such as
histamine) involves in the inflammatory response by increasing the permeability of blood capillaries; (2) serotonin plays a role in irritation and contributes to pain; and (3) acetylocholine increases the perceived pain. Fig. S8 shows the presence of the acetylcholine and serotonin signals in the slice spectrum of the venom region. The unassigned peaks at 8.34 and 7.27 ppm could be related to the physiologically active amine derivatives in the venom.
In the mid-section, HR-PASS CSI reveals a high level of taurine and betaine (Fig 2). Interestingly, there is also a variance in the sugars. While, both glucose and fructose are significant in the head and tail sections, but only a hint of glucose is found in
the mid-section. These observed differences could relate to the different in blood metabolisms18 in the different anatomy.
Fig. 2 (a) Representative F2 slice projection spectra of HR-PASS CSI (spinning at 500 Hz
with a TE of 100 ms) for each anatomical section: green-tail; red-mid; blue-head. The projections are indicated by the dotted line in the 2D spectrum in Fig. S6a. Peak assignments are summarized in Table S3. (b) Heatmap showing the metabolic variations across the different anatomies. Each box along z’ corresponds to a DS of 0 26 mm with red represents the highest metabolic content and blue represents zero. The z’ projections are shown in Fig S7.
To evaluate the reproducibility of HR-PASS CSI experiment, an experiment with identical setup (spatial encoding and PASS evolutions) was performed on a second wasp individual (WASP #2). The heatmap analysis exhibits similar metabolic distributions across the anatomical sections (Fig. S7). Of course, more experiments and data are necessary to reaffirm the reproducible quantification of HR-PASS CSI profiling. Nevertheless, the results shown here offer a promising potential to metabolomic study of intact organisms.
The experimental strategy present here with HR-PASS CSI can be considered as an incremental – but significant – improvement to the previous HR-MAS CSI. It offers both spatial and chemical information on a conserved intact specimen. HR-PASS CSI could render a potent metabolic NMR profiling approach to organism research. This study provides the basis for designing intact NMR metabolomics. As importantly, it also offers the fundamentals for incorporating additional spin-edited pulse experiments – such as diffusion or X-spin filtered –
prior to HR-PASS CSI. Moreover, the PASS sequence could also be readily implemented in 1D slice localized spectroscopy[2b] for
a direct profiling on a specific region of interest. This would permit a quick data acquisition and further enhances the conservation of the specimens, but the drawback is a prior knowledge of the spatial region of interest is necessary.
HR-PASS CSI could provide a new prospective for intact NMR-based metabolomics of research organism. The abilities of (i) unfolding the specific metabolic profiles from a heterogeneous specimen; and (ii) simultaneous profiling the different autonomic regions should provide a vital parallel investigation on the concurrent metabolic activities of interest, offering in-depth insights in life sciences.
All spectra data were acquired on a 500 MHz Bruker Avance II equipped with a conventional Bruker 4-mm HR-MAS probe. The detailed description of the experiment can be found in ESI. The study was supported by the French Agence Nationale de la Recherché (ANR-16-CE11-0023-01).
Conflicts of interest
Authors declare there are no conflicts to declare.
Notes and references
1 J. K. Nicholson, I. D. Wilson ID, Nat. Rev. Drub Discov., 2003, 2, 668.
2 (a) M. Bastawrous, A. Jenne, M. T. Anaraki, A. J. Simpson,
Metabolites, 2018, 8, 35; (b) V. Sarou-Kanian, N. Joudiou, F.
Louat, M. Yon, F. Szeremeta, S. Même S, et al. Sci Rep. 2015,
5, 1–5; (c) V. Righi, Y. Apidianakis, D. Mintzopoulos, L.
Astrakas, L. G. Rahme, A. A. Tzika, Int. J. Mol. Med. 2010, 26, 175.
3 R. A. Wind, J. Z. Hu, D. N. Rommereim, Magn. Reson. Med., 2003, 50, 1113–9.
4 A. Wong, C. Lucas-Torres, Anal. Bioanal. Chem., 2019, 411, 1591.
5 R. A. Wind, J. Z. Hu, Prog. Nucl. Magn. Reson. Spectrosc., 2006,
49, 207.
6 Y. L. Mobarhan, J. Struppe, B. Fortier-McGill, A. J. Simpson,
Anal. Bioanal. Chem. 2017, 409, 5043.
7 Y. L. Mobarhan, R. Soong, W. Bermel, M. J. Simpson, J. Struppe,H. Heumann,S. Schmidt, H. Boenisch,D. Lane,A. J. Simpson, ACS Omego 2018, 3, 17023.
8 M. Renault, L. Shintu, M. Piotto, S. Caldarelli, Sci. Rep., 2013,
3, 3349.
9 M. A. Burns,J. L. Taylor,C-L. Wu,A. G. Zepeda,A. Bielecki,D. Cory,L. L. Cheng, Magn. Reson. Med., 2005, 54, 34.
10 W. T. Dixon, J. Magn. Reson., 1981, 44, 220. 11 J. Z. Hu, R. A. Wind, J. Magn. Reson., 2002, 159, 92.
12 O. N. Antzutkin, M. H. Levitt, J. Magn. Reson. Series A, 1996,
118, 295.
13 O. N. Antzutkin, S. C. Shekar, M. H. Levitt, J. Magn. Reson., 1995, A115, 7.
14 N. Ivchenko, C. E. Hughes, M. H. Levitt, J. Magn. Reson., 2003,
164, 286.
15 The upper limit for a Bruker HR-MAS probe is suggested to be of ~4 ms (δ) at 70 % (Gz) of a 10 A amplifier.
16 D. Augustijn, U. Roy, R. van Schadewijk, H. J. M. de Groot, A. Alia, PLOS ONE, 2016, DOI:10.1371/journal.pone.0163258 17 M. Moreno, E. Giralt, Toxins (Basel), 2015, 7, 1126. 18 R. D. Fell, Camp. Biochem. Physiol., 1990, 95A, 539.
1
Electronic Supplementary Information
Intact NMR spectroscopy: slow high-resolution magic angle spinning chemical shift
imaging
NMR Experiment
Experimental details
p2
Fig S1. Pulse experiments
p4
Fig S2. Slow sample spinning spectra with different phase-cycling schemes
p5
Food phantom
Fig S3. 1H density F1 projection of the food phantom
p6
Fig S4. Spectra comparison of the individual food layers
p7
Fig S5. Spectral [F2 and F1] and PCA comparison of fast and slow CSI
p8
Intact wasp
Fig S6. 2D spectrum and its comparison with different TE in HR-PASS CSI
p9
Fig S7. Heatmap comparison between two individual wasp #1 and #2
p10
Fig S8. Spectral fitting on the venom metabolites
p11
Peak assignment
Table S1. Metabolites in the food phantom
p12
Table S2. Fatty acids in the peanut layer
p13
Table S3. Intact wasp (tail, mid, head)
p14
2
Experimental Details
Sample preparation
The samples were packing into a standard 4-mm ZrO
2rotor with an internal spacer at the
bottom. A top Kel-F insert was used to secure the samples. No buffer or D
2O were added to
avoid the displacement of metabolites during the sample spinning.
Food phantom: The phantom (Fig 1a) with fresh local food layers was prepared by punching
the individual pre-sliced layer (ca. 1mm) with the open-edge rotor.
Wasp: Three individual wasps was caught locally – within few minutes apart – and
immediately snap-freeze and stored under –80 °C until the acquisition. The frozen wasp was
placed entirely inside the rotor with the head at the bottom. The body dimensions of the three
wasps were nearly identical with 3 mm in diameter. This allowed a tight fix inside the rotor
preventing body movement during the spinning. Among the three wasps, one was sacrificed for
setting up the experiments: from field shimming, testing the phase cycling schemes (Fig S2) to
setting up the spatial encoding parameters and the different TE (Fig S6). Other two wasps
(WASP #1 and #2) were used to evaluate the HR-PASS CSI experiment and its data
reproducibility (Fig S7). Spectra data of WASP #1 were discussed in the text (Fig 2). It should
be noted that no visible destructions (or fluids) on the body were found after the HR-PASS CSI
experiment.
NMR experiments
1H experiments were performed on a Bruker Avance II spectrometer operating at 499.16 MHz,
with a three channel Bruker 4-mm HR-MAS probe integrated with a homospoil z’-gradient.
The gradient was operated by a 40 A amplifier. The fast- and slow-sample spinning were carried
out with MAS II at rate of 4000 and 500 Hz, respectively, with ± less than 2 Hz. NMR spectra
were collected with 16 k time domain points, 20 ppm sweep width, 1 s low-power presaturation
pulse as a recycle delay, and with an echo time (TE = 2 × N number of rotor period t
R) of 8 ms
for the food phantom and 100 ms for the intact wasp. The number of accumulative scan was set
to one-full phase cycling: 16 for HR-MAS CSI and 11 for HR-PASS CSI. In all CSI (including
HR-PASS CSI) experiments, the gradient pulse length (δ) was set to a fixed value of 2 ms
(n·t
R); subsequently, the desired field-of-view (FOV) was adjusted by the gradient steps t1
CSItogether with the gradient amplitude G
Z(i.e. FOV = [t1
CSI] × [k·
1H
γ·δ·G
Z]
-1