HAL Id: halshs-00459167
https://halshs.archives-ouvertes.fr/halshs-00459167
Submitted on 23 Feb 2010
HAL is a multi-disciplinary open access archive for the deposit and dissemination of sci-entific research documents, whether they are pub-lished or not. The documents may come from teaching and research institutions in France or abroad, or from public or private research centers.
L’archive ouverte pluridisciplinaire HAL, est destinée au dépôt et à la diffusion de documents scientifiques de niveau recherche, publiés ou non, émanant des établissements d’enseignement et de recherche français ou étrangers, des laboratoires publics ou privés.
Air-sea linkages in European port cities
César Ducruet, Olivier Joly, Hipolito Martell Flores
To cite this version:
César Ducruet, Olivier Joly, Hipolito Martell Flores. Air-sea linkages in European port cities. 5th Inha & Le Havre International Conference ”International Trade and Logistics, Corporate Strategies and the Global Economy: European and East Asian Experiences”, Sep 2005, Le Havre, France. �halshs-00459167�
Air-Sea linkages in European Port Cities
5th Inha & Le Havre International Conference, Le Havre, Oct. 28-29 (2005)
César Ducruet, Ph. D. (Transport Geography) Researcher
Korea Research Institute for Human Settlements (KRIHS)
1591-6 Gwanyang-dong, Dongan-gu, Anyang-si, Gyeonggi-do 431-712 South Korea [email protected]
Olivier Joly, Ph. D.
Associate Professor (Transport & Territorial Management)
FRE CNRS 2975 CIRTAI University of Le Havre- 25 rue Philippe Lebon F – 76086 Le Havre Cedex, France
Hipolito Martell Flores, Civil Engineer, (UNAM), MSc Transport Engineering, (UNAM) PhD Candidate (Transport & Territorial Management)
FRE CNRS 2975 CIRTAI University of Le Havre- 25 rue Philippe Lebon F – 76086, Le Havre Cedex, France
Abstract:
This chapter aims at highlighting the relationships between air, maritime & logistic activities of port cities in Europe. Although recent studies have considered sea-air intermodality as a locational advantage for ports and coastal urban centres, they are still few and isolated case studies. Nevertheless, this subject appears to be of growing interest for transport, logistic players and urban planners to improve port performance in a competitive context. However, there is neither an estimation nor a comparative analysis on effective air-sea relations within port city nodes. We propose a valuation of such potentials based on available and comparable data at a European scale, such as air and maritime traffics, urban population, and employment in specific transport activities (freight forwarding, logistics, warehousing, port and airport services). This innovative approach focuses on the level of interdependency between airports, ports and cities. It shows that air-sea linkages within European port cities are still not strongly interdependent.
1. Introduction
Studies of port-city linkages have become more and more numerous over the last twenty years, whereas only a few authors have led both quantitative and comparative approaches on such issues (Wang and Olivier, 2003). In a context of economical and physical port-city dysfunction, geographers and planners have concentrated their efforts on the urban-port interface, taking into consideration that wider levels of organisation of port, urban and maritime systems are acquired knowledge. However, some recent studies of general port-city relationships at global (Ducruet 2004; forthcoming) and continental (Ducruet, 2003; Joly and Martell 2003; IRSIT 2004; Ducruet and Jeong, 2005) levels, have particularly highlighted the importance of international comparison.
Taking inspiration from such works, this article deals with a very specific aspect of port-city combination, namely “air-sea” linkages. The choice of this topic is based on two factors. On the one hand, newly-designed airports exerting efficient air-sea linkages such as Incheon in South Korea (Pentaport), Chep Lap Kok in Hong Kong (Marine Cargo Terminal) and Dubai Airport are interesting experiences for European port cities, where such strategies are still lacking. In fact, the interconnection of air transport is mostly focusing on public transportation like trams, subways and railways. On the other hand, some transport companies have recently appeared on the European scene, such as Damco Air-Sea and ABX Logistics, showing a growing interest in this issue.
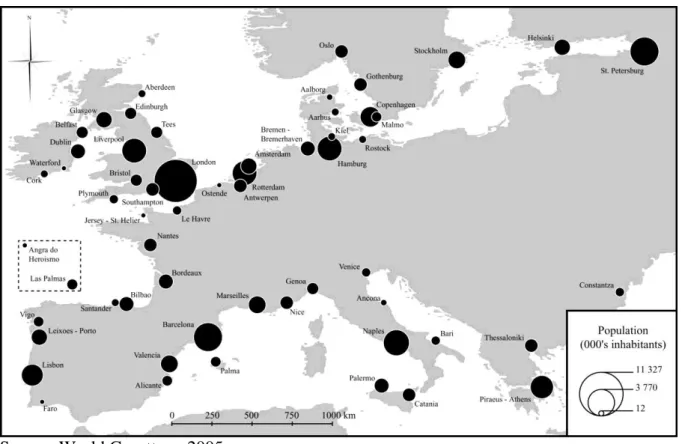
A European database including urban, port, maritime and logistic indicators is built as a mean to verify what are the factors influencing air-sea linkages among 58 port cities (Figure 1). The choice of indicators focuses on local characteristics of the nodes, in terms of employment, market size, port and airport activities. It is expected that such indicators can highlight a number of trends underlying the level of interdependency between these functions. A preliminary evaluation is available in Figure 2, with the relative share of air and sea
employment. It shows that the European territory can be explained by a centre-periphery pattern with on one side, a ring of peripheral metropolises with important air functions, and on the other side, a second ring of port gateways located close to the heartland. Groupings of European port cities, under homogeneous parameters of various characteristics, are suggested to go beyond such interpretation. Furthermore, the analysis of synthetic expressions such as principal components, resulting from simple (linear) relationships between port cities‟ air and sea functions, allows to presume some potential air-sea interactions within European port cities.
[INSERT FIGURES 1 and 2 ABOUT HERE]
2. Methodology
Factor Analysis such as Standardized Principal Components Analysis is used to discover hidden structures, and to reach an objectivity which is difficult to attain with classical techniques. The use of principal component analysis depends on a series of mathematical restraints and limitations which are particular to port cities‟ activities.
2.1 Identification of 13 variables:
The variables are chosen according to their relevance for this study (Table 1). In particular, the measurement of employment has necessitated a specific methodology. The calculation is based on the Kompass database of companies. Because these companies usually exert more than one activity, their total number of employees has been redistributed equally among the different activities, so as to enable a modal sum. Furthermore, companies have been counted at the level of the metropolitan area, what gives more reality than the city centre only.
Notably, many activities tend to locate in suburban areas such as logistic parks, airports and interchange sections at the outskirts of cities.
[INSERT TABLE 1 ABOUT HERE]
2.2 Selection of port cities and data collection
This study restricts the scope of the analysis to a sample of European port cities (Table 2). Port cities have been chosen according to their participation to the “Trans-European
Transportation Network” (TEN), relative to the „‟TEN Airport Network’’, which
distinguishes several components: “Regional & Accessibility Points”, “Community
Connecting Points” and “International Connecting Points”. Such criteria is relevant according
to the analysis of air-sea linkages in Europe, because it takes into account a specific aspect of the current European transport policy. Some other port cities have been included in the sample because they are major ports and exert important economic functions: Antwerpen, Genoa, and Copenhagen.
[INSERT TABLE 2 ABOUT HERE]
2.3 Analysing the data
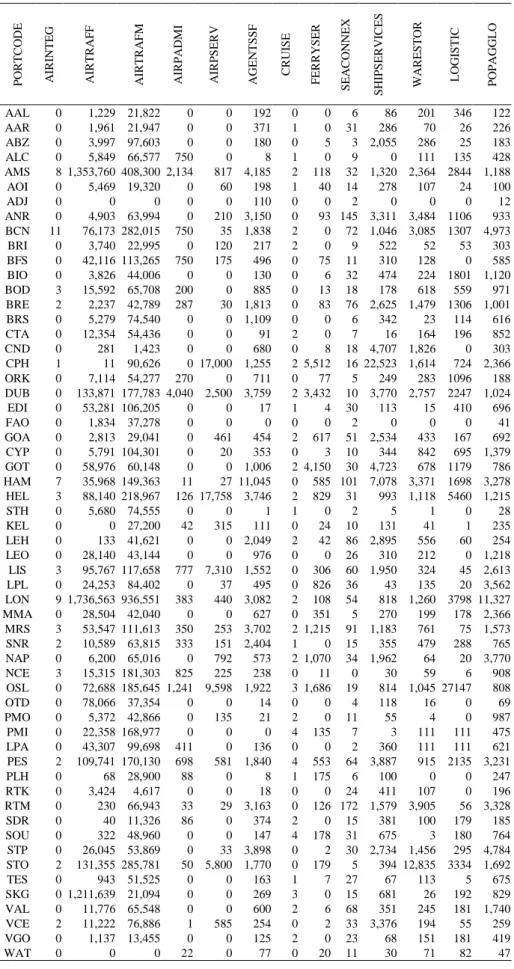
The standardised principal component analysis is here employed to develop comprehensive indexes (i.e. transformed named variables principal components or factors) reflecting the 13 port-city variables and to identify those significant indicators underlying the classification of European port cities. The data for these variables for the 58 respective European port cities are presented in Table 3.
[INSERT TABLE 3 ABOUT HERE]
3. Analysis of variable and factors (principal components) 3.1 Analysis of linear correlations
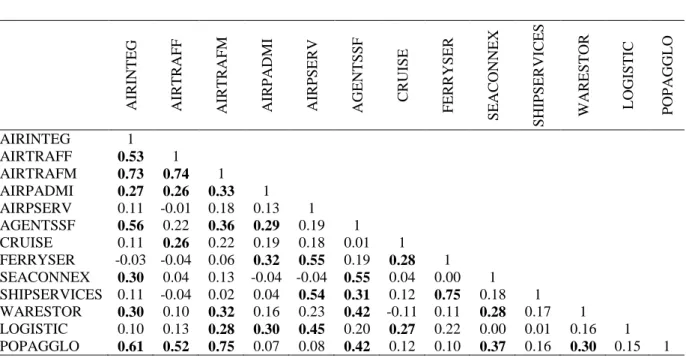
One objective of the principal component analysis is to find combinations of the 13 active variables, to produce indexes (factors F1 … F13) that are not correlated. The lack of correlation (Table 4) is a useful attribute because it means that the indexes are measuring different dimensions of the same original information.
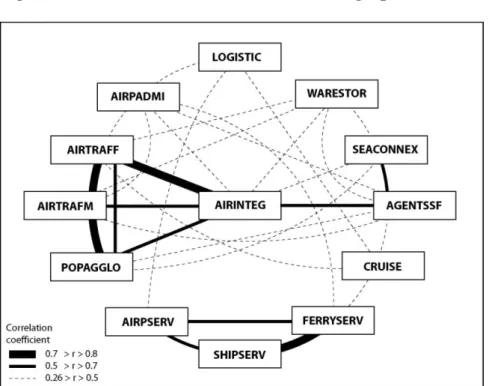
However, the first analysis of the Bravais-Pearson Correlation Matrix (Figure 3) shows that all r coefficients are positive. It means that all of the 13 variables prove to be less geographically dispersed. Discrimination between the 13 air and sea active variables is relevant according to high (up to 0.8 r max value) or low (from 0.26 r min value) statistically significant values of the r coefficient based on bilateral tests (alpha = 0.05).
[INSERT TABLE 4 and FIGURE 3 ABOUT HERE]
3.2 Analysis of factors (principal components)
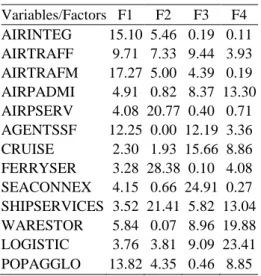
The factors are in such an order that F1 displays the largest amount of variation, F2 the second largest, and so on. Fs are also called principal components (PC). By examining the contribution of each PC to the total variance and excluding the PCs with a variance inferior to 1, represented by the eigen values of the correlation matrix (Table 5), variations in the database can be adequately described by a few PCs: 4 factors explaining almost 70% of the total variance. Thus, some economy in the use of data can be achieved. Furthermore, throughout this analysis we can obtain an appropriate weighting for each variable which can be used in indexing the overall characteristics of European port cities. Of course, these
indexes (Fs factors) are used to discriminate European port cities, which is the main objective, i.e. the classification of the port cities into significant groups.
[INSERT TABLE 5 ABOUT HERE]
F1 First principal Factor (30.61 %): Air Integration of European port cities
The first factor represents a mass statistical effect: variables are projected on the same positive side of the axis (Table 5). This first factor has the highest variance and thus shows the structure which differentiates European port cities the most, concentrating 30.61% of the original variables‟ dispersion (Tables 5 and 6). Four variables (AIRTRAFM, AIRINTEG, POPAGGLO and AGENTSSF) concentrate more than 60% of the PC‟s formation.
[INSERT TABLE 6 ABOUT HERE]
The first factor means that integration in air networks depends on location of forwarders and metropolitan market size. Thus, “Air Integration of European Port Cities” is a combination of airports‟ activities and the connection with local markets through the specific function of freight forwarding, which connects international and local scales. Port cities‟ ranking on F1 is here interpreted as a capacity of places to connect their market to air transport networks through the attraction of forwarding agents within the port city and notably in the vicinity of the airport itself.
F2 Second Factor (17.77 %): Ferry Ports & Air Traffics
F2 gives complementary information on relations brought into light by F1 and sums up almost 18% of the original data dispersion (Table 7). A strong opposition is manifested between on
one hand, FERRYSERV, SHIPSERV and AIRPSERV (3 variables contributing for 70% of F2‟s axis formation), and on the other hand AIRINTER, AIRTAFF, AIRTAFM and POPAGGLO.
[INSERT TABLE 7 ABOUT HERE]
F2 shows a statistical opposition between on one side ferry-related employment, basic port and airport activities (daily activity and administration); air traffics and freight forwarding on the other side. This can be interpreted in a way that important ports are opposed to important airports.
F3 Third factor (12.56 %): Container & Cruise Ports
This factor shows an opposition between the couple of variables SEACONNEX (total of direct links to other ports or „foreland‟) and AGENTSSF (maritime agents & forwarders) on one side, and CRUISE (number of cruise companies with regular calls in ports) on the other side (Table 8).
[INSERT TABLE 8 ABOUT HERE]
The third factor reflects two types of maritime transport activities: container shipping and cruise lines. It shows an interesting opposition between 2 groups of variables, where air transport is more related to cruise lines and metropolitan population than to the intensity of port activity.
This factor shows an opposition between the couple LOGISTIC and WARESTOR (logistic and warehouse employment) on one side and 3 variables SHIPSERVICES, CRUISE and POPAGGLO (basic port activities, cruise and metropolitan population) on the other side (Table 9). This is the less representative axis among the statistically significant axes (Kaiser criteria). However, it shows also an interesting opposition between marine activities on one side, and logistic activities on the other.
[INSERT TABLE 9 ABOUT HERE]
4. Geographical dimension of the single-cluster analysis
F1 shows that very few city ports enjoy a high integration within air transport networks. Those few are especially located along the Channel – North and Baltic Sea (Dublin, London, Amsterdam, Hamburg, Copenhagen, Oslo, Stockholm and Helsinki), with Barcelona as a Mediterranean exception. This reveals that the relative importance of port and maritime activities doesn‟t have a significant influence on the air integration of port cities; apart from Barcelona and Hamburg, the major ports (e.g. Rotterdam, Antwerpen, Genoa, Le Havre…) do not appear very well. We also assume that the north-south unbalance may be explained by the strategies of air transport operators to reach inland markets and productive centres.
[INSERT FIGURE 4 ABOUT HERE]
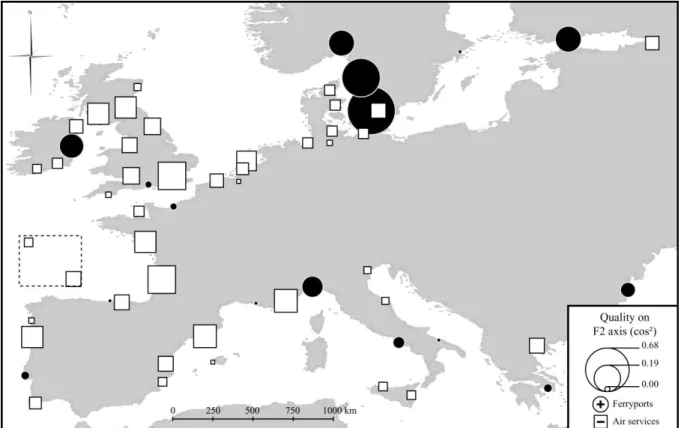
The F2 opposition has also a spatial logic throughout the European territory, with a major western concentration of air services and a minor eastern gathering of ferry ports (e.g. Baltic sea gateway). On the one hand, western cluster forms an Atlantic arc (except Dublin) and a western Mediterranean at the periphery of Europe. On the other hand, ferry ports have the
benefit of short maritime distances (e.g. Le Havre – Southampton), with a possible difference between northern and Mediterranean ferryports according to their specialisation: passengers or freight (ro-ro).
[INSERT FIGURE 5 ABOUT HERE]
F3 reinforces the trend observed in F2, with the Mediterranean basin specialised in cruise shipping. One can notice the gathering of a major northern range (Le Havre, Antwerpen, Rotterdam, Bremen Ports and Hamburg) and a Mediterranean range (Marseilles, Barcelona, Valencia and Genoa). Thus, container ports are opposed to the well established northern cruise calling ports such as Southampton, Dublin and Oslo.
[INSERT FIGURE 6 ABOUT HERE]
F4 shows different groupings such as logistic platforms creating added value (Med, Great Britain) on one side, opposed to maritime gateways (northern range, Ireland and French Atlantic city ports). This confirms the complexity of the interpretation of F4 linked to the weak dispersion of original data.
[INSERT FIGURE 7 ABOUT HERE]
5. Concluding remarks
This analysis leads to the conclusion that air-sea linkages in European port cities are still not a strong issue. Some explanation of the recurrent air-sea “opposition” might come from the historical formation of the European nodes, where port and air activities followed their own
spatial logics (Dienel 2004). Another reason is probably deriving from regional specialisation effects of European policies and spatial concentration. Then, in both functional and spatial terms, air-sea linkages in Europe have still a long way to go before becoming a reality. The sample studied, officially eligible to the “Trans-European Transportation Network” (TEN) relative to TEN Airport Network, does not yet seem developed for such air-sea strategies. The
TEN network plan may be directed towards other implications such as the support of
peripheral port cities (Morvan 1999) more than air-sea intermodality, even if some private players have a growing interest in this issue. There may be at term a risk in developing air-sea linkages in only a few concentrated places, like existing gateways, at the expense of smaller and/or remotely located city ports.
Authors, of course, are responsible for any errors in this paper.
REFERENCES
Bekemans, L. and Beckwith, S. (eds) (1996) Ports for Europe – Europe‟s Maritime Future in a Changing Environment, Brussels: European Interuniversity Press.
Benzecri, J.P. (1973) L‟analyse de données, Paris: Dunod, vol.1. Benzecri, J.P. (1980) L‟analyse de données, Paris: Dunod, vol.2.
Manly, B.J.F. (1994) Multivariate Statistical Methods. A Primer. London: Chapman & Hall, 2nd ed.
Button, K. and Stough, R. (2000) Air Transport Networks. Theory and Policy Implications, Cheltenham: Edwad Elgar.
Chlomoudis, C.I. and Pallis, A.A. (2002) European Union Port policy. The Movement Towards a Long-Term Strategy. Cheltenham: Edwad Elgar.
Conférence des régions aéroportuaires (1996) Analyse d‟enquête auprès des régions, Groupe de travail „Accessibilité aux aéroports par les transports terrestres‟, Paris: Institut d‟aménagement et d‟urbanisme de la région Île-de-France.
Dienel, H.L. (ed.) (2004) Unconnected Transport Networks: European Intermodal Traffic Junctions 1800-2000, COST 340, Frankfurt/Main: Campus.
Ducruet, C. (2003) „Comparing European and East Asian port cities: are global databases relevant sources for research?‟, Gyeongsang Nonjib, 17: 139–159.
Ducruet, C. (2004) „Port cities, laboratories of globalisation‟, unpublished thesis, University of Le Havre.
Ducruet, C. (forthcoming) „A metageography of port-city relationships‟, in J.J. Wang, D. Olivier, T. Notteboom and B. Slack (eds.) Inserting Port Cities in Global Supply Chains, Ashgate.
Ducruet, C. and Jeong, O. (2005) European Port-City Interface and its Asian Application, Anyang: Korea Research Institute for Human Settlements.
EMAP Business (2005) Containerisation International Yearbook.
EPSO (1998) The Ports of Europe. European Sea Ports Organization Handbook 1998/99, Norfolk: Compass Publications Ltd.
European Parliament (1993) European Sea Port Policy. Luxembourg: Directorate General for Research Working Papers., Transport Series, E-1, External Study.
European Society of Transport Institutes (1988) The Maritime-land Interface in Commercial Ports. International Seminar, Barcelona September 29-30 1988. Barcelona: Generalitat de Catalunya, Departament de Politica Territorial i Obres Publiques, Institut Català per al Desenvolupament del Transport.
Hayuth, Y. (1985) „Seaports: The Challenge of Technological and Functional Changes‟, in E.M. Borgese and N. Ginsburg (eds.) Ocean Yearbook 5 The University of Chicago Press. pp. 79–101.
Lloyd‟s List (2004) Ports of the World, London: Informa UK Ltd.
I.R.S.I.T. (2004) Les villes portuaires en Europe, analyse comparative, Montpellier: CNRS. Jackson, J.E. (1991) A User‟s Guide to principal Components, New York: Wiley.
Joly, O. and Martell, H. (2003) „Infrastructure benchmarks for European container ports‟, in Proceedings of the 4th Inha – Le Havre International Conference, Regional Cooperation
and Economic Integration, October 8-9, Inha University, Incheon, Republic of Korea, pp.
147-154.
Matthiessen, C.W. (2004) „International air traffic in the Baltic Sea Area: Hub-gateway status and prospects. Copenhagen in focus‟, Journal of Transport Geography, 12, 197–206. Morvan, M. (1999) Villes portuaires: les moyens d‟un développement solidaire dans une
Europe ouverte. Report of the Conference of Peripheral Port Cities.
Perrod, P. (1999) „Un enjeu majeur pour l‟avenir: La desserte des terminaux internationaux (Ports et Aéroports)‟, Revue Transports, 398.
Roth, P. (2003) „Quelle desserte aérienne intercontinentale et régulière pour les aéroports
non-Hubs européens?‟, Revue Transports, 417.
Tongzon, J.L. (1995) „Systematizing international benchmarking for ports‟, Maritime Policy
and Management, 22:2, 171–177.
Tsinker, G.P. (1997) Handbook of Port and Harbor Engineering, New York and London: Chapman & Hall.
Wang, J.J. and Olivier, D. (2003) „La gouvernance des ports et la relation ville-port en Chine‟,
de Wit, J. (2005) „Development strategy of Schipol Airport and lessons for Incheon as a logistics hub‟, Journal of International Logistics and Trade, 2:2.
Table 1. Presentation of the variables
Code Description
AGENTSSF* Total employment in freight forwarding activities, including several transport modes such as air, sea, road, etc.
AIRINTEG** Logistic and Forwarding Agents located in Airport Areas AIRPADMI* Total employment in Airport Administration and operation AIRPSERV* Total employment in air services
AIRTRAFF* Total Airport Cargo Throughput in 2003 (metric tons) AIRTRAFM* Total Airport Operations in 2003 (movements)
CRUISE *** Number of cruise companies having regular services to the port FERRYSER * Ferry Services linked to employments
LOGISTIC * Total employment in logistic activities (distribution, packaging, road transport, etc.)
POPAGGLO**** Number of inhabitants of the metropolitan area, including administrative and suburban population
SEACONNEX ***** Total number of ports connected through seaborne links relative to regular container shipping lines in 1992
SHIPSERVICES * Total port-related employment, or “port service industry” including port authority, dockers, stevedores, towage & tug services in ports WARESTOR * Total employment in warehousing and storage activities
Data Sources:
* KOMPASS
** Journal for International Transport (2005) International Register of Logistics and
Forwarding Agents. http://195.65.73.10/itz/irflaNeu/e/irfla_suche.asp
*** Cruise Lines (MSC, MED, COSTA) **** www.world-gazetteer.com
Table 2. Presentation of the 58 selected European port cities
Port Identification Airport Identification UNCTAD PORT CODE
AALBORG Aalborg AAL AARHUS Tirstrup AAR ABERDEEN Aberdeen ABZ ALICANTE Alicante ALC AMSTERDAM Schipol AMS ANCONA Falconara AOI ANGRA DO HEROISMO Terceira Lajes ADJ ANTWERPEN Deurne ANR BARCELONA Prat BCN
BARI Palese BRI
BELFAST Belfast BFS BILBAO Sondica BIO BORDEAUX Merignac BOD BREMEN PORTS Bremen BRE BRISTOL Spekee BRS CATANIA Fontanarossa CTA CONSTANTZA Kogalnoceanu CND COPENHAGEN Kastrup CPH
CORK Cork ORK
DUBLIN Dublin DUB
FORTH PORTS Edinburgh EDI
FARO Faro FAO
GENOA Cristoforo Colombo GOA CLYDEPORT Glasgow CYP GOTENBURGH Landvetter GOT HAMBURG Hamburg HAM HELSINKI Vantaa HEL SAINT HELIER S. Jersey STH
KIEL Holtenau KEL
LE HAVRE Le Havre-Octeville LEH LEIXOES - PORTO Oporto LEO
LISBON Lisbon LIS
LIVERPOOL Liverpool LPL LONDON Heathrow + Gatwik + Stansted + City LON
MALMO Sturup MMA
MARSEILLES Marseille-Provence MRS NANTES - ST-NAZAIRE Nantes SNR NAPLES Capodichino NAP
NICE Nice NCE
OSLO Gardermoen OSL OSTENDE Ostend OTD PALERMO Punta Raisi PMO PALMA DE MALLORCA San Juan PMI LAS PALMAS Palma LPA PIRAEUS Athens PES PLYMOUTH Plymouth PLH
ROSTOCK Lagge RTK
ROTTERDAM-EUROPORT Schipol RTM SANTANDER Parayas SDR SOUTHAMPTON Southampton SOU ST PETERSBURG Pulkovo STP STOCKHOLM Arlanda STO
TEES Tesaide TES
THESSALONIKI Thessaloniki SKG VALENCIA Manises VAL VENICE Marco Polo VCE
VIGO Vigo VGO
Table 3. Presentation of the database P O R TC O D E A IR IN TEG A IR TR A F F A IR TR A F M A IR P A D M I A IR P S ER V A G EN TSS F C R U IS E F ER R Y S E R S EA C O N N EX S H IP S ER V IC ES W A R ESTO R LO G IS TI C P O P A G G LO AAL 0 1,229 21,822 0 0 192 0 0 6 86 201 346 122 AAR 0 1,961 21,947 0 0 371 1 0 31 286 70 26 226 ABZ 0 3,997 97,603 0 0 180 0 5 3 2,055 286 25 183 ALC 0 5,849 66,577 750 0 8 1 0 9 0 111 135 428 AMS 8 1,353,760 408,300 2,134 817 4,185 2 118 32 1,320 2,364 2844 1,188 AOI 0 5,469 19,320 0 60 198 1 40 14 278 107 24 100 ADJ 0 0 0 0 0 110 0 0 2 0 0 0 12 ANR 0 4,903 63,994 0 210 3,150 0 93 145 3,311 3,484 1106 933 BCN 11 76,173 282,015 750 35 1,838 2 0 72 1,046 3,085 1307 4,973 BRI 0 3,740 22,995 0 120 217 2 0 9 522 52 53 303 BFS 0 42,116 113,265 750 175 496 0 75 11 310 128 0 585 BIO 0 3,826 44,006 0 0 130 0 6 32 474 224 1801 1,120 BOD 3 15,592 65,708 200 0 885 0 13 18 178 618 559 971 BRE 2 2,237 42,789 287 30 1,813 0 83 76 2,625 1,479 1306 1,001 BRS 0 5,279 74,540 0 0 1,109 0 0 6 342 23 114 616 CTA 0 12,354 54,436 0 0 91 2 0 7 16 164 196 852 CND 0 281 1,423 0 0 680 0 8 18 4,707 1,826 0 303 CPH 1 11 90,626 0 17,000 1,255 2 5,512 16 22,523 1,614 724 2,366 ORK 0 7,114 54,277 270 0 711 0 77 5 249 283 1096 188 DUB 0 133,871 177,783 4,040 2,500 3,759 2 3,432 10 3,770 2,757 2247 1,024 EDI 0 53,281 106,205 0 0 17 1 4 30 113 15 410 696 FAO 0 1,834 37,278 0 0 0 0 0 2 0 0 0 41 GOA 0 2,813 29,041 0 461 454 2 617 51 2,534 433 167 692 CYP 0 5,791 104,301 0 20 353 0 3 10 344 842 695 1,379 GOT 0 58,976 60,148 0 0 1,006 2 4,150 30 4,723 678 1179 786 HAM 7 35,968 149,363 11 27 11,045 0 585 101 7,078 3,371 1698 3,278 HEL 3 88,140 218,967 126 17,758 3,746 2 829 31 993 1,118 5460 1,215 STH 0 5,680 74,555 0 0 1 1 0 2 5 1 0 28 KEL 0 0 27,200 42 315 111 0 24 10 131 41 1 235 LEH 0 133 41,621 0 0 2,049 2 42 86 2,895 556 60 254 LEO 0 28,140 43,144 0 0 976 0 0 26 310 212 0 1,218 LIS 3 95,767 117,658 777 7,310 1,552 0 306 60 1,950 324 45 2,613 LPL 0 24,253 84,402 0 37 495 0 826 36 43 135 20 3,562 LON 9 1,736,563 936,551 383 440 3,082 2 108 54 818 1,260 3798 11,327 MMA 0 28,504 42,040 0 0 627 0 351 5 270 199 178 2,366 MRS 3 53,547 111,613 350 253 3,702 2 1,215 91 1,183 761 75 1,573 SNR 2 10,589 63,815 333 151 2,404 1 0 15 355 479 288 765 NAP 0 6,200 65,016 0 792 573 2 1,070 34 1,962 64 20 3,770 NCE 3 15,315 181,303 825 225 238 0 11 0 30 59 6 908 OSL 0 72,688 185,645 1,241 9,598 1,922 3 1,686 19 814 1,045 27147 808 OTD 0 78,066 37,354 0 0 14 0 0 4 118 16 0 69 PMO 0 5,372 42,866 0 135 21 2 0 11 55 4 0 987 PMI 0 22,358 168,977 0 0 0 4 135 7 3 111 111 475 LPA 0 43,307 99,698 411 0 136 0 0 2 360 111 111 621 PES 2 109,741 170,130 698 581 1,840 4 553 64 3,887 915 2135 3,231 PLH 0 68 28,900 88 0 8 1 175 6 100 0 0 247 RTK 0 3,424 4,617 0 0 18 0 0 24 411 107 0 196 RTM 0 230 66,943 33 29 3,163 0 126 172 1,579 3,905 56 3,328 SDR 0 40 11,326 86 0 374 2 0 15 381 100 179 185 SOU 0 322 48,960 0 0 147 4 178 31 675 3 180 764 STP 0 26,045 53,869 0 33 3,898 0 2 30 2,734 1,456 295 4,784 STO 2 131,355 285,781 50 5,800 1,770 0 179 5 394 12,835 3334 1,692 TES 0 943 51,525 0 0 163 1 7 27 67 113 5 675 SKG 0 1,211,639 21,094 0 0 269 3 0 15 681 26 192 829 VAL 0 11,776 65,548 0 0 600 2 6 68 351 245 181 1,740 VCE 2 11,222 76,886 1 585 254 0 2 33 3,376 194 55 259 VGO 0 1,137 13,455 0 0 125 2 0 23 68 151 181 419 WAT 0 0 0 22 0 77 0 20 11 30 71 82 47
Table 4. Bravais-Pearson correlation matrix in lower triangular form AI R INT E G AI R T R A FF AI R T R A FM AI R PADMI AI R PS E R V AGE NT SS F C R UI SE FERR YSER SEACON NE X SHI PS E R VI C E S W AR E STOR L OGI STI C POPAGGL O AIRINTEG 1 AIRTRAFF 0.53 1 AIRTRAFM 0.73 0.74 1 AIRPADMI 0.27 0.26 0.33 1 AIRPSERV 0.11 -0.01 0.18 0.13 1 AGENTSSF 0.56 0.22 0.36 0.29 0.19 1 CRUISE 0.11 0.26 0.22 0.19 0.18 0.01 1 FERRYSER -0.03 -0.04 0.06 0.32 0.55 0.19 0.28 1 SEACONNEX 0.30 0.04 0.13 -0.04 -0.04 0.55 0.04 0.00 1 SHIPSERVICES 0.11 -0.04 0.02 0.04 0.54 0.31 0.12 0.75 0.18 1 WARESTOR 0.30 0.10 0.32 0.16 0.23 0.42 -0.11 0.11 0.28 0.17 1 LOGISTIC 0.10 0.13 0.28 0.30 0.45 0.20 0.27 0.22 0.00 0.01 0.16 1 POPAGGLO 0.61 0.52 0.75 0.07 0.08 0.42 0.12 0.10 0.37 0.16 0.30 0.15 1
Table 5: Factorial Analysis Results Eigenvalues of the correlation matrix
Factors F1 F2 F3 F4 Eigen Values 3.98 2.31 1.63 1.12 % variance 30.61 17.77 12.56 8.63 % Cumulative 30.61 48.38 60.93 69.57 Eigen Vectors Variables/Factors F1 F2 F3 F4 AIRINTEG 0.39 -0.23 0.04 -0.03 AIRTRAFF 0.31 -0.27 -0.31 -0.20 AIRTRAFM 0.42 -0.22 -0.21 -0.04 AIRPADMI 0.22 0.09 -0.29 0.36 AIRPSERV 0.20 0.46 -0.06 0.08 AGENTSSF 0.35 0.00 0.35 0.18 CRUISE 0.15 0.14 -0.40 -0.30 FERRYSER 0.18 0.53 -0.03 -0.20 SEACONNEX 0.20 -0.08 0.50 -0.05 SHIPSERVICES 0.19 0.46 0.24 -0.36 WARESTOR 0.24 0.03 0.30 0.45 LOGISTIC 0.19 0.20 -0.30 0.48 POPAGGLO 0.37 -0.21 0.07 -0.30
Variable Contributions to Factors %
Variables/Factors F1 F2 F3 F4 AIRINTEG 15.10 5.46 0.19 0.11 AIRTRAFF 9.71 7.33 9.44 3.93 AIRTRAFM 17.27 5.00 4.39 0.19 AIRPADMI 4.91 0.82 8.37 13.30 AIRPSERV 4.08 20.77 0.40 0.71 AGENTSSF 12.25 0.00 12.19 3.36 CRUISE 2.30 1.93 15.66 8.86 FERRYSER 3.28 28.38 0.10 4.08 SEACONNEX 4.15 0.66 24.91 0.27 SHIPSERVICES 3.52 21.41 5.82 13.04 WARESTOR 5.84 0.07 8.96 19.88 LOGISTIC 3.76 3.81 9.09 23.41 POPAGGLO 13.82 4.35 0.46 8.85
Table 6: F1 First Factor-Description with the help of 3 active variables
Variable Coordinates Contribution (%)
Non Significative Central Zone This zone contains 10 remaining variables
POPAGGLO 0.37 13.82
AIRINTEG 0.39 15.10
AIRTRAFM 0.42 17.27
Table 7: F2 Second Factor- Description with the help of 6 active variables
Variable Coordinate Contribution (%)
AIRTRAFF -0.27 7.33
AIRINTEG -0.23 5.46
AIRTRAFM -0.22 5.00
Non Significative Central Zone This zone contains 7 remaining variables
AIRPSERV 0.46 20.77
SHIPSERVICES 0.46 21.41
FERRYSER 0.53 28.38
Table 8: F3 Third Factor-Description with the help of 6 active variables
Variable Coordinate Contribution (%)
CRUISE -0.40 15.66
AIRTRAFF -0.31 9.44
POPAGGLO -0.30 9.09
Non Significative Central Zone This zone contains 7 remaining variables
WARESTOR 0.30 8.96
AGENTSSF 0.35 12.19
SEACONNEX 0.50 24.91
Table 9: F4 Fourth Factor-Description with the help of 5 active variables
Variable Coordinates Contribution (%)
SHIPSERVICES -0.36 15.66
CRUISE -0.30 8.86
POPAGGLO -0.30 8.85
Non Significative Central Zone This zone contains 8 remaining variables
WARESTOR 0.45 19.88
Figure 1. Demographic size of the metropolitan areas
Source: World Gazetteer, 2005
Figure 2. Relative importance of sea and air transport employment
Figure 3. Bravais – Pearson linear correlation graph
Figure 5. Ferryports and air services (17.77% of total variance)