HAL Id: hal-02902629
https://hal.archives-ouvertes.fr/hal-02902629
Submitted on 20 Jul 2020
HAL is a multi-disciplinary open access
archive for the deposit and dissemination of
sci-entific research documents, whether they are
pub-lished or not. The documents may come from
teaching and research institutions in France or
abroad, or from public or private research centers.
L’archive ouverte pluridisciplinaire HAL, est
destinée au dépôt et à la diffusion de documents
scientifiques de niveau recherche, publiés ou non,
émanant des établissements d’enseignement et de
recherche français ou étrangers, des laboratoires
publics ou privés.
Characterization of the vertical structure of Saharan
dust export to the Mediterranean basin
E. Hamonou, P. Chazette, D. Balis, F. Dulac, X. Schneider, E. Galani, Gérard
Ancellet, A. Papayannis
To cite this version:
E. Hamonou, P. Chazette, D. Balis, F. Dulac, X. Schneider, et al.. Characterization of the vertical
structure of Saharan dust export to the Mediterranean basin. Journal of Geophysical Research:
At-mospheres, American Geophysical Union, 1999, 104 (D18), pp.22257-22270. �10.1029/1999JD900257�.
�hal-02902629�
JOURNAL OF GEOPHYSICAL RESEARCH, VOL. 104, NO. D18, PAGES 22,257-22,270, SEPTEMBER 27, 1999
Characterization
of the vertical structure
of Saharan
dust export
to the Mediterranean
basin
E. Hamonou.
• P. Chazette.
• D. Balis.
2 F. Dulac,
• X. Schneider,
• E. Galani.
2
G. Ancellet.
-• and
A. PapaYannis
4
Abstract. We present the results of our investigations into the vertical structure of several North
African dust
plumes
exported
to the Mediterranean
in 1997. Two backscatter
lidar systems
were
operated in the western and eastern parts of the Mediterranean basin during dust events identified
using
Meteosat
visible
images.
Dust transport
soundings
have
shown
that dust
particles
are trapped
and transported
inside
well-defined
layers
in the free troposphere.
In general,
the dust
transport
appeared to be multilayered. with several distinct layers at different altitudes between 1.5 and 5 km. The analysis of Meteosat IR images. the Total Ozone Mapping Spectrometer aerosol index. and back-trajectories clearly shows that these layers have different origins in Africa. Finally. in addition to the free troposphere transport. the presence of dust particles inside the planetary. boundary. layer has been assessed and quantified for two particular events with aerosol optical thickness of 0.3-0.4. using simultaneous lidar and Sun photometer measurements. In one case only, significant dust load (dust optical thickmess of-0.1) occurred in the boundary layer.
1. Introduction
The scientific commmfity has made great efforts to document
and understand the interactions of mineral aerosols (dust) with
the enviromnent. We cun'ently know that these are numerous
and concern key phenomena such as Em•'s radiative budget
[Legrand et al., 1992; Tegen and Fung, 1995]. Studies have
covered a large domain fi'om the particles' chemical and optical
properties to the dynamical processes responsible lbr their uptake and transport. }towever. there is still a lack of
observations. which makes the quantification of these impacts tincertain.
Regarding the radiative impact of dust particles. an important
lacking observation is tim vertical structure of dust clouds.
Indeed. to a small extent in the short wave domain and to a
greater extent in the long wave domabe. radiative tbrcing calculations need to consider the vertical repartition of the particles [Acl•-e•an and Chung. 1992: ('hazette et al.. 1998]. •Ilm latter is transport dependent. Indeed, durhig the trans-port the
vertical stmctm'e may be modified by mechanisms such as
convective erosion of the dust layer and gravitational settling of particles. Prospero and Carlson [1972] have documolted such changes in the vertical structure for the Afi'ican dust transpm•
over the Atlantic. 1he latter is known to occur inside a well-
det•ned stmctm'e called the Saharan air layer. this structure is
created by the wind shear that occurs when the emerging wam• dust-loaded Saharan air mass pushed by trade winds is undercut
by the cool northerly coastal winds.
Copyright 1999 by the American Geophysical 1 lnion.
Paper number 1999JD900257.
0148-0227/99/1999/JD900257509.00
The Mediten'anean transport it is very different I¾om the Atlantic one. Indeed. the average atmospheric circulation over
the Mediterranean
does
not explain
tl•e nm•ward transport
of
dust
particles
because
winds
mostly
come
from the west [La
Fonta#•e et al.. 1990]. DiffErent authors have reported on the processes that govern such a transpm•. The compilation of their work has led to three main scenarios [^.1oulin et al.. 1998]. •11•ey
all have drawn the conclusion that Mediten'anean dust outbreaks
were related to the cyclone activity inside and arom•d the basin
[Bergametti et al.. 1989: Alperr and Ziv, 1989]. Indeed, their'
associated t¾ontal zones have been shown to be able to mobilize
and transport great amounts of dust over large distances [Prodi
and Fea. 1979: Reiff et al.. 1986:Bergametti et al.. 1989:Dulac et al., 1992a: Franze'n et al., 1994]. Thus the transport of dust to
the Mediten'anean basin will be driven by more complex wind
fields tlmn is the tropical Atlantic transport. and its vertical structure may reflect that complexity. Actual knowledge is based
on tlu'ee-dimensional (3-I)) air mass trajectories of dust transport over the Mediten'anean. These have indicated synoptic upward
movement of the dry and turbid African air masses over the
basin [e.g. Bergametti et al., 1989:Dulac et al.. 1992a]. which
suggests that dust particles are prhnarily transported over the boundary layer. Moreover. Dulac et al. [ 1996] have esthnated an average altitude of tim dust layer of 2300 m fi'om dust winds
derived from Meteosat during a summer dust transport event in
the western Mediten'anean region. However. unlike the vertical structure of the tropical Atlantic transport of dust, to our knowledge. no con'e•onding direct documentation is available
for the Mediterranean.
We present the results of the vertical sounding of several
Saharan dust outbreaks to the Mediterranean basin using two
backscatter lidar systems operated at two different sites and
complemented by coincident local and regional scale remote
22,258 HAMONOU ET AL.: VERTICAL STRIICTIIRE OF LONG-RANGE DUST TRANSPORT
sensing observations from a Sun photometer. Meteosat, and. when available, the Total Ozone Mapping Spectrometer (TOMS) UV-absorbing aerosol index [Hetvtan et al.. 1997].
The presentation of the work is organized as follows. In section 2. inforotation is given on the technical characteristics of the instruments that have been used. The procedures used for retrieving the particles' optical properties are outlined, and finally. we discuss and quantify the associated uncertainties. Section 3 is devoted to the data analysis. It is composed of three subsections, devoted to the analysis mid interpretation of the results obtained with each of our remote sensing devices. Section 4 is a discussion of the synergy between the lidar and the Sun photometer that can be used to s•arate the dust particles' contribution to the total optical thickness t¾om that of the measurement site background particles. Finally, in section 5 we present our conclusions.
2. Observation means
In the framework of the European Mediterranean Dust Experhnent (MEDIJSE) we have been making from April 1996
to the end of June 1997 a daily local and regional scale survey of
AllScan dust exports to the Mediterranean basin.MEDUSE has been set up between several European laboratories in order to
develop and implement a prototype system for forecasting and
monitoring Saharan dust outbreaks over the Mediterranean
[SO'derman and Dulac. 1998] and to build a database of regional and local scale observations. including both optical and chemical
measurements.
Four different m•d complementary remote sensing devices
have been used in order to get a comprehensive characterization of North African dust exports to the Medite•xanean basin: visible and infrared Meteosat imagers, TOMS ultraviolet radiometer, ground-based backscattering lidars. and Sun photometer. On one hand, spaceborne radiometers have give•a access to synoptic information such as the spatial distribution of the dust cloud and
its displacement. For this we have usedMeteosat visible images-
derived dust optical thickness distribution over seawater [h 1oulin et al.. 1997b. c] and bothMeteosat intYared images [Legrand et
al., 1994] and the TOMS aerosol index [Hemtan et al.. 1997]
over land. On the other hand, backscatter lidar systems have given access to the vertical structure of the dust transport so that finally. it was characterized hi all three dimensions.
We have been in charge of optical measurements performed in Thessaloniki (22.967'E. 40.52'N) and Observatoh'e de Haute Provence (OHP, 5øE. 44'N) with the Laboratory of Atmospheric Physics (LAP. Greece) and the Service d'A6ronomie (SA. France). respectively. Both sites were equipped withbackscatter lidat' systems, but in Thessaloniki a Sun photometer was also operated. Thus this site offered the possibility of using both instruments in synergy to get a more precise characterization of the dust cloud optical properties. Indeed,Thessaloniki is a rather polluted coastal city (the second biggest industrial and urban city in Greece). Tlms its aerosol background (i.e.. when no dust transport occurs) is character•ed by a large optical tlfickness and composed of small particles from the gas-to-pmlicle cotaversion (carbonates and sulphates aerosols) [Leon et al.. 1998]. Lidar
measurements were perlbnned under so-called "dust alerts."
issued by the Mediterranean Research Centre, Erice (Italy), when accordhag to the MEDUSE dust transport model [Nickovic and Dobticic. 1996] and Meteosat daily observation [Dulac et
al.. 1997]. dust-loaded air masses were likely to be advected
above the measurement sites.
2.1. Local Scale Observations
2.1.1. Lidar measurements. •lhc main drawback of ground- based and spaceborne passive instruments is that they can only provide vertically integrated infornmtion. Active instruments such as the lidat' etaable a thne-resolved investigation of the atmosphere t¾om which the position of thebackscattering layers
can be retrieved.
For both lidar stations, measurements started in April 1996
and ended in summer 1997. The number of days of observation
during dust alerts for Thessaloniki was 24 in 1996 and 12 in
1997. For OIIP it was 3 in 1996 and 6 in 1997. This rather low
nmnber of measurements is prilnarily due to a decreased dust transpm• activity inside the Mediterranean basin in 1996 and 1997, in relation to the North Atlantic Oscillation [Moulin et al., 1997a]. Moreover. dust transports to the Mediterranean being associated with meteorological fronts. dust layers are often found over water clouds, which makes lidar soundings inefficient in characterizing the dust particle properties. Thus, in low-cloud conditions, no lidar soundings were peflbmaed.
The backscatter lidar systems used in MEDUSE are based on a Neodymium: Yttrium/aluminium/gamet (Nd:Yag) laser source emitting at 532 ran. The emission is coaxial with the receiver system in order to have a complete overlap between the laser source and the telescope field of view at a range of several
hundred meters: the first 600 m are not sounded for
Thessaloniki. and the first 1.5 'km are not sounded tbrOHP. The
arialogic acquisition mode was used with an associated vertical resolution of 15 m. The signal was then filtered out to enhance
the signal-to-noise ratio using a binomial filter [Darchand and Marnet. 1983] which degraded the vertical resolution to-•70 m. Aerosol extinction profiles were retrieved usingKlett's [ 1981 ] algorithm. This procedure requires the knowledge of the aerosol backscattering phase lhnction as well as an upper boundary condition on the extinction coefficient. Chazette et al. [1995]
have discussed the uncertainties associated with the retrieval of
the extinction coefficient. They identified three mah• causes: (1) the determination of the boundary condition. (2) the a priori fixing of the aerosol backscattering phase thnction. and (3) the detection noise. We have set the boundary condition in the free troposphere where the aerosol•s contribution is thought to be negligible and used the 1ow-la'oposphere background aerosol extinction used in the computer code Lowtran 6 as a reference value [Knei.zvs et al.. 1983]. The aerosol backscattering phase
function it was calculated using Mie's them•y for the dust aerosol
model used in Meteosat analyses [A 1oulin et al.. 1997b]. Its value
is 0.035
sr
'•. Finally.
in our
case
the detection
is performed
with
a signal-to-noise ratio >20. so the detection noise can be neglected. The resultant uncertainty is 20% tbr the extinction coefficient. The optical thickness was calculated using the extinction coefficient profiles with an associated relativestandard deviation of 15%.
2.1.2. Sun photometer measurements. Thessaloniki site also operated a Sun photometer to measure the vertically integrated aerosol optical thickness. The automated Sun photometer developed by CIMEl•© Electroniquc has been used to measure the atmospheric attenuation of the solar light [ttolben et al., 1999]. Measurements were pertbm•ed at three different
HAMONOIJ ET AL.' VERTICAL STRUCtI1JRE OF LONG-RANGE DUST IILANSPORT 22,259 wavelengths ranging t¾om visible to near infi'ared (440. 670. and
870 nm). Provided that them is proper calibration and that well- known corrections for the contribution of absmption and scattering by air molecules are inade to the total attenuation. the Sun photometer allows direct measurement of the total atinospheric aerosol optical thickness at the considered wavelengths •. {AOT•). In such retrieval the major source of uncertainty is calibration error. which is directly propm•ional to the associated uncertainty of theAO%.. Indeed. the relative error e• on the AOT•. derived from the Beer-Lainbert law [Lenoble. 1993] is simply given by:
1
• - (1)
m Io•
where AIo•/1o• is the relative uncertainty of the calibration
coefficient and m is the air mass.
In order to minimize e• we have used two different calibration
procedures. In a first step the well-known Langley-Bouguer [Lenoble. 1993] method was used to select the best days for calibrating. •lltese days obeyed four criteria: (l) The optical thickness is fairly constant: all points •vith anAOT• differing
froin the daily mean by more than one standard deviation were
discarded. (2)]he number of remaining measurements after cloud decontamination during the day is high enough (>80). (3) 'Ihe dynamic on the air mass range is large enough (froin <2 to >5). (4) The optical thickness is weak (<0.3). The three first criteria ensure that the extrapolation of the measurements to air mass 0. requested for calibration. will be as correct as possible. The tbm•h criterion ensures a minimum sensitivity of the calibration coefficients to vm'iations of the optical thickness. Eight days were selected. The calibration coefficients were then retrieved using the procedure proposed byHe•nan et al. [ 1981].
which minimizes the associated uncertainties by giving stronger
statistical weights to measurements perfommd at small air masses. This is an improvement of the Langley-Bouguer method. which weights all measurements equally. Finally. all
these coefficients were nommlized to the stone day with a
seasonal model of the solar in'adiation so that we could take the
mean value as the Iinal calibration coefficient. The resulting relative uncertainty of the calibration (Aloe/Ion). which is simply calculated by dividing the standaid deviation of the calibration coefficients by their mean value. is •-3.9% at 443 mn and <2.5% at both 670 and 870 ran. In Figure 1 we have plotted the associated relative en'or of the retrieval of the optical thickness
at 443 and 670 mn as a lhnction of the air •nass Ibr both the
s•nallest and the biggest opticalthicknes•s found between May 8 and June 2, 1997. which are •o days of dust •anspo•. 2hese r•msent extreme e•Yor fitncfions be•een which the error fluctuates durNg these days. •l]•us we can see that at the uppemost the relative error of the optical thickess is 11% for small air masses. ttowever. for •nost measurements performed on •e May 8 and June 2. 1997. air inasses would be >2 so that. as can be seen in Figure 1. the relative error would not exceed
6% at 443 mn o1' 4•, at 670 nm.
Concerning all our Sun photometer measum•nents. we have rejected here all measurements for air masses <2 or leadhg to
A OT <0.1. •us the maxinmm relative error of the AOT443 is m
uppermost -20%. but in most cases it will be <10%.
From the optical thich•ess atZ• = 443 mn and Z2 = 670 mn one can derive the Angs•Om exponent • which describes the spectral d•endence of the AOT• in the visible domain [Angstrom. 1964]:
Unce•a•ty of the optical thioBless will evidently result in unce•ainty of a. •e absolute en'or Aa of a can be expre•ed on
the first order as
•e AngstrOm exponent value d•ends mostly on the aerosol size dis•'ibution. Small or even negative values m'e found tbr the lalge pmlicles such as sea salts or mineral particles. whereas values between I and 2 are tbund tbrsubmicron size particles such as sulphates or cmbonaccous actorals [Liousse et al.. 1995:
12 fi 10 • 8 >- 4 • 2 o 0 12 s 10 o .,. 0 1 2 3 4 5 6 7 Air mass
Figure 1. Relative error of the Sun photmneter-derivedaerosol optical thickness (AOT)at (a) 443 nm and (b) 670
mn due to calibration uncertainties for two days of dust transport. Maxiinum and miniinmn relative errors were
calculated using the renallest and the biggest optical thickness found between May 8 and June 2, 1997
22,260 HAM()NOU ET AL.: VERTICAl. STRUCTI JRE OF LONG-RANGE DUST TRANSPORT
a)
b)
07•o3
Olc • .:",,;
<-..•
3,2 $o lo 15 20 25 30 35 Lor•;•tude C) 07•o3
õ02 o o.1 o I 30 3.5c)
d)
2 lO 1 t 12 13 14c)
0 0.01 0.0• 0.03 0.04 0.1:}5 0.06Extinction coe•cient (kin-l)
Plate 1. (a and b)Metcosat-dcrived dust optical thickness at 550 nm œor May g and 9. 1997. respectively (pink circles show the mcasm'emcnt site location): (c and d)Sm] photometer-derived optical thickness at 532 mn and AngstrOm exponent for the same dates; (e and f) cxth]ction coefficient profilesat 532 nm derived from lidar measurements lbrthc same dates (A.M. profiles arcpcrEonncd between 0930 and 1100 UTwhcrcas P.M. profiles are pcrtbnncd bc•'een 1700 and 2000 UT).
HAMONOU ET AL.: VERTICAL STRUC'1111• OF LONG-RANGE DUST TRANSPORT 22,261 A,loulin et aL. 1997a]. This parameter will be of great help in
highlighting changes in Thessaloniki's aerosol backgrom•d composition. Such changes will be shown to be, in most cases
due to dust advection. In order to make comparisons with the
lidar- and/or Meteosat-derived aerosol optical thickness. we computed the AOTx for •. = 532 nm from measurement of AOTu. The relative error ofAOT•, g•., can be expressed as a function of the relative errors•u and •x= of AOTu and AOTx= as
follows:
(4)
.The value of •s3• does not exceed 8% for eitherMay 8 or June
2,1997.
2.2. Synoptic Scale Observations (Meteosat)
Meteosat visible hnages are used to monitor dust plumes and to assess the intensity of dust outbreaks in tenns of optical thickness at 550 nm on a synoptic scale..The procedure described by A4oulin et al. [1997b] is based on the use of the radiative transfer code 5S [Tanrd et al., 1990]. It uses a dust type aerosol model, made of the size distribution of the background desert aerosol model of Shenle [1984] and with a refractive index of 1.50- 0.01i [Moulin et al, 1997b]. The uncertainty of the retrieved optical thickness has been assessed over the Atlantic by comparing Sun photometer measurements to Meteosat retrieval [Moulin et al.. 1997c]. It was shown to be
•25%.
.The presence of dust particles over the African continent can also be inti•rred from Meteosat infrared images. Indeed, because of its altitude the airborne dust radiates at a cooler temperature than the surface, inducing a characteristic temperature brightness contrast [Legrand et al., 1994]. Here we use this property to highlight the likely dust source regions with a procedure similar to that described earlier by Legrand et al. [ 1994]. Unfortunately, this method also highlights clouds. However, since their cooling effect is usually much stronger than that of dust particles, we are able to make a crude distinction between both dust particles and clouds by applying a simple tineshold on the pixel contrast
intensities.
with TOMS on Earth Probe. For these charts there are 10 classes
of index ranging from 0.2 to 5.2 with a step of 0.5.
We will also present results ofrawinsonde mea•rements mid
back trajectory calculations. OHP rawinsonde measurements
xvere performed by M•t6o-France at noon at the Meteorological
Center of Nimes. which is at --150 km xvest of OHP.
Thessaloniki rawinsonde measurements were obtained l•m the
routine noon measurements perforated by the IIellenic National Meteorological Service at the airport ofl•essaloniki, which lies
-10 km southeast of the Lidar measuring site.
Up to 5 day back trajectories were calculated during dust transport events using the ]•,I2Z model IRamonet et al.? 1996]. We computed trajectories mTiving at the station in the four following different model layers: (1)0.4 to 1.2 km, (2) 1.2 to 2.6 km, (3) 2.6 to 4.7 km, and (4) 4.7 to 7.3 km. For this calculation
we have used the 0000 m•d 1200 [IT predicted wind fields from the European Centre for Medium-Range Weather Forecasts. The
methodology of trajectory calculation is based on emission of a unit tracer mass into the grid box xvhere the back trajectory is desired and then calculation of the dispersion of the tracer with inversion of time and wind. Finally, we have been using direct meteorological observations reported in the European Meteorological Bulletin (EMB) [Deutschen Wetterdienstes,
1996, 1997].
3. Data Analysis
3.1. Sun Photometer Observations
Figure 2 is a two-dhnensional histogram of the relative occun:ence of a particular optical thickness at õ70 •m• compared to a pm•icular AngstrOm coefficient (two independent parameters). It was constructed using the cloud-decontaminated Sun photometer measurements performed in Thessaloniki from
April 1996 to mid June 1997.
Two main classes con'esponding to different conditions of
aerosol load over Thessaloniki are apparent. The first one. which
is the most frequent, corresponds to rather high values of the AngstrOm expommt (1.2<ot<2). These high values are due to
lliessaloniki's usual aerosol load. which is made of small
2.3. Exogenous Information
In order to somehow back up and complement Meteosat infrared infom•ation we have be•,m using the TOMS UV- absorbing aerosol index [1terman et al., 1997]..The use of UV
radiation lbr the detection of absorbing aerosols above land is convenient in two main respects: First of all the UV contribution
of the surlhce is very small, allowing the aerosol signal to be detected. Secondly, the spectral signature of UV-absorbing
aerosol and clouds is significantly different, so that it can be used to discriminate between them. However, the an•ount of aerosol detected in a cloudy region will be reduced because of
the obscuring of the aerosol layer by clouds. The procedure
associated with the retrieval of the aerosol index makes use of
the spectral contrast of the measured signal between 340 and
380..The aerosol index charts we have been using were obtained
0.31 0.64 0.76 0.99 1.21 1.44 1.66 ... ... ... ::::::::::::::::::::::::: ... ... ... ...
:::::::::::::::::::::::::: ::i '::: i• i• F i i7::, i :'
'•- •,, •,',-'x,,, ,•. -•}•<?ii..'.:i::{{.-'.:.{.:.ii:"•i!.i i i ?: i i i i i i i i :::::::::::::::::::::: 2.11 ::-':::::::•..:.,':::::::
o.o
o.s
Optical thickness at 870 nmFigure 2. Occurrence histogrmn of the pair (AOT8?0 and or) for
22,262 ttAMONOU ET AL.' VERTICAL STRUCTIJRE OF LONG-RANGE DUST TRANSPORT
particles present in polluted air masses (cmbonaceous particles. and anthropogenic sulphates and nitrates) and/or in mmSne air masses (biogenic sulpMtes). The mean total atmospheric optical thiclmess at 532 mn is-0.3 tbr both years. and the mean visible Angstr6m exponent appem's to be -1.6. This pattern indicates a relatively high pollution aerosol load in Thessaloniki. The second class is characterized by a lower Angstr6m exponent (0.3<o•<0.9) and rather large optical thiclmess. Thus it is more characteristic of bigger particles such as mineral aerosols. A value ranging between 0.3 and 0.9 for dustAngstr6m exponent would. however. be rather big compared to previous
observations.
Indeed,
since
dust
particles
are
usually
big (from
a
t•w tenths
of a micron
to 101.tm).
theh'
optical
thiclo•ess
is less
spectrally
dependent.
This leads
to values
of the Angstr6m
exponent
close
to zero.
Dulac et al. [1997]
recently
reported
an
Angstr6m exponent of about a few hundredths for a dust eventobserved
above Finokalia
(Crete) in good agreement
with
measurements during dust transport in Cape Verde Islands
[Chiapello
et al.. 1999] and Sahel
[Holben
eta!., 1991].
It is
most
likely that the specificity
of our site plays
an important
role. Indeed, because it is often highly polluted with a background AOT•32 of 0.3. pollution and dust particles will
contribute
to the total aerosol
optical
thickness.
The resulting
equivalent Angstr6m exponent measured will range somewhere
in between
the typical pollutionlike
particle's
Angstr6m
exponent and the typical dustlike particle's Angstr6m exponent.
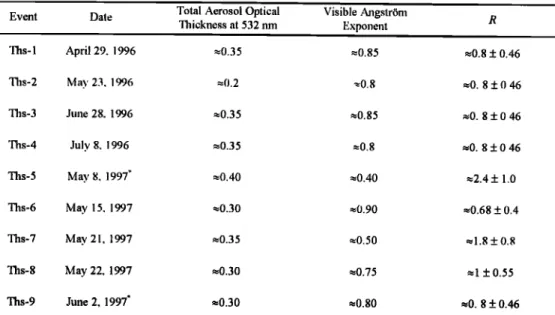
In Table 1 we have summed tip the dates for which the
Angstr6m exponent decreased significantly (o•<0.9). The presence of dust over Thessaloniki was confmned by Meteosat
observations
for all these
dates.
TOMS observations
(1997 only)
indicate that dust is effectively present in the area of Thessaloniki. Thessaloniki events 5 and 8 (Ths-5 and •lhs-8) are associated with an aerosol index rangh•g between 0.7 and 1.2 in the area of Thessaloniki whereas for all the othem (ll•s-6. Ths-7,
and Ths-9) the aerosol index ranges between 0.2 and 0.7.
Plates la and !b show Meteosat-defived optical thiclmess at 550 mn for May 8 trod 9. 1997. respectively. together with the corresponding Sun photometer-de•Sved optical thickness at about
the same wavelength and the visibleAngstr6m exponent (Plates
I c and 1 d). As revealed by Meteosat there is evidence of a dust
plmne along a SSW-NNE axis over the eastern Mediterranean, carrying dust to 'Ihessaloniki on May 8. The presetice of large dust particles above the city is confmned by the Sun photometer
measurements. as the Angstr6m exponent is low ({x• 0.4) and
the AOT532 is large (of the order of 0.4). On May 9. the plume
has moved eastward, and though some residual dust particles
may still remain in Thessaloniki's atmosphere, the aerosol load comes back to average conditions. Indeed. the Angstr6m exponent increases (ct • 1.2). indicating that smaller particles are controlling the aerosol load.
3.2. Lidar Observations
The evolution, from start to end, of the above described event
has also been characterized by lidar soundings. In Plates 1 e and I f we have plotted the lidar-retrieved vertical profiles of the aerosol extinction coefficient at 532 mn for May 8 and 9. For both days the lower maxinlum of extinction coefficient corresponds to the top of the planetary boundary layer (PBL).' Indeed, as can be seen in figure 3a, which represents the vertical profiles of relative humidity and temperature measured on May 8
at noon, there is a clear coincidence of the characteristic
temperature inversion and the lower maxhnum of extinction. Both are situated 4).8 kdn. At this stage. no conclusion can be
drawn on the dust content of the PBL. but a discussion will be made in section 4.2.
On May 8 two othermaxhna of extinction can be detected in the morning (A.M. profiles are performed between 0930 and 1100 [IT). A fn'st one. of weak intensity, is situated between 1 and 2 kan. and a second one clearly appears at 4 kin. This vertical structure evolves during fl•e day. in such a way that three maxhna appem' in the evening (P.M. profiles are performed between 1700 and 2000 UT): a broad one between 0.8 and 2.5 kan. one at 3 kin. and finally. one at 4.7 kin. It is most likely that
Table 1. Dust Outbreaks OverThessaloniki Identified From Sun Photometer Measurements for 1996 and 1997
Event
Date
Total
Aerosol
Optical Visible
fia•gslr6m
R
Thickness at 532 nm Exponent Ths-1 April 29. 1996 •0.35 •0.85 •0.8 + 0.46 Ths-2 Max' 23, 1996 •0.2 •0.8 •0.8 + 0.46 Ths-3 June 28. 1996 •0.35 •0.85 •0.8 + 0.46 Ths-4 July 8, 1996 •0.35 •0.8 •0.8 + 0.46 Ths-5 May 8, 1997' ,•0.40 •0.40 •2.4 + 1.0 Ths-6 May 15, 1997 •0.30 •0.90 •0.68 + 0.4 Ths-7 May 21, 1997 •0.35 •0.50 •1.8 + 0.8 Ths-8 May 22, 1997 •0.30 •0.75 •1 _+ 0.55 Ths-9 June 2, 1997' •0.30 •0.80 •0.8 + 0.46 R is the ratio between the dust optical thickmess and the background aerosol optical thickness (see section 4.1).'These
events
have
been
sotreded
by
the
lidar
system
(events
•hs-5
and
Ths-9
in Tables
2-6).
}LAM()NOII ET AL ß VERTICAL STRUCTIJRE OF LONG-RANGE DUST lllANSPORT 22,263 a) b) 55 5 45 4 35 3 2.5 2 1.5 Extmcbon coefficient -
""•.,.x Thermodynamic
Potential
temperature • ....
temperature
'-'f'--'
"•'
... Relat,ve
h
um,.d!t.y.
...
',% ,
,'
,
/
0 0 005 0 Of 0 015 0 02 0.026 0 03 0 035
Exhnction coefficient (kin '1)
Temperature (Celsius) Relative humidity (%) 5 4.6 4 35 3 •25 2 15 1 05 I I 10 15 20
•
•
Wind
intensity
...-
,,.,.,
Wind
direction
i i i i 26 30 35 40 Wind intensity (ms '1)1•1-1 1•0 1•0 1•[' 1•0 2•'0 2•0 2•0 2:•0
W'ind direction (•Figure 3. Profiles derived t¾om the rawinsonde measurements of May g, 1997, performed at noon in Thessaloniki: (a) relative humidity, thermodynamic temperature. and potential temperature and (b)wind intensity and wind
direction.
the broad maxhnum observed in the evening is due to a
rehfforcement of the layer situated between 1 and 2 kan in the morning. The layer situated at 3 km might be explained by the subsidence of the layer situated at 4 kan in the morning due to atmospheric coolh•g while the one situated at •4.7 kan would be
newly advected.
Such aerosol layers are not observed in the absence of dust transport i¾om Africa. Extinction coefficient profiles obtained under background conditions (i.e.. no dust advection) over Thessaloniki only show one maximum that corresponds to the top of the planetary boundary layer, which usually contains locally produced aerosols. One such typical profile was obtained on May 9 (Plate l t) when dust was no longer present above Thessaloniki. as seen from Meteosat (Plate lb). On May 9 the
PBL height is-1 kin.
Further insights into the prope]•ies of the observed layers are obtah•ed by looking at the rawinsonde measurements. Figure 3a clearly shows that the presumed dust layers are associated with
relative humidity minima (<30%). On the other hand. the calculated potential temperature profile gives evidence that in the observed layers the potential temperature gradient is weak and positive, indicating that the atmosphere is stratified. The low relative humidity and associated weak potential temperature gradients are characteristics that are reminiscent of the so-called Saharan air layer observed during tropical ^tlantic transport by Prospero and Carlson [1972]. Finally, Figure 3b. which gives the vertical profiles of wind direction and intensity. shows that winds have a large soudmrly component. This ensemble of facts seems to indicate that the extinction maxima observed up to 5 km above the PBL correspond to the layers in which Afi'ican dust particles are tzapped and transported.
Several other dust events were sounded during MEDUSE at
both stations. and similar results have been obtained. In Figure 4 we have plotted the lidar-derived extraction coefficient profiles
for May 15. 1997 at OHP. Two mah• aerosol layers are present
22,264 HAMON½}IJ ET AL ' VERTICAL STRUCTIIRE OF LONG-RANGE DUST TRANSPORT 5.5 5 4.5 3.5 2.5 15
.x,-...•.:...-:
• .
....
10 -2 10 -1 Extinction coefficient (l<m -1 )Figure
4. Lidar
derived
vertical
profiles
of extinction
frothe
15
th
of May in Obse•,eatoire de Haute Provence, performed during awell-identified dust event.
(between 17(10 and 1900 liT). They are situated at -•2 and 4 ton
high and are roughly I km thick. These structures were also observed on May 14 with about the same characteristics. Such a vertical structure remained unchanged Ibr hundreds of
kilometers, as it was also observed near Paris (48.43øN. 2.15øE)
(P. Flamant. personal conmiunication).
At this stage we have seen two dirt:rent examples of the possible evolution of the vertical structure of the dust transprat. In the flint case (Ths-5) the structure passed from two to tlu'ee layers in several hours. In the second case (OHP-1) the vertical structure remained unchanged lbr several days. We will now present a last. example lbr which the vertical structure evolved
from two layers to one (O!IP-2). Plate 2 shows the temporal
evolution of the lidar-mtfieved extinction coefficient tbr May 17.
1997. (OHP-2) above OIIP. One can clearly see the rapid
transition of the vertical structure of the dust cloud from
layers to one at •4)830 IJT.
Table 2 is a list of direct observations of the vertical structure
of several Afiican dust transports that occun'ed over the Medite•Tanean between January 1 and June 30, 1997. It should
be remembered here that the referred soundings do not take into account the planetary boundary layer. which may also contain dust particles. Another point concerning Thessaloniki measurements is that because of a low signal-to-noise ratio above 5 km high it is not possible to highlight eventual scattering structures above that height. ]tms the reported layers are not exclusive of possible higher layers.
The lidar-retrieved optical thickness is also given in Table 2. It was calculated fi'om the top of the boundary layer (indicated
by the temperature inversion) to the top of the highest dust layer
indicated. It ranges between 0.1 and 0.25.
As is repoded in 'Fable 2. all the sounded events Ibr bothlidar
stations have shown that particles are trapped and transported inside well-delined layers. Rawinsonde measurements have shown that these layera are relatively drier than the neighboring
atmosphere. Most of the soundings have revealed several layers. A striking l:atm'e is the rather constant height (-•2 km and
ton) at which the layera appear. Such a high-altitude transport
may be linked to synoptic uplift that occurs when the wam:
Saharan air mass encountem the cooler MeditelTanemi air mass.
Dulac et al. [1992a] have documented a case of such a synoptic
uplift of the Saharan air mass in the western Mediterranem:. They rcpmted that it was uplifted with an average vertical
velocity
of 1 to 1.5 cm. s
'• up to 5 kin high
after
2 or 3 days
of
transport in the low troposphere. However. if such a mechanism can explain the presence of dust layers at high altitudes. it cmmot explain observed complex vertical structures composed of
several distinct dust layers.
• 0.05
c) 0
8...
8.5•
...
9 5 I t ... 1 'r-- 0.0301 4.5 : 2.5 0.0183 0.0111 0.0067 .-• 0.004 o 0.0024 o 0.0015 0.0009 us 8 8.5 9 9.5Universal time (hour)
0.00O5
Plate 2. Evolution of the aerosol extinction coefficientat 532 mn retzieved from lidar measurements performed at
[tAMONOIJ ET AL.: VERTICAL S]]•UCT[JRE OF LONG-RANGE DUST TRANSPORT 22,265 Table 2. List of the Lidar-Sounded Dust Transports. DOT. dust optical thickness.
Date (1997) DOT at 532 nm Number of Dust Layer(s) Altitude of Layer(s) (km) Thicka•ess of Layer(s) (km)
OItP-I
May 14 ,and 15 •0.1 2 2, 4 1.3, 0.8
May 17
OHP-2
Early moming e0.1 2 2.5, 4 1.3, 0.6
Late morning 1 3 2 May 8' Ths-5 Late morning .•0.1 2 1.5, 4 1, 0.5 Late afternoon •0.2 3 1.5, 3, 4.7 1.5, 0.8, 0.8 Ths-9 June 2' •0.15 2 2.5, 4 0.8, 1.2
'These events have been sotu•ded by the lidar system.
3.3. Dust-Loaded Air Mass Origin
For each of the lidar-sounded events we have been
investigating the likely origins of the dust particles taxiring
above the measurement site at 0000 and 1200 UT. For that
purpose we have been combining back trajectory calculations.
Meteosat infrared observation. TOMS aerosol index [Hem•an et
al., 1997]. and meteorological surthce charts from the European Meteorological Bulletin (EMB). Ush•g these different sources of information. we have tried to highlight the likely dust origh•s.
Up to 5 day back trajectory xvere pertbrined tbr the four levels mentioned in section 2.3. Their respective daily positions were projected onto the corresponding noon Meteosat infi'ared image to which we had previously applied the procedure described in section 2.2 and onto the corresponding TOMS aerosol index charts.
'Iris superhnposition of trajectories and turbid regions in North At¾ica suggests that in general, dust particles in the different layers do not originate t¾om the same area because of different wind directions or different wind speed. The identified areas tbr the sounded events are reported in Table 3. It should be mentioned here that these areas are only given as an indication of the origins of the dust particles and that it is not intended here to precisely identify the dust sources since such a precise
identification could be difficult to perfom• using Meteosat
infrared observation or TOMS.
From Tables 2 and 3 it seems that there exists a more or less
straigh link between the number of different identified regions
and the number of dust layers. Further insights into this lh•k can
be obtained by looking at two particular events for which we
have been able to observe a significant change in the vertical
structure (OHP-2 and Ths-5). In sections 3.3.1-3.3.2 we discuss
in parallel
changes
in the number
of identified
regions
and the
evolution of the vertical structure of these two events.
3.3.1. Case study of May 17, 1997 (OHP-2). In Table 4 we
have indicated xvhen and where the day-by-day positions (1200
UT positions) of the 0000 and 1200 UT back trajectories have
been coincident xvith zones identified as being dust loaded using
Meteosat infrared observation. We have noted the position in
which region local ground observations reported in the 0000 and
1200 UT surthce charts of the EMB have reported dust uptake.
As it appears in 'Fable 4 for all the period of study (from May 12
to May 16.1997).
at 0000
UT level
2 and 3 air masses
originate
Table 3. Likely Origins of Dust Particles Inside the Layers tbr
the Different Events
Event Likely Dust Origin(s) in the Observed Layers
OHP- 1
OHP-2
Early morning
Late moming
Ths-5
south Algeria, and north Tunisia
north Morocco, and South Tunisia
noah Morocco, west Algeria
Late moming south Morocco
Evening Ths-9
north Algeria, south Algeria,and south Ttmisia
22,266 HAMONOU El' AL.' VERTICAL S]]{UCTIJKE OF LONG-RANGE DUST TRANSPORT
Table 4. Results of the Comparison Between Likely Dust Sources andDay-by-Day Position of Air Mass Back-Trajectories for
Event OHP-2
OHP-2 Starting May
16,
1997
May
15.
1997
May
14,
1997
May
13,1997
May
12,
1997
Time, UTLevel 1 0000 no no no no no
1200 no no yes (5.47øE 36.48øN) yes (8.45øE 34.79øN) yes (10.67øE 33.70ø)
Level 2 0000 no no yes (8.51øE, 35.16øN) yes' (10.16øE, 32.06øN) yes (9.91øE 30.5øN)
1200 no no yes (1.42øW, 35.37øN) yes (0.5øW, 34.56øN) no
Level 3 0000 no no yes (3.42øW, 34.45øN) yes (1.76øW, 32.5øN) yes (4.63øW, 29.23øN)
1200 yes (0.46øW, 36.4øN) yes (6.39øW. 33.63øN) yes (6.42øW, 33.54øN) yes (5.15øW, 35.43øN) no
Level 4 0000 no 5'es (8.07øW, 33.45'JN) no no no
1200 no no yes (9.76øW, 31.97øN) no no
A "5'es" means that the trajectory. position coincides with a turbid area (position indicated in parentheses).
This means dust uptake is reproved in the meteorological surface maps.
fi'om two well-difl•:rentiated zones which roughly con'espond to east Morocco and south Tunisia while at 1200 UT they originate
fi'om east Morocco. This result is illustrated in Plate 3a. which
shows the noon Meteosat infrared image tbr May 13, 1997.
Dusty areas appear in hot colors (from yellow to red). whereas cloudy pixels have been set to white. The ending regions at 1200
UT on May 13 of the 0000 and 1200 GMT back trajectories
perforated in levels 2 and 3 are plotted as dashed lines. The con'esponding TOMS aerosol index for the Morocco area ranges
between 0.2 and 1.2. w hereas it stands between 0.7 and 1.7 Tunisia.
On May 13 and 14. the 1200 lIT surlhce clmrts of EMB report the presence of two therural lows ( 1005 mbar) centered on
east Morocco and south Tunisia which are typical of that region for this time of the year 1^ lotdin et al.. 1998]. During that period the meteorological conditions in these areas are unstable. The 0000 UT EMB charts reproved direct observation of dust uptake
on May 13 at one measurement station in south Tmfisia. In
Morocco. although no mention is made of the presence of dust. them is evidence of highly convective conditions which could be sufficient Ibr dust uptake. Indeed. the region is highly cloudy. and the presence ol' vertically developed cmnulus m•d cumulonimbus is reported.
From Table 4 it is apparent that levels I and 4 are also likely to transport dust to OHP since the air masses originate from a dust-loaded area. ttowever. it is not possible to conllrm the presence of dust in these layers abovc OHP becmtse in the ih'st
case the layer is below the detection limit of 1.5 km of thdidar
system and in the second case the presence of clouds does not allow the retrieval of the dust particles properties above 5 km.
It is striking that the evolution fi'om two very difli:rent likely
sources to one unique source Ibr level 2 and 3 air masses
between 0000 and 1200 lit is contmnporary with the evolution of the lidar-derived vertical structure from two layers to one single layer. This seems to reinforce the hypothesis of a relation between the number of different likely sources for the different air masses in the difl•rent levels and the number of dust layers.
3.3.2. Case study of May 8, 1997 (Ths-5). Hem is another
illustration of the above described relation. In Table 5 we have
reported the same inforotation as in Table 4 for Ths-5. As it
appears in Table 5. tbr the entire period (t¾om May 3 to May 7.
1997) at 0000 UT. level 2 air masses are fi'om a dusty region
situated roughly in north Libya (-16øE. 30øN). whereas level 3
air masses are t¾om a region situated somewhere between south Morocco and north Algerian Sahara (around 7.19øW, 28.37øN and 4.55øW. 28.47øN). At 1200 lIT the air mass source regions lbr levels 2 and 3 are the (;rand Erg Occidental in north central
Algeria (•2øE. 30øN) and the middle west of Tmfisia (-5.30øE.
33.7øN) respectively. 'lhese results are illustrated in Plates 3b
and 3c which am the same as Plate 3a but for May 4 and 7. 1997. respectively. Finally. fi'om 0000 to 1200 UT level 2 and 3 air masses are of two difl•rent origins which are probably
associated with the dust layers situated at 1.5 and 4 •. respectively. as can be seen in Plate I c.
From May 5 to May l l. as revealed by the surfbee meteorological charts. a cold front having a S-N orientation has
been progressing inside the Mediten'ancan basin. This cold fi'ont was associated with a low centered on Europe. ]]•e resultNg
increased w•ds are sufficient tbr the activation of dust sources.
Confimation of that point can be obtaNed once again by 1ook•g at the E• surface charts. which repmX obse•ations of dust uptake in some of the identified regions repofled in Table 5.
Moreover, Meteosat visible obse•ation reveals that all along its
displacemm•t the cold 1Yont has been associated with dust
outbreak inside the MeditmTanean basin.
The dust layer situated-5 km in Plate l c is most likely due to dust advection in level 4. Indeed. despite the results reposed in
Table 5. it is evident in Plate 3c that level 4 back trpiectory
ending regions at 1200 UT on May 7 and 0000 UT on May 8
smvound a likely dust source (nmlhwest Algeria. 0.52øW. 36.20 N• nm•h Tunisia. 10.83øE. •4.88 N), so that it is possible
Ibr level 4 air masses to be dust loaded be•een 1200 UT on
May 7 and 0000 UT on May 8. •Dfis statement is backed up by the 0000 UT E• chart of May 8, which repo•s dust uptake at •o obsemation s•tions in •e cmvespond•g area.
Finally. fi'om Table 5 one can see that level 1 is also l•ely to transprat dust fi'om south Libya. However. because of the height of this transport. dust pa•iclesadvected above •essalon•i will mix with the locally produced aerosols inside'Ihcssalon•i PBL. •us it is not possible to assess the presence of dust particles in
I IAMONOIJ ET AL.' VI/I¾1'ICAL STRIJCTI IRE ()I; IJONG-IL4NGE .DUST TRANSPORT 22,267
a)
4O 30 25 -10 0 •0 Longitude (ø) 2o 3o 50 40 30 • :20 := 15 10 0b)
45 4O c 3O -20 J o lO Longitude (o) 3O 50 4S 40::25
o•
15 10 0c)
4S 4O 3O .i -2o -lO o lO 20 Longitude (o) 50 4S 40 ao •= 82,5
.•
:•o e=
15 10 5 0Plate
3. Meteosat
noon
infrared
difii:rence
image
and
5-day
air massback
trajectories.
The 0000
UT (crosses)
and
1200
lit (phlsses)back
trajectories
are
computed
in the
different
model
levels
(blue,
level
4; red,
level
3' yellow,
level
2; white.
level
1;) for (a)May
13 (only
level
2 and
3 back
trajectories
are
plotted),
(b)May
4 and
(c) May 7.
22,268 HAMONOU ET AL.' VERTICAL STRIICT11RE OF LONG-RANGE DUST TRANSPORT
Table 5. Same as Table 4 but lbr Event Ths-5
Ths-5 Starting
May
7, 1997
May
6, 1997
May
5, 1997
May
4, 1997
Time, UT May 3, 1997
Level 1 0000 no no yes (21.69øE, 28.42øN) yes (21.28øE, 29.72øN)
1200 no no yes (11.7øE, 29.19øN) yes (12.99øE, 29.09øN)
no
yes (12.43øE, 31.49øN)
Level 2 0000 no no no yes (16.05øE, 28.33øN)
1200 no yes' (2.98øE, 32.57øN) yes (0.54øE. 31.6øN) yes* (2.13øE, 29.03øN)
yes (14.17øE, 32.31øN) yes' (1.40øE, 29.96øN) Level 3 0000 no no no yes (4.55øW. 28.47øN) 1200 yes' (5.30øE, 33.7øN) no no no yes (7.19øW, 28.37øN) no Level 4 0000 no yes (4.41øW, 31.95øN) no no 1200 no no no no no no
A "yes" means that the trajectory. position coincides with a turbid area (position indicated in parentheses).
This means dust uptake is reported in the meteorological surface maps.
that layer using solely lidar measurements. In section 4.1 a procedure that uses simultaneous Sun photometer is proposed to overcome this difficulty.
^,1oulin et al. [1998] have shown how the seasonality of the Mediterraneml transport could be explained by theseasonality of
the cyclogenesis inside mid aromld the basin. hideed. the average atmospheric circulation over the Mediterranean does not explain
the northward transport of dust particles, because winds mostly come fix)m the west or northwest ILaFonta#•e et al.. 1990] and cyclogenesis is needed to generate the northward winds. The wind fields generated under such meteorological conditions will be generally complex. Here we have presented two cases of such situations, and we have seen how the complexity of the wind
field could be linked to the multilayering of the transport. Taking
all these facts into account dust transport over the Mediterrmlean
might generally be a multilayered transport, as opposed to
transport hi the Atlantic trade winds.
4. Sun Photometer
and Lidar Synergy
From the above described study we have seen that dust- loaded air masses in the lower model layer (layer 1) (0.8+ 0.4
Ion) were likely to be advected above the measurement sites. It is
indeed possible for that layer to be transported just above the marine boundary layer, whose top height is ---300-500 m, and to
mix with the Thessaloniki PBL.
4.1 Respective Optical Thickness of Dust and Background Particles
Here we propose a procedure that uses Sun photometer
meastuements in order to apportion the respective contributions
of large and small particles to the aerosol optical thickness. As
dust particles are usually large and as Thessaloniki aerosol
backgrotmd is composed of small particles (see section 3.1), this will enable us to find out the proportion of dust particles that lies in the PBL.
Stm photometer measurements give access to the total atmospheric aeroml optical thickness (AOT•). It can be written as the sum of the aerosol optical thickness below 700 m (region
where our lidar is blind) and of the aerosol optical thickness in
the rest of the atmosphere. In our case, where no significant stratospheric aerosol load has to be considered. the rest of the atmospheric contribution is due to aerosol in the free troposphere. The latter is mahlly composed of dust particles. Let the dust optical thickness in the free troposphere be noted as Zdvr(•,). Assuming that there are dust particles in the boundary layer, the total aerosol optical thickness is the sum of the dust optical thickness in the PBL (Zdt•.(•,)) and of Thessaloniki's
aerosol background optical thickness (z•g•.(L)). Thus the optical
thickness retrieved from the Sun photometer measurements can be expressed as:
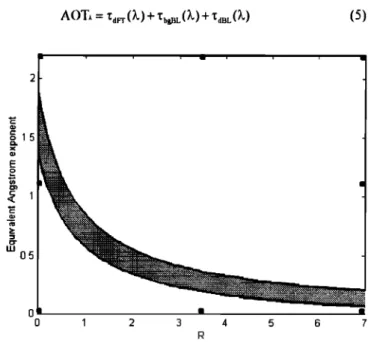
AOT, = •,•(•.) + •o•(•.)+
(5) 2 •..15 .>- tu 0.5 0 0 I ß ß 1 2 3 4 5 6 7Figure 5. Evolution of the equivalent visible Angstr6m
coefficient as a function of R assuming for Thessaloniki's • backgromld particles an Angstr6m exponent ct = 1.6 and for dust particles, tt = 0.
HAMONOIJ ET Air.' VERTICAL STRIJCTIJRE OF LONG-RANGE DUST TRANSPORT 22,269
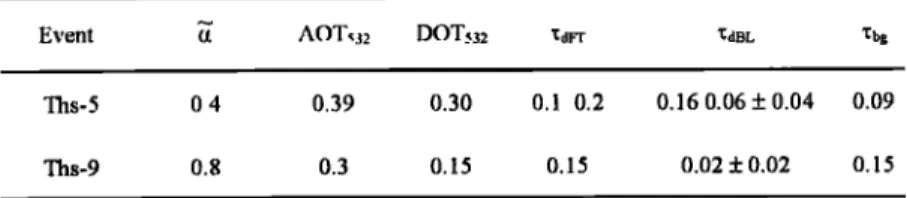
Table 6. Apportiomnent of the Dust Aerosol Optical Thickness at 532 mn
Between the PBL and the Free Troposphere for Two Dust Events in Thessaloniki
Event • AOT532 DOTs32 'I;dFT 'I;dBL '•bg
Ths-5 0.4 0.39 0.30 0.1 0.2 0.16 0.06 + 0.04 0.09
Ths-9 0.8 0.3 0.15 0.15 0.02 + 0.02 0.15
Now it is possible to get another relation makh•g use of the Sun photometer derived Angstrtm exponent which is an
equivalent Angstr6m exponent. (G) that is characteristic of the
mixture of all the aerosol that contributed to the measured signal: the dust particles and Thessaloniki's aerosol background. Their
respective AngstrOm exponents (adult and •bg) are necessary to
compute • which can be expressed as:
G
=
In Z -• -
•
(6)
where R is defined as
_dust _dust
R = %r + •
b[(7)
Thus provided that the equivalent Angstrtm exponent is obtained fi'om the Sun photometer, we are able to detennhm the
value of the ratio.
Figure 5 shows the evolution of the equivalent Angstrtm ex-ponent as a thnction of R. It was calculated assuming •dust =
0.0 + 0.1. chosen according to measurements of dust events
perforated in rather clean atmosphere in the tropical Atlantic
[Chiapello. 1996]. These lneasumments showed that during dust events the Angstrtm exponent fluctuated between -0.1 and 0.1.
A similar value has been reported in Crete [Dulac et al.. 1997].
Regarding a•s, we have taken a value of 1.62 + 0.26. where 1.62
is the yearly mean Angstrtm exponent retrieved from the Sun photometer measurements. which we have supposed to be
characteristic of 'Iliessaloniki background aerosol conditions.
and 0.26 is the associated standard deviation. Table 1 also gives the different R that we have found for the con'esponding dust events.
Because of the shape of the curves. the absolute error ot'R resulting from the uncertainty of a will get dramatically bigger as a gets smaller. Thus the validity domain of such a procedure should be restricted to a range of a for which uncertainties are comparably small. This would ensure a stability of the solution found for R (i.e.. small variation in c• will not generate large variations in R). We have calculated the uncertainties ofc• for May 8 and Jtme 2 using (2). They are of •-0.03 m•d 0.02, respectively. Using Figure 5 we have obtained the respective
ratios: 0.52<_R<1.1 and 1.7<_/•3.1. These are used in the section
4.2 to retrieve the dust optical thickness in the PBL.
4.2. Dust Optical Thickness in the PBL
Once we have found the ratio R between the total atmospheric dust optical thickness (I)OTO and the background aerosol
optical thickness. it is possible to derive the apportionment of
DOT• between the PBL and the fi'ee troposphere from equations
(5) and (8) using simultaneous lidar soundings. Indeed. Zd•r(Z)
can be considered as being simply the dust optical thickness that
we have retrieved from the lidar measurements.
Simultaneous lidar and Sun photometer measurements are
available for May 8 and June 2. 1997 (Ths-5 and Ths-9.
respectively). Table 6 summarizes the results of the procedure applied to these days. It appears that a significant dust optical
thickness is found in the PBL lbr Ths-5, while it is not the case
for Ths-9. This seems to agree with the results of the back
trajectory studies. Indeed. these have shown that for Ths-5. dust transport could take place in the air layer situated at 0.8+ 0.4
km. while it could not for Ths-9.
5. Conclusion
We have reported on the vertical sounding of several North African dust outbreaks over the Mediterranean basin performed in the framework of the European MEDUSE project. These soundings were perforated using two backscatter lidar systems operated at two stations (OHP. France. and Thessaloniki,
Greece) in the westelT• and eastern part of the Mediterranean
basin from spring 1996 to mid 1997. 'llle identifications and
character•ations of these outbreaks were made using a synergy
of lidar Sun photometer and satellite (Meteosat and TOMS) measurements.
Lidar soundings have revealed the multilayering of the dust transport above the Mediterranean basin. For each of the sounded events. several scattering stntctures were highlighted. •ll•ese appeared to correspond to the layers in which dust pm•icles were trapped and transported from turbid regions in North Africa. Their height ranged between 2.5 and 5 Ion. Our study has shown that this multilayering was associated with the complexity of the wind field (due to frontal conditions) that
activated different dust sources. Frontal conditions are
characteristics of the Mediterranean dust transport, and thus we believe that Mediterranean transport will be, in general, multilayered. This is just the contrary of the tropical Atlantic transport that is known to occur under trade winds inside one well-defined layer: the Saharan air layer.
Acknowledgments All measurements presented here are from the
Mediterranean Dust Experiment (MEDUSE) project, which was
principally thnded by the DG XII of the European Conmfission through
the 1994-1998 Envirotm•ent and Climate Programme (contract ENV4-
CT95-0036). We would like to aclmowledge G. Bergametti for helpful
discussions.