Magnetic microstructure of nanostructured Fe, studied
by small angle neutron scattering
W. Wagner
Paul Scherrer Institute, CH-5232 Villigen PSI, Switzerland A. Wiedenmann
Hahn-Meitner-Institut, Glienicker Strasse 100, D-1000 Berlin 39, Germany W. Petry
Institute Laue-Langevin, 156X, F-38042 Grenoble, France A. Geibel and H. Gleiter
Institut fur neue Materialien, Gebaude 43, Universitat des Saarlandes, D-6600 Saarbrucken, Germany
(Received 21 March 1991; accepted 18 June 1991)
Small angle neutron scattering (SANS) was applied to achieve insight into the magnetic correlations in nanostructured Fe. The results confirm the expected microstructure involving ferromagnetic grains and a nonmagnetic or weakly magnetic interface region, the interfaces occupying about half the specimen volume. The SANS measurements further reveal that in nanostructured Fe the magnetic correlations are not confined to single grains, but are extended across the interfaces and result in the alignment of the magnetization over several hundreds of grains. An external field of 1.5 kOe is not sufficient for complete magnetic alignment of the entire specimen. However, the long-range magnetic correlations are considerably disturbed by this field. Reducing the external magnetic field to zero causes the magnetic correlations to resume microstructural characteristics similar to what they had in the original state.
I. INTRODUCTION
The structures of nanostructured materials are unique in the sense that grain boundaries comprise a significant fraction of the total volume of the material. Therefore the properties of nanostructured materials often differ from those of their polycrystalline counterparts, having larger grain sizes. For example, nanostructured materials are expected to exhibit interesting ferromagnetic prop-erties if the crystal size becomes comparable or less than the typical thickness of a ferromagnetic domain. Preliminary studies of the magnetic microstructure of nanostructured Fe by means of the Bitter method and Kerr microscopy revealed the absence of a ferromagnetic domain structure and indicated the existence of irregular spatial fluctuations of the local magnetization. However, the lateral resolution of both methods was obviously not sufficient to relate the observed magnetic structure to the compositional microstructure of the grains and grain boundaries. On the other hand, small angle neutron scattering (SANS) is known to be well suited for study-ing magnetic structures with characteristic wavelengths of 100 nm or less. Hence the present study by SANS was carried out with the aim to achieve insight into the magnetic correlations in nanostructured Fe (n-Fe), in relation to the compositional microstructure of grains and grain boundaries. Neutrons combine interactions with compositional as well as magnetic structures of the
speci-men and therefore represent a unique probe to simultane-ously monitor compositional and magnetic correlations. The present report presents the results and interpretation of a SANS study on two specimens of n - F e , charac-terizing the compositional and magnetic microstructure without an external magnetic field, and the response of magnetic correlations to external magnetization.
II. EXPERIMENTAL
Nanometer sized crystalline a - F e samples (disks of thickness ~ 120 /im, diameter 8 mm) were prepared by compacting (2 GPa pressure) 8 nm sized iron crystals into a solid. The small iron crystals were produced by an inert gas condensation technique as described, for example, in Ref. 1. Two specimens were prepared inde-pendently, specimen A a few days, specimen B several months before the measurements. To avoid oxidation or uncontrolled resorption of impurities, specimen A was sealed immediately after preparation, without any contact to air, in a flat quartz cuvette filled with purified Ar. Specimen B was exposed to air for a period of two weeks after preparation. It then was sealed in a quartz cuvette similar to specimen A. Inside the cuvette the n - F e disks were mounted behind a Cd aperture of 6 mm diameter.
The SANS measurements were carried out at the small angle camera D l l of the ILL Grenoble.2 The
measurements were performed at ambient temperature, with the specimens placed between the pole pieces of an electromagnet that allowed a homogeneous mag-netic field to be applied horizontally, perpendicular to the incoming neutron beam, and parallel to the fiat surfaces of the n - F e disk. Choosing three different detector positions, i.e., 1.2, 5.0, and 30.0 m from the specimen, the range covered in momentum transfer Q was 1.6 x 1 0 ~2 < Q < 2.6 n m "1 [Q = (4vr/A) sin 6,
29 — scattering angle].
The intensity data were corrected for background, cuvette scattering, transmission factors, and specimen geometry. Variations in the acceptance of different ele-ments of the area-sensitive detector were corrected by normalizing to a water spectrum. Absolute values of the differential scattering cross section dcr/d£l(Q) in units of barn/(sr at.) were computed by referring to the averaged incoherent scattering of a water specimen.
III. RESULTS
A. Microstructural model
Following earlier considerations,3 we treated n - F e
as a two-phase material composed of distinct interface and crystalline phases. The external surface as well as internal flaws like pores or cavities, if present, are attributed to the "interfaces". Regarding microstructure and magnetic properties of the two phases, the following assumptions were made:
(1) The crystalline phase has the structure and density of a - F e (p0 — 7.874 g/cm3) with the atomic
volume 0 = 0.0118 nm3. In each crystallite the
mag-netic moments of the Fe-atoms are ferromagmag-netically ordered at ambient temperature with the magnetic moment fj, = 2.22 \iB of bulk Fe.
(2) The interfaces are diluted zones of density 1Po(O ^ <Z ^ 1)> without spontaneous magnetization (M = 0).
The justification of these assumptions and their compatibility with the experimental results will be dis-cussed later.
B. SANS results
In the diffraction experiment, the thermal neutrons monitor the spatial variation of both the nuclear and magnetic scattering length density, resulting in two con-tributions to the differential scattering cross section:
W n u c l
(Q) = (1 - «)2(A6nucl)2inucl(Q, R) (1)
and
where Q is the scattering vector and the structure func-tions i ( Q , R) represent the square of the Fourier transform of the nuclear or magnetic correlations, respectively.
In terms of the assumptions, the contrast for nu-clear scattering is (A&nuci) — 0.910 barn/(sr at.), as
tabulated,4 and for magnetic scattering5 (Afrmagn) =
(0.27 • 2.22)2 barn/(sr at.) = 0.359 barn/(sr at.).
For our samples, in which the orientation of the crystallites is random, the nuclear scattering is isotropic with regard to the azimuthal angle about the incoming beam direction. The radial cross section for nuclear scattering then is given by Eq. (1), replacing Q by its modulus Q. The magnetic scattering, however, depends on the angle between Q and the magnetization vector M. When a is the angle between both vectors, projected to the plane perpendicular to the incident beam, Eq. (2) can be converted to the radial scattering cross section about the incoming beam as follows:
dSll
(Q, a) - ( A 6m a g n)2im a g n( Q , R) sin amagn
^-) (Q) = ( A 6m a g n)2im a g n( Q , R) (2) ai L magn
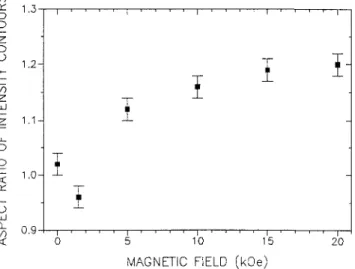
(3) The measured SANS intensity is a linear super-position of the nuclear and magnetic scattering. Figure 1 shows examples of the two-dimensional scattering patterns for n - F e in different external magnetic fields. Without an external field, the scattering pattern is isotropic, giving evidence that on the average all orientations of the grains and of the magnetization vectors relative to the scattering vector are equally probable. For external fields of 5 kOe and above, the isointensity contours in Fig. 1 are vertically elongated ellipses, as expected for increasing alignment of the magnetization toward the direction of H. The aspect ratios of the vertical to horizontal axes of the contours, plotted in Fig. 2 versus applied field strength, represent a measure for the collective magnetic alignment.
For the sake of lower statistical noise, all further evaluation was done after averaging the scattering data with regard to the azimuthal angle. The resulting radial scattering curves of specimen A are plotted in Fig. 3 for zero field (H = 0) and for the maximum field applied (//max = 20 kOe). Figure 4 focuses to the lower Q range, showing the field dependence of the scattering in more detail. Extracted from the data underlying Fig. 4, the scattering versus field strength at selected Q values is plotted in Fig. 5. It should be noted that both figures include the scattering after reversion from H — HmeLX
to H = 0.
C. Data evaluation
A quantitative evaluation of the SANS data was performed by using an algorithm which computes da/dQ(Q) on the basis of the modeled microstructure.
W. Wagner et al.: Magnetic microstructure of nanostructured Fe
H = 0
H = 5 kOe
H = 1.5
kOei-*-NH = 10 kOe
FIG. 1. SANS isointensity contours from n-Fe, measured at the 30 m detector position, for different strong external magnetic fields applied horizontally to the specimen.
Focusing first to the scattering curve for i ?m a x
(cf. Fig. 3) we assume maximum magnetization, i.e., uniform alignment of all magnetization vectors parallel to H. Then, by combining Eqs. (1) and (3), the average
radial scattering cross section is found to be da
dQ,
\i(Q,R) (4) | ( l - g )2( A 6n u c l) 1
The factor of | for the magnetic scattering arises from averaging Eq. (3) with regard to a. The structure function i(Q, R) in this case is common for both the nuclear and magnetic scattering. It is described by an ansatz for a polydisperse array of scattering particles:
, R)V{R)N(R) dR (5)
The single particle scattering function F(Q, R) is approximated by the structure function for spheres of radius R,
10 15
MAGNETIC FIELD (kOe)
20
F(QR) = ^ QR - QR cos QR) (6)
FIG. 2. Aspect ratio of the vertical to horizontal axes of the SANS isointensity contours from n-Fe, as shown in Fig. 1.
V(R) is the particle volume, and N(R) dR is the incremental volume fraction of particles in the size interval between R and R + dR.
7
--1.5 -1
log Q/nrrT
-0.5
FIG. 3. SANS structure functions of n-Fe (specimen A) in zero field and maximum field, averaged azimuthally at each value of Q. The solid curves represent calculated structure functions, fitted to the data.
Knowing the function N(R), which describes the size distribution of the scattering particles, average size and average volume can readily be determined. In addition, integration over N(R) yields the total volume fraction of the scattering particles, i.e.,
/„(!-/„) = j ' N{R)dR (7)
A log-normal ansatz was chosen to parameterize N(R). In some cases, a suitable fit over the entire covered Q range required a linear combination of up to four log-normal functions for N(R), centered at positions R^, all given the same width, a, but different amplitudes Ak:
N(R) = exp
fe=i
(log R/Rk
2a2 (8)
The best fit for dcr/dQ,(Q) derived from our scat-tering model is plotted in Fig. 3 as the solid curve in comparison with the related SANS data for H = i?m a x.
Without external magnetization, the compositional microstructure should remain unchanged; only the mag-netization vectors of the crystallites are distributed at random. If no further magnetic fluctuations are present, the radial scattering cross section then, in equivalence to
o ^ 4. • O • o dD 0 • o. o H = 0 A H = 1.5 kOe • H=5 kOe o H=20 kOe A H=0 (rev) -1.8 -1.6 -1.4 -1.2 log (Q/nm 1)
FIG. 4. SANS structure functions of n-Fe (specimen A), averaged azimuthally at each value of Q, for different strong magnetic fields applied to the specimen, including reversion to zero field.
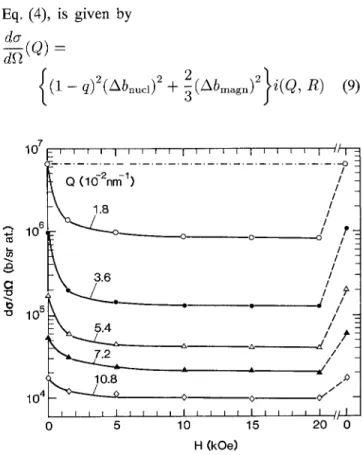
Eq. (4), is given by da
(1 - g)2(A6nuci)2 + l{Abmagn)2\i(Q, R) (9)
10' Q 10 CO w
a
G •u "° 10 10 p | Q (iti~2nrri~1rV
t8
F\ 3.6M
K 10-8 I > > i . i ) i i i i i i i i i i i i i i n i -/ I / // r.
O 0 / -/ / / 7 / — . J ,/A//
A
/
y 1 i i i I 1 // ! 10 15 H (kOe) 20 0FIG. 5. Field dependence of the SANS scattering cross section of n-Fe, for selected values of Q from the range given in Fig. 4.
W. Wagner et al.: Magnetic microstructure of nanostructured Fe
with the same common structure function but a factor of | instead of | for the magnetic contribution.5
Viewing Fig. 3, an unchanged structure is verified for Q ^ 0.3 n m "1 (log Q ^ - 0 . 5 ) by the observation
that the scattering curves measured with and without magnetic field are parallel in course in the log-log presentation.6 Intensity scaling in this Q range yields
a scaling factor of 1.12. Relating Eq. (9) to Eq. (4), this scaling factor can be realized for q = 0.40, i.e., for an average interface density of 40% bulk density.
For Q < 0.3 n m "1 (log Q < - 0 . 5 ) , universal
scal-ing fails. Rather, a considerable scatterscal-ing contribution is observed in zero field that is suppressed in a field of 20 kOe, substantially more than the difference between Eq. (9) and Eq. (4) would allow for. This effect cannot be attributed to structural rearrangements caused by diffusional processes, because (i) it is unlikely that the necessary atomic mobility is available at ambient temperature and (ii) diffusional processes would not be reversible; the scattering contribution, however, re-covers when the field is switched off (cf. Figs. 4 and 5). Therefore the scattering is suggested to originate from magnetic fluctuations superposed to the magnetic structure of grains and grain boundaries.
In order to separate the contribution of the super-posed magnetic fluctuations, the scattering measured for H — 20 kOe, properly scaled by the factor 1.12, was subtracted from the zero field scattering. The re-sulting intensity differences are plotted in Fig. 6 for both specimens investigated. These differential curves were evaluated by an equivalent calculation procedure as described above, assuming merely magnetic origin for the scattering, i.e.,
(Q) = 2
-3 'mag:;n(Q,
(10) where p accounts for the difference of the average magnetization across the fluctuations from the maximum magnetization of bulk Fe (0 < p ^ 1). For im a g n( Q , R),
the ansatz given in Eq. (5) was taken, now with N(R) representing the size distribution of the additional, superposed magnetic fluctuations. In equivalence to Fig. 3, the best model fits to the difference data are plotted as solid curves in Fig. 6 along with the data.
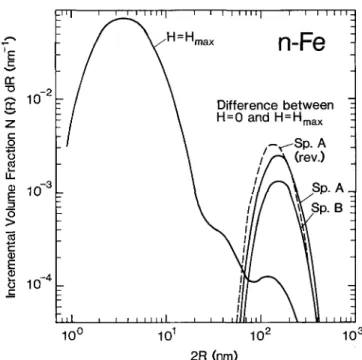
The distribution functions N{R) obtained by means of the fitting procedure are plotted in Fig. 7, for the original data of specimen A in maximum fields (data of Fig. 3), and for the difference data of both speci-mens (Fig. 6), including specimen A in zero field after reversion from maximum field.
IV. DISCUSSION
Assuming that the distribution function N(R) of the specimen in Hmax (cf. Fig. 7) represents the size of the
n-Fe
Difference between H=O and H = Hm a x Specimen A Specimen B - 2 log Q/nmFIG. 6. SANS differences between zero field and maximum field (cf. Fig. 3), the latter scaled by a factor of 1.12 before subtraction to account for magnetic anisotropy. The solid curves represent calcu-lated structure functions, fitted to the data.
2R (nm)
FIG. 7. Particle distribution function resulting from the model fit to the SANS data of specimen A for H = _ffmax (cf. Fig. 3), along
with the size distribution of the superposed magnetic fluctuations obtained from the model fit to the SANS differences between H = 0 and H = -ffmax for specimens A and B, including specimen A after
grains, an average diameter of 7 nm is deduced. This agrees well with the grain size derived from peak broad-ening of the Bragg reflections measured for the same specimen by wide-angle neutron diffraction.7 The N(R)
function for Hmax further reveals that heterogeneities
larger than 30 nm in diameter are of minor significance. Integration over N(R), cf. Eq. (7), yields fp(l
-/p) = 0.30, indicating a volume fraction of scattering
particles of roughly 50% in our specimen. It should be noted that this value can be taken only as a crude estimate in a highly dense system where "particles" and "matrix" cannot unambiguously be identified as such. However, the value seems reasonable and agrees with the assumptions of the model.
Furthermore, the assumptions—ferromagnetic grains embedded in a matrix of nonmagnetic interfaces—agree with the intensity scaling at Q ^ 0.3 n m "1 (cf. Fig. 3):
The parallelity and noncoincidences of the scattering curves for zero and maximum magnetization give evi-dence that the compositional microstructure is associated with a congruently shaped magnetic microstructure. In other words, the interfaces have a significantly lower average magnetic moment than the grains, otherwise no magnetic contribution to the scattering contrast would arise. The scaling factor of 1.12 requires an interface density of 40% bulk density. This value is reasonable and consistent with results from other experiments on nanostructured materials.8
The essential result of the present study arises from the field dependent SANS alteration at small Q(Q < 0.3 n m "1) . As outlined above, this alteration is
related to magnetic fluctuations that are not congruent with the compositional microstructure of grains and interfaces. The distribution functions related to the SANS differences between H = 0 and #m a x (Fig. 7)
reveal spatial extensions between 70 and 350 nm for those fluctuations, with the average around 190 nm. Relating their three-dimensional extension to the average volume occupied by a grain, one finds that the magnetic correlations join numerous crystallites, about 300 on the average. This observation indicates that the magnetic fluctuations extend across the interfaces, although those were identified to be nonmagnetic, or at least of significantly lower magnetic moment than the inside of the crystallites.
The determination of the volume fraction covered by the magnetic fluctuations suffers from the ambiguity of the scattering contrast in Eq. (10). However, even under the unrealistic assumption that/? = 1, i.e., that the average magnetic moment in the fluctuations is that of bulk Fe, a volume fraction of about 20% is obtained from the N(R) functions. A lower magnetic moment would yield an even higher volume fraction; the maximum possible volume fraction of 50% is obtained for p ss 0.8.
The results indicate that not only a minor fraction but essentially the entire specimen volume is covered by the overlaid magnetic order, and that the magnetic moment of the fluctuations is significant, i.e., about 1.8 //B, or
± 0.9 HB for alternating magnetization directions of neighbored fluctuations.
Some further important observations have to be mentioned:
(i) The magnetic fluctuations are observed with very similar characteristics in both specimens investigated. The specimens were prepared independently, specimen A a few days, specimen B several months before the measurements. Apparently the phenomenon seems char-acteristic to n - F e .
(ii) The fluctuations are suppressed by external mag-netization, but recover reversibly when the external field is removed, cf. Figs. 4 and 5. The time period of recovering is shorter than the experimental turnaround time of a few minutes.
(iii) The field dependence illustrated by Figs. 4 and 5 demonstrates the efficiency of the suppression of the magnetic fluctuations even by a relatively low external field: e.g., for H = 1.5 kOe, between 70 and 90% of the related SANS intensity has vanished.
(iv) The suppression is more pronounced at low Q (1.8 x 10~2 nm"1) than at large Q. This observation can
be rated as an indication against "coarsening" of the fluctuation by the influence of the external field, because coarsening would have caused the intensity at low Q to increase at the expense of the intensity at larger Q.
(v) Comparing the field dependence of the magnetic fluctuations (Figs. 4 and 5) with the development of the intensity contours that represent a measure of the collective alignment of the magnetization vectors of all grains (Figs. 1 and 2), significantly higher fields are required for the macroscopic alignment than for the suppression of the magnetic fluctuations.
The results reported seem to agree with recent studies of the magnetic microstructure of n—Fe by means of the Bitter method and Kerr microscopy.9 Kerr
mi-croscopy revealed fluctuations in the local magnetization with characteristic dimensions in the order of 1000 nm or less. The lateral resolution of both methods is about 500 nm or more. In other words, most features of the magnetic microstructure noticed by neutron diffraction cannot be made visible by the Bitter method or Kerr microscopy.
V. CONCLUSIONS
The SANS results on nanostructured (7 nm) Fe suggest a microstructural model involving ferromagnetic grains and nonmagnetic (or weakly magnetic) interfaces. The average density in the core of the interfaces seems to be about 40% of the density of the crystallites. In
W. Wagner et al.: Magnetic microstructure of nanostructured Fe
the absence of external magnetization, the magnetic correlations are not confined to single grains, but extend across the interfaces and result in the alignment of the magnetization over several hundreds of grains. The alignment results in a SANS contribution of magnetic origin, superposed on the (nuclear and magnetic) contri-butions from the microstructure of grains and interfaces. An external field of 1.5 kOe is not sufficient for complete magnetic alignment of the entire specimen. However, the long-range magnetic correlations achieved by this field result in a 70 to 90% reduction of the related SANS intensity. Reducing the external magnetic field to zero causes the magnetic correlations to resume similar microstructural characteristics as in the original state.
ACKNOWLEDGMENTS
The authors are grateful to Dr. R. Birringer for contributing to the present study. One of the authors
(W. Wagner) would like to thank Dr. P. Boni for valuable discussions and suggestions for the interpretation of the SANS results. The financial support of the Deutsche Forschungsgemeinschaft (G. W. Leibniz Programm) is appreciated.
REFERENCES
1. H. Gleiter, Prog. Mater. Sci. 33, 223 (1989). 2. K. Ibel, J. Appl. Cryst. 9, 296 (1976).
3. X. Zhu, R. Birringer, U. Herr, and H. Gleiter, Phys. Rev. B 35, 9085 (1987).
4. L. Koester and H. Rauch, IAEA-contract 2517/RB (1981). 5. C. G. Shull and M. K. Wilkinson, Phys. Rev. 97, 304 (1955). 6. P. Fratzl, J. L. Lebowitz, J. Marro, and M. H. Kalos, Acta Metall.
31, 1849 (1983).
7. P. Boni and W. Wagner, accepted for publication in Physica B (1991).
8. W. Wagner, R. S. Averback, H. Hahn, W. Petry, and A. Wieden-mann, J. Mater. Res. 6, 2193 (1991).