The vulnerability of beach tourism to climate change—an index approach
28
0
0
Texte intégral
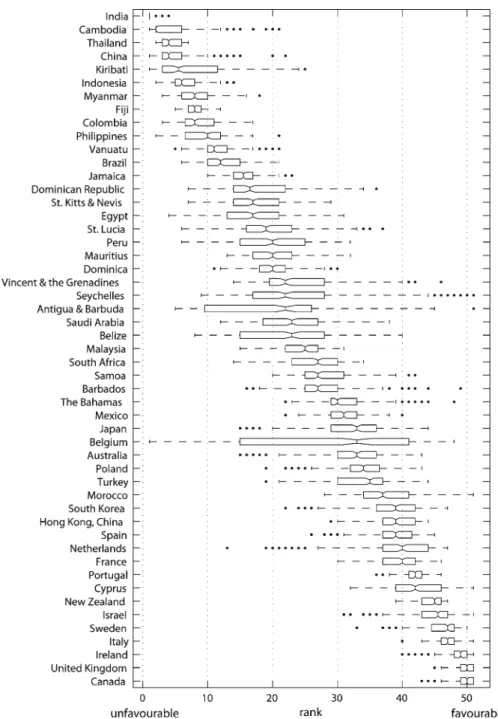
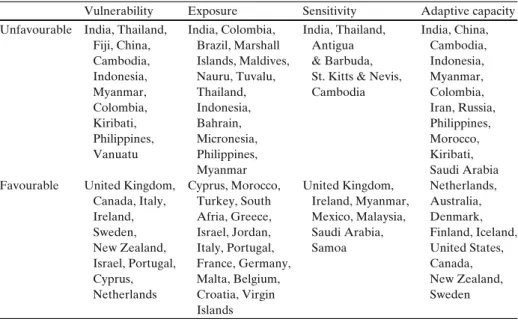
Figure


+3
Documents relatifs