Electrophysiological Evidence for Fast Visual Processing through the Human Koniocellular Pathway when Stimuli Move
9
0
0
Texte intégral
(2) 2000), the majority of studies on the visual system concentrate purely on the magno-parvocellular dichotomy, not taking into account a third, presumably important, retinogeniculocortical pathway, the koniocellular (K) pathway. This pathway, described in the prosimian bushbaby (Galago) and in simian primates (macaque) [for reviews see (Casagrande, 1994; Hendry and Reid, 2000)], is anatomically distinct from the M and P pathways, projects directly to the color-selective blobs in area V1 and carries color opponent signals. In contrast to the P pathway transmitting red/green opponent signals, the K pathway relays blue-on signals driven by S-cone input (Martin et al., 1997; Reid et al., 1997; White et al., 1998) [for a review see (Dobkins, 2000)]. While the role of the K pathway in color processing is known, its contribution to other aspects of vision has been less well investigated. K cells show a variety of physiological characteristics, implying that the K pathway may have several functional roles (Casagrande, 1994, 1999; Hendry and Reid, 2000). Since some K cells are direction-selective (Casagrande, 1994), it is conceivable that the K pathway has a role in motion encoding. In this respect, cortical motion areas (i.e. MT/V5) have been demonstrated to receive substantial S-cone input both in humans and macaques using fMRI and single/multi-unit recordings (Seidemann et al., 1999; Wandell et al. 1999). This mirrors psychophysical studies suggesting that S-cones contribute to motion in a non-negligible way (Lee and Stromeyer, 1989; Cavanagh and Anstis, 1991; Gegenfurtner and Hawken, 1995; Dougherty et al., 1999). In the present study, we aimed to investigate how and when moving stimuli are processed in the human brain when the visual information is relayed through the K pathway. The emphasis was on the timing of brain activity. For this purpose, we recorded cortical activation patterns to tritan stimuli in humans. We applied tritanopic stimulation as proposed elsewhere (Cavanagh et al., 1992). Under the tritanopic condition, the image information is carried principally by the S-cone signals isolating the K from the P and M pathways, the latter two presumably receiving only negligible S-cone input [for a review see (Dobkins, 2000)]. Although there is some evidence for S-cone input to the P (Derrington et al., 1984; Klug et al., 1992) and to the M pathway (Calkins 2000), the general consensus today is that S-cone contribution to those pathways is negligible if not altogether absent (Dobkins, 2000). The cortical response patterns were recorded using recently developed high resolution scalp evoked potential techniques. These allow the determination of the electric fields of the brain in real time and enable the detection of time periods where particular field configurations crucial for stimulus encoding appear. In combination with new distributed source localization techniques, the areas activated during such crucial time periods can be determined. We compared the cortical response patterns to moving tritan stimuli with those evoked by moving luminance-defined stimuli. Luminance-defined moving stimuli are most likely carried by the M pathway and areas of the dorsal stream [for review see (Gegenfurtner and Hawken, 1996)]. We sought to determine whether electrical field patterns ref lecting the encoding of tritan and luminance-defined moving stimuli are similar, suggesting that visual processing specific to motion conditions share common cortical substrates when mediated through the K- and the M pathway input or whether there are K input specific activation patterns. The present study was furthermore designed to provide information on how fast moving tritan stimuli are processed in the human brain. Electrical field patterns may differ in latencies with the patterns of moving tritan stimuli lagging. 818 Human Cortical Responses to Moving S-cone Stimuli • Morand et al.. behind those of moving luminance stimuli, or vice versa. To test whether such latency differences may simply ref lect differences in conduction latencies of the K- and the M pathway, two non-moving stimuli were included. These consisted of stationary tritan and luminance-defined stimuli, presumably carried by the K- and the M pathway respectively. If potential cortical latency differences between motion conditions are due to differences in conduction latencies of the two subcortical pathways, the same latency differences should be obser ved between the two non-motion conditions.. Materials and Methods Subjects A total of 17 remunerated undergraduate students (nine men and eight women) took part in the experiment. Mean age was 23 ± 2.5 years. All volunteers were right-handed according to the Oldfield–Edinburgh questionnaire (Oldfield, 1971). They had no history of psychiatric or neurological disorders and had not previously participated in an electrophysiological study. They had normal or corrected-to-normal vision, were not color-blind, and gave their written informed consent. Stimuli and Experimental Set-up Subjects were tested in four conditions with either color-defined (tritan) or luminance-defined (black and white) moving or stationary stimuli. Isoluminant tritan stimuli were produced using a technique proposed by Cavanagh et al. (Cavanagh et al., 1992). This technique, which has been applied to isolate blue (S) cone functions in a few previous studies, is much less demanding and more robust against luminance artifacts than other techniques used with isoluminant red–green stimuli (Cavanagh, 1991; Cavanagh et al., 1992). Stimuli are created by the superposition of a blue image (in our study gratings/checkerboards varying between two levels of blue) on a uniform bright yellow field (appearing as a white/yellowish image on a yellow ground). The yellow field drives the response of the red (L) and green (M) cones to a saturated level. Since these cones are the principle source of the luminance signal and since the contribution of the blue (S) cones to luminance is pushed well below the luminance contrast threshold by the bright yellow field, the luminance pathway sees only a uniform field and the image is effectively isoluminant. Only the blue (S) cones respond differentially to the information contained in the variation of the blue image. Stimuli were created with a Power Macintosh 7100/66 computer using the Shell and Macglib software (Micro M. L. inc., Québec) and displayed on a 17″ screen, with a refresh rate of 75 Hz and 256 intensity levels per color. The Commission Internationale d’Eclairage (CIE) chromaticity coordinates for our stimulus display monitor were red (0.620, 0.335), green (0.285, 0.590) and blue (0.151, 0.067). All chromatic stimuli were generated by differential modulation of only the monitor’s blue phosphor, while red and green phosphors were set at maximum levels, producing 28, 3 and 2% cone contrast in S, M and L cones respectively (Smith and Pokorny, 1972, 1975). The mean luminance for tritan stimuli was 75 cd/m2 (equal for the white and yellow fields). For the achromatic stimuli, S, M and L cone contrast was equated (17%) and the luminance for black and white checks was 2 and 80 cd/m2 respectively. The stimuli tested in the four conditions consisted of: (i) moving tritan stimuli: sinusoidal gratings with a spatial frequency of 1.1 cycles/deg produced with the tritanopic technique described above. Gratings moved horizontally from left to right at a velocity of 12 deg/s (12 Hz), on for 200 ms and off for 800 ms. The offset pattern consisted of the stationary image. (ii) Moving luminance (black and white) stimuli: the same design, with sinusoidal gratings produced along a luminance axis from black to white. (iii) Stationary tritan stimuli: checkerboards with a spatial frequency of 0.8 cycles/deg produced with the tritranopic technique, presented as on/off for 500 ms respectively. The offset pattern consisted of a bright isoluminant yellow field. 4- Stationary luminance (black and white) stimuli: the same design, with black and white checkerboards and a gray field as offset pattern. A dark cross of 1° of visual angle was placed in the center of the stimulus field and the subjects were instructed to fixate this cross.
(3) throughout the task. All stimuli were circular and presented centrally at 2° of radial eccentricity from the central cross and covered 10.5 × 10.5° of visual angle. Subjects were seated at a distance of 120 cm from the monitor with head and chin support to reduce head movements. EEG recordings were made in a darkened and electromagnetically shielded room. EEG Recording and Averaging EEG was recorded continuously from 46 manually applied Ag/AgCl electrodes (electrodes and paste from Grass Instruments, Quincy, MA). Electrode impedance was kept below 5 KΩ. EEG was sampled at 1000 Hz and bandpass-filtered to 0.5–100 Hz. All electrodes were referenced to Cz and re-computed off-line to an average reference. The exact position of each electrode was recorded by means of a 3-D digitizer (ISOTR ACK, Polhemus, Inc., Colchester, VT). These measurements were later used to calculate, for each subject, spatially normalized visual evoked potentials (VEPs). Eye movements and eye blink artifacts were monitored with bipolar electro-oculogram (EOG) leads. The 46 EEG and the EOG traces of each single trial were aligned off-line to the time point of stimulus onset and carefully scanned for artifacts and eye movements before being included in within-subject averages (individual VEPs). At least 200 artifact-free trials were averaged per subject and condition. The 46 single traces of each individual VEP were then interpolated to a standard array of 41 electrodes using nearest neighbor interpolation (spatially normalized individual VEPs). These VEPs were visually searched for the topographic field configuration (map) typically occurring at ∼100 ms after stimulus onset [P1 map characterized by occipital positivity, when calculated based on the average reference; see (Lehmann and Skrandies, 1980)]. Individual VEPs were realigned to this map at the time point of its maximum global field power (Lehmann and Skrandies, 1980) before cross-subject averages (grand-means) were computed. Realignment procedures have been developed to improve grand-means by compensating for latency shifts due to differences in information processing speed between subjects (Woody, 1967). VEP Analysis The aim of the analysis was to isolate topographic VEP map configurations which are specifically associated with the processing of either luminance or tritan, moving or stationary stimuli, and to provide clues on the brain sources which might have given rise to these maps of interest. For this purpose, we combined temporal segmentation and spatial fitting techniques with source localization procedures as previously applied in several event-related potential (ERP) studies (Brandeis et al., 1992; Pegna et al., 1997; Khateb et al., 1999; Michel et al., 1999a; Thut et al., 1999, 2000). Temporal Segmentation The grand-mean VEPs were temporally segmented into sequences of quasi-stable electrical field configurations using a k-means cluster analysis method derived from pattern recognition algorithms (Pascual-Marqui et al., 1995). The segmentation procedure results in a number of template maps that represent the most dominant electrical fields present in the grand-means. A cross-validation criterion is used to define the number of maps that optimally explain the whole data set (Pascual-Marqui et al.,1995). We searched for those maps that are specific to certain stimulus conditions, likely to ref lect condition-specific cortical activity. Since the segmentation is based on grand-means, fitting procedures as described below are needed to provide information on inter-individual variability. The fitting results are used for statistical exploration, i.e. to look for those maps which are unique to certain conditions (condition- specific maps) and to make inference on their timing. ERP Map Fitting The template maps resulting from grand-mean segmentation were fitted to the individual VEPs of each condition. Formally, spatial correlation coefficients were calculated between the template maps and each individual VEP map to search for the time periods which most resemble the template maps. The correlation coefficient disregards the field strength and is a pure measure of spatial similarity. A similar procedure was used by Brandeis (Brandeis et al., 1992) as a topographical com-. ponent recognition strategy and has been further developed and applied to different data sets (Pegna et al., 1997; Khateb et al., 1999; Thut et al., 1999, 2000). The ERP fitting provides two indices on each template map’s representation in the individual VEPs, its goodness of fit (% explained variance) and its temporal appearance (time point of best fit). The former variable was subjected to statistical tests to identify condition-specific maps. We looked for those maps which best explained certain conditions with respect to all others. For this purpose, we first searched for those template maps that showed overall between-condition differences in percentage of explained variance using Friedman analyses of variance (ANOVAs). Where significant, percentage of explained variance was compared for all possible condition-pairings (n = 6) using Wilcoxon matched-pairs tests, allowing for an exploration of which condition(s) the given template map was specific for. Further statistical analyses were performed on the time point of best fit to provide clues on the timing of these maps. Source Localization The final step in the analysis consisted of estimating the brain areas activated during the condition-specific segments of stable map topography. For this, the sources of each template map of interest were estimated using a recently developed distributed linear inverse solution, called ELECTR A (Grave et al., 1998, 2000; Michel et al., 1999b). ELECTR A estimates the potential distribution in depth, restricting the set of possible solutions to the type of currents that can produce electrical measurements (EEG) and leads thus, as with intracranial recordings, to positive–negative patterns of activity in the brain. ELECTR A activity is then interpreted with respect to its absolute values, independent of positive or negative signs. A three-shell spherical model with a radius of 7.8 cm was used with solutions calculated within a regular grid of 1152 nodes, lying within the upper hemisphere, and with a radius equal to 86% of the total sphere radius. Detailed discussions of the distributed linear inverse solution methods in general and their limitations are given elsewhere (George et al., 1995; Grave et al., 1998; Fuchs et al., 1999; Michel et al., 1999b).. Results Figure 1 illustrates the grand-mean VEP map series as a function of time for each of the four conditions. The four VEP map series were together subjected to the segmentation procedure, which revealed 7–9 time segments of stable map topography per condition. The whole data set was explained by a total of 15 template maps. The result of fitting these maps to individual VEPs are summarized in Table 1. The statistical analysis revealed that one of these 15 maps was better explained in two as compared with all other conditions and was found to be specific to motion conditions in general, i.e. to stimuli 1 and 2 (map M). Seven maps were significantly better explained in one condition as compared with all other conditions. Two of these seven maps were specific for moving tritan stimulation (maps M-T1 and M-T2), one for moving black and white stimulation (map M-BW2), two for stationary tritan stimulation (maps T1 and T2) and two for stationary black and white stimulation (maps BW1 and BW2). The periods in which the condition-specific maps occurred in the grand-mean VEPs are marked in gray in Figure 1. The figure shows that there are two periods in which condition-specific maps appear, one early and one late, separated by an intervening period during which electrical field patterns are relatively invariant across conditions. Only the eight field patterns that are likely to ref lect condition-specific cortical activity were further analyzed (M, M-T1, M-T2, M-BW2, T1, T2, BW1, BW2). The remaining seven non-specific maps were not considered, since they most probably represent cortical response patterns associated with visual stimulation in general. The fitting procedure confirms that the specific responses are grouped in early and late periods with respect to their occurrence in time. The early condition-specific maps all occurred. Cerebral Cortex Aug 2000, V 10 N 8 819.
(4) Figure 1. Grand-mean evoked potential map series (mean over 17 subjects) for the four stimulation conditions [from top to bottom: tritan motion, luminance (black and white) motion, tritan stationary, luminance (black and white) stationary]. Maps are shown in 8 ms steps for illustration purposes (original sampling: 1000 Hz). They are shown from a top view with left ear left, nose top. Black areas represent regions of negative potential with respect to the average reference; white areas are positive. The bars under the map series indicate the borders of the segments that were found with the spatio-temporal segmentation procedures, i.e. the time points where field configuration changes occurred. Statistical analysis of the individual VEPs revealed that there were stimulation-specific segments with electric field maps unique for the given condition. These specific segments are marked in gray and labeled by letters [M-T, motion tritan; M-BW, motion black and white; M, motion; T, (stationary) tritan; BW, (stationary) black and white] and numbers (1 and 2 for early and late segments respectively). Note that two periods of specific maps were found in three of the four conditions and that the early period starts at ∼40–50 ms. Note also that the motion-specific early segment (M) appears in both the tritan- and luminance-motion conditions and that motion coded by tritan stimuli evokes a specific map even earlier than the two other conditions (M-T1).. between 40 and 75 ms after stimulus onset [M-T1, 40 ± 31 ms; M(BW), 56 ± 32 ms; M(tritan), 59 ± 34 ms; T1, 73 ± 28 ms]. They were found for all except the stationary black and white conditions. The mean values suggest that early maps of the tritan motion condition (M-T1) appear first, followed by the motionspecific map (M) found in both motion conditions, and that the stationary tritan-specific map (T1) appears last. Statistical analysis using Friedman A NOVAs and subsequent Wilcoxon matched-pairs tests on the time point of best fit showed that M-T1 appeared significantly earlier than T1 [Wilcoxon (n = 17): P = 0.011], and also earlier than map M of the tritan-motion condition [Wilcoxon (n = 17): P = 0.009]. All condition-specific late maps occurred between 175 and 240 ms after stimulus onset (M-T2, 178 ± 39 ms; BW1, 194 ± 39 ms; M, 203 ± 41 ms; M-BW2, 207 ± 24 ms; BW2, 218 ± 29 ms; T2, 239 ± 37 ms). Again, M-T2 of the tritan-motion condition appeared significantly earlier than T2 of the stationary tritan [Wilcoxon (n = 17): P = 0.0004) and M-BW2 of the motion luminance condition [Wilcoxon (n = 17): P = 0.046). Furthermore,. 820 Human Cortical Responses to Moving S-cone Stimuli • Morand et al.. T2 occurred significantly later than all late maps of the other conditions [Wilcoxon (n = 17): BW1, P = 0.0019; M-BW2, P = 0.009; M, P = 0.006; M-T2, P = 0.0004). The source localization procedure revealed strongest activity in bilateral occipital areas of the deepest slice in all four conditions (see Fig. 2, 1st slices). Weaker sources were found in more superior occipital slices bilaterally (slices 2–3). The predominant activation patterns of the deepest slices were generally similar for most of the maps and included simultaneous mesial and lateral sources (maps M-T1, M-T2, M, T1, T2, BW1, BW2), except for map M-BW2, which was associated solely with lateral activity. The similarity of source locations was strongest for early and late maps of the same condition. The present method does not allow more precise localization than the differentiation of mesial and lateral activity due to limitations in the model (spherical head model instead of real head shape) and its incompatibility with a common reference system (e.g. Talairach). This might be the reason why the topography of activity generally appears to be similar across maps, even if there is no doubt that.
(5) Table 1 Goodness of fit of the eight condition-specific maps in the individual VEPs expressed in % explained variance (mean ± SD) as determined by ERP fitting Conditions/stimuli. Specific maps M. M-T1. M-T2. M-BW2. T1. T2. BW1. BW2. (i) Motion tritan (ii) Motion B&W (iii) Stationary tritan (iv) Stationary B&W. 8.02 ± 8.96** 6.58 ± 6.41** 0.59 ± 1.18 1.28 ± 2.29. 9.21 ± 7.59** 4.49 ± 5.14 1.25 ± 2.53 2.49 ± 3.83. 8.02 ± 6.45* 4.11 ± 4.39 0.62 ± 0.83 2.53 ± 4.67. 4.23 ± 4.89 12.23 ± 10.17** 2.36 ± 3.52 2.32 ± 3.96. 0.35 ± 3.13 2.84 ± 4.71 7.31 ± 6.63* 1.30 ± 2.35. 1.38 ± 2.25 1.94 ± 2.90 9.77 ± 8.69** 2.14 ± 3.05. 1.17 ± 1.70 1.90 ± 3.04 1.61 ± 2.61 6.03 ± 6.00*. 2.72 ± 4.80 2.29 ± 3.09 6.31 ± 5.77 15.01 ± 9.88**. One map (M) was especially present in the two motion conditions (tritan and luminance) with a significantly higher % explained variance, highlighted in bold, as compared with the stationary conditions. Seven maps (M-T1, M-T2, M-BW2, T1, T2, BW1, BW2) were particularly present in one condition only and significantly explained more of the variance in this condition than in all other conditions (Wilcoxon matched pairs tests). Asterisks represent the least significant P values of the tests performed (*P < 0.05, **P < 0.01).. the different surface potential maps must have been produced by different generators in the brain (Lehmann, 1987).. Discussion The present ERP study investigated the cerebral mechanisms of visual processing under motion conditions when the information is relayed through S-cones (K pathway) in humans, with an emphasis on timing. Using current ERP mapping techniques, we searched for electrical responses unique to tritan motion and to motion conditions in general (motion-specific maps). These electrical responses are likely to ref lect condition-specific information processing. Note that in our case, condition-specific ‘motion’ processes do not necessarily ref lect directional mechanisms but may also ref lect mechanisms that respond to temporal modulation of the moving stimuli. In the following, we will thus refer to these processes as motion-sensitive rather than motion-selective. The following main findings can be summarized: firstly, some of the cortical electrical responses evoked by moving tritan stimuli are not present in the luminance motion condition while others are. Secondly, the electrical responses that are specific to the tritan motion conditions show the shortest latencies, i.e. they precede the time periods where tritan and luminance motion-sensitive processing share common cortical substrates. Thirdly, all stimuli (static and moving) evoked biphasic responses, with one period occurring at very early latencies of between 40 and 75 ms and a later period between 175 and 240 ms. These points will be discussed below. Tritan and Luminance Motion-sensitive Processing Share Some Common Cortical Substrates Psychophysical studies demonstrated that S-cones contribute to motion processing for stimuli moving at high temporal frequencies (Lee and Stromeyer, 1989; Cavanagh and Anstis, 1991; Gegenfurtner and Hawken, 1995; Dougherty et al., 1999). Some of these experiments furthermore suggest that motion of S-cone isolating and luminance-defined stimuli are analyzed by the same mechanisms in the brain (Lee and Stromeyer, 1989; Cavanagh and Anstis, 1991; Dougherty et al., 1999). In line with these results, our data revealed similar cortical responses to tritan (K pathway) motion and luminance (M pathway) motion in the latency range between 50 and 90 ms (map M in Fig. 1). This suggests that motion-sensitive processing via K- and M input share common cortical substrates at this time period, at least at the stimulation velocity exploited in the present study. Even if no direct realistic head models were used in this study and no attempts were made to match the solution with magnetic resonance images, the solution on the spherical slices strongly suggests activation of extrastriate cortical areas in this early time period. MT/V5 is the most likely candidate for activation by both. types of stimuli, since this area responds to isoluminant color motion and to luminance motion both in monkeys (Charles and Logothetis, 1989; Saito et al., 1989; Dobkins and Albright, 1994; Seidemann et al., 1999; Thiele et al., 1999) and in man (Wandell et al., 1999), and since MT/V5 cellular and psychophysical sensitivities for isoluminant stimuli match at high temporal frequencies (Gegenfurtner et al., 1994). This also fits well with the notion that there is a mechanism for fast luminance-defined motion processing via MT/V5, which is also sensitive to isoluminant stimuli, both red–green and blue–yellow (Gegenfurtner and Hawken, 1995, 1996). Activation of area MT/V5 at this early time period by fast motion stimuli is supported by other functional imaging studies (Buchner et al., 1997; Ffytche et al., 1995). Tritan-motion-specific Maps at Very Early Time Periods Besides the common motion-specific maps, our data also revealed electrical fields that were specific to the tritan-motion condition and that preceded the common motion maps (maps M-T1 and M-T2 in Fig. 1). In fact, the tritan-motion stimuli were the first to evoke unique electric responses, starting at ∼40 ms. At first glance, this finding seems surprising, since cortical responses to ‘M pathway’ stimuli would be expected to appear earliest: the M system is significantly faster than the P system (Maunsell and Gibson, 1992; Nowak et al., 1995; Schmoleski et al., 1998), the thick stripes and interstripes in V2 (carrying motion information) are activated faster than the thin stripes carrying color information (Munck et al., 1995), and area MT/V5 has the shortest response latencies and receives signals before V4 (Raiguel et al., 1989; Buchner et al., 1997; Ffytche et al., 1995). Since the response properties of K cells resemble more closely those of P- than of M cells (Casagrande, 1999; Solomon et al., 1999), one would expect cortical responses to ‘K pathway’ stimuli to appear later than those to ‘M pathway’ stimuli. Interestingly, our stationary conditions show results consistent with this expectation with tritan-specific electrical fields appearing significantly later than luminance-specific fields, at least for the later time period. Thus, the short latencies of responses to tritan stimuli seem to apply only to motion conditions and do not seem due to general properties of the pathway (e.g. hard-wired conductivity latencies). One explanation for the early tritan-motion-specific maps might be given by the findings of Moutoussis and Zeki (Moutoussis and Zeki, 1997a,b), who reported that color is perceived faster than motion when both types of information are presented simultaneously. In view of this finding, our early tritan-motion-specific maps may ref lect the processing of the tritan-color information alone which would indicate that, in our combined color-motion condition, color is processed before. Cerebral Cortex Aug 2000, V 10 N 8 821.
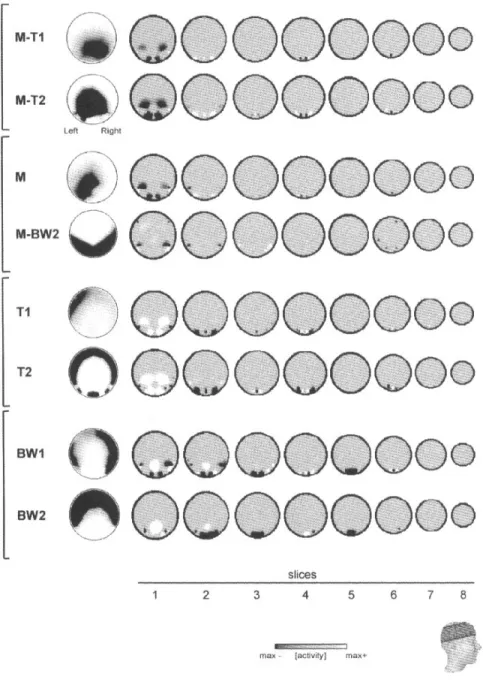
(6) Figure 2. Surface electric field maps (left) and estimated 3-D potential distributions for the mean maps of the segments that were specific for the different stimulation conditions [M-T, motion tritan; M-BW, motion luminance; M, motion in general; T, (stationary) tritan; BW, (stationary) black and white]. The 3-D potential distributions (using the ELECTRA algorithm) are shown on horizontal slices through the brain at different levels (see inset). The first slice corresponds to the T3–T4–Oz plane. Black spots represent positive potential, white spots negative potentials. Note the simultaneous activity in striate and lateral extrastriate areas for early as well as late maps in most of the conditions.. motion. Thus, our data could be interpreted as physiological evidence for the psychophysical findings of Moutoussis and Zeki. However, the color stimuli of our study were designed to specifically activate the K pathway, not the P pathway as in Moutoussis and Zeki’s work (Moutoussis and Zeki, 1997a,b), and it is not yet clear which cortical system can carry K pathway information besides MT/V5 (Seidemann et al., 1999; Wandell et al., 1999). Casagrande (Casagrande, 1994, 1999) as well as Hendry and Reid (Hendry and Reid, 2000) pointed out that the K pathway receives substantial projections not only from the retina but also indirectly from superficial collicular cells, as well as feedback projections from striate and extrastriate areas, thus. 822 Human Cortical Responses to Moving S-cone Stimuli • Morand et al.. forming a subcortico-cortical loop with a possible neuromodulatory function. In view of this suggestion, our early tritan-motion responses might ref lect a visual signal modulating information processing in later stages. The early responses in the tritanmotion condition certainly have the right temporal properties to fulfill such a neuromodulatory function, given that they always appear earlier than the motion-specific responses — in both the early and late time periods. This second interpretation of our results would imply that a separate cortical system with separate functional properties exists for information relayed by the K pathway. Further studies are needed to support the claim of a third visual subcortico-cortical information processing stream..
(7) Two Periods of Visual Information Processing We found electrical responses specific to tritan and motion stimulation in two distinct time periods, an early period occurring before the strong P100 component and a late period at ∼200 ms. Electrical responses at the early stages were associated with simultaneous activity in striate and extrastriate cortex. This topography of activity reappeared in a similar way in the second time period. The temporal appearance of our early stimulus-specific field patterns and its association with extrastriate activity is not surprising given the vast amount of recent literature on rapid visual processing pathways. Since single-cell studies in primates show significant activation of the striate cortex already at ∼20–30 ms post-stimulus (Maunsell and Gibson, 1992; Nowak et al., 1995; Knierim and Van Essen, 1992), sufficient time remains to pass the information along the cortical processing stream up to the higher-order visual areas. In addition, many studies have shown that neurons in higher-order visual areas respond as fast as or even faster than neurons in primary visual areas (Raiguel et al., 1989; Dinse and Krüger, 1994; Ffytche et al., 1995; Nowak and Bullier, 1997). With respect to the temporally separated processing periods, confirmation is found in the literature on transcranial magnetic stimulation (TMS), which produces a transient disruption of activity in a relatively circumscribed brain region. A recent study by Corthout and co-workers (Corthout et al., 1999) found two distinct time periods during which visual processing was disturbed by TMS over circumstriate visual cortex. By arguing that TMS interferes with the cortical processing itself rather than with the arrival of signals in the given area, they concluded that the early processing period is completed ∼50 ms post-stimulus and the second period at ∼200 ms. Disruption of visual motion processing by TMS was also described within an early time period by Beckers and Zeki (Beckers and Zeki, 1995) and within a late time period, i.e. in the 200 ms time range, by Hotson and Anand (Hotson and Anand, 1999). In both studies, the TMS coil was located over MT/V5, which directly supports our finding of lateral extrastriate activity in the motion condition in both time periods. If the early period does not ref lect mainly striate and the late period extrastriate activation, which would be expected from feed-forward transmission, what then are the mechanisms underlying the biphasic time course of activation? Based on their TMS results, Beckers and Zeki (Beckers and Zeki, 1995) and Hotson and Anand (Hotson and Anand, 1999) proposed that fast subcortical motion input directly reaching MT/V5 and bypassing V1 gives rise to the early period of motion processing. This is consistent with anatomical evidence for direct thalamic projections to higher visual areas (Fries, 1981) and clinical evidence for motion signals reaching MT/V5 without passing through V1 (Barbur et al., 1993). Note also that K neurons exist that inner vate extrastriate cortex directly [for a review see (Hendry and Reid, 2000)]. Whatever the activation pathway is, the results of the inverse solution confirm the interpretation that these early condition-specific responses ref lect activation of extrastriate areas. The lack of condition-specific, early responses in the stationary luminance condition does not, of course, mean that these stimuli did not activate the visual cortex at early time points; it only shows that they did not activate unique areas that were not activated by the other conditions. The early electric fields in the stationary luminance condition were indeed also found in the other conditions (map nos 5 and 8 in Fig. 1). The second time period of information processing, on the other hand, has been proposed to ref lect a slow input to higher-order. visual areas passing through the striate cortex (Beckers and Zeki, 1995; Hotson and Anand, 1999). Corthout and co-workers (Corthout et al., 1999), in contrast, interpreted the second stage of information processing on the basis of previous cellular recordings (Raiguel et al., 1989; Celebrini et al., 1993). They postulated that long latency responses observed in striate and extrastriate areas may represent a sort of re-entrant loop based on feedback from other regions, allowing a continual comparison of new input against previously received and processed data. Our finding that the topography of activity observed in early stages reappears in the second time period indirectly supports this notion. This would be expected if reentrant loops are involved. The simultaneous activity in striate and extrastriate areas that we observed in both time periods may be interpreted in the frame of neural network models. There is increasing evidence that the timing of activation of the different visual areas and the temporal and functional interaction between them play a crucial role in stimulus encoding (Salin and Bullier, 1995; Nowak and Bullier, 1997; Giese, 1999). A comprehensive review by Nowak and Bullier (Nowak and Bullier, 1997) demonstrates in detail the large number of studies that provide evidence for the fast bi-directional f low of information between the different cortical and subcortical areas of the visual system. Such findings allowed Mesulam (Mesulam, 1998) to propose a complex neurocognitive network model in which each node is ‘continually passing on information to the others rather than fulfilling its part of the processing and then transmitting a completed product to the next station’. Our finding of simultaneous activity in striate and extrastriate cortex is in line with this view.. Notes This work was supported by the Swiss National Science Foundation (grant no. 4038-044081) and the ‘programme commun de recherche en génie biomédical 1999–2002’. We thank Denis Brunet for creating the stimulation program and for helping us with the computer programs, and Dr Jean-Jacques Meyer and David Francioli from the Institut de Santé au Travail (Lausanne) for their help with spectral-sensitivity measurements. Address correspondence to Dr Christoph Michel, Functional Brain Mapping Laboratory, Department of Neurology, University Hospital Geneva, 24, rue Micheli du Crest, CH-1211 Geneva 14, Switzerland. Email: [email protected].. References Barbur JL, Watson JD, Frackowiak RS, Zeki S (1993) Concious visual perception without V1. Brain 116:1293–1302. Beckers G, Zeki (1995) The consequences of inactivating areas V1 and V5 on visual motion perception. Brain 118:49–60. Brandeis D, Naylor H, Halliday R, Callaway E, Yano L (1992) Scopolamine effects on visual information processing, attention and event-related potential map latencies. Psychophysiology 29:315–336. Buchner H, Gobbele R, Wagner M, Fuchs M, Waberski TD, Beckmann R (1997) Fast visual evoked potential input into human area V5. NeuroReport 8:2419–2422. Calkins DJ (2000) The representation of cone signals in the primate retina. J Opt Soc Am B 17:597–606. Casagrande VA (1994) A third parallel visual pathway to primate area V1. Trends Neurosci 17:305–310. Casagrande VA (1999) The mystery of the visual system K pathway. J Physiol (Lond) 517:630. Cavanagh P (1991) Vision at equiluminance In: Vision and visual dysfunction: limits of vision (Kulikowski JJ, Murray JJ, Walsh V, eds), vol. V, pp. 234–250. Boca Raton, FL: CRC Press. Cavanagh P, Anstis S (1991) The contribution of color to motion in normal and color-deficient observers. Vision Res 31:2109–2148. Cavanagh P, Favreau OE (1985) Color and luminance share a common motion pathway. Vision Res 25:1595–1601.. Cerebral Cortex Aug 2000, V 10 N 8 823.
(8) Cavanagh P, Tyler CV, Favreau OE (1984) Perceived velocity of moving chromatic gratings. J Opt Soc Am 1:893–899. Cavanagh P, Adelson EH, Heard P (1992) Vision with equiluminant colour contrast: 2. A large scale technique and observations. Perception 21: 219–226. Cavanagh P, Hénaff M-A, Michel F, Landis T, Troscianko T, Intriligator J (1998) Complete sparing of high-contrast colour input to motion perception in cortical colour blindness. Nature Neurosci 1:242–247. Celebrini S, Thorpe S, Trotter Y, Imbert M (1993) Dynamics of orientation coding in area V1 of the awake primate. Vis Neurosci 10:811–825. Charles ER, Logothetis NK (1989) The responses of middle temporal (MT) neurons to isoluminant stimuli. Invest Ophthalmol Vis Sci 30:427. Clarke S (1994) Modular organisation of human extrastriate visual cortex: evidence from cytochrome oxidase pattern in normal and macular degeneration cases. Eur J Neurosci 6:725–736. Clarke S, Riahi-Arya S, Tardif E, Cottier Eskanasy A-C, Probst A (1999) Thalamic projections of the fusiform gyrus in man. Eur J Neurosci 11:1835–1838. Corbetta M, Miezin FM, Bobmeyer S, Shulman GL, Petersen SE (1991) Selective and divided attention during visual discriminations of shape, color and speed: functional anatomy by positron emission tomography. J Neurosci 11:2382–2402. Corthout E, Uttl B, Ziemann U, Cowey A, Hallett M (1999) Two periods of processing in the (circum)striate visual cortex as revealed by transcranial magnetic stimulation. Neuropsychologia 37:137–145. Croner LJ, Albright TD (1999) Segmentation by color inf luences responses of motion-sensitive neurons in the cortical middles temporal visual area. J Neurosci 19: 3935–3951. Cropper SJ, Derrington AM (1996) Rapid colour-specific detection of motion in human vision. Nature 379:72–74. Dacey DM (1996) Circuitry for color coding in the primate retina. Proc Natl Acad Sci USA 93:582–588. Derrington A M, Henning GB (1993) Detecting and discriminating the direction of motion of luminance and colour gratings. Vision Res 33:799–811. Derrington A M, Krauskopf J, Lennie P (1984) Chromatic mechanisms lateral geniculate nucleus of macaque. J Physiol 357:241–265. Dinse HR, Krüger K (1994) The timing of processing along the visual pathway in the cat. NeuroReport 5:893–897. Dobkins KR (2000) Moving colors in the lime light. Neuron 25:15–18. Dobkins KR, Albright TD (1994) What happens if it changes colour when it moves? The nature of chromatic input to macaque visual area MT. J Neurosci 14:4854–4870. Dobkins KR, Albright TD (1998) The inf luence of chromatic information on visual motion processing in the primate visual system. In: Higher level motion processing — computational, neurobiological, psychophysical perspectives (Watanabe T, ed.), pp. 53–98. Boston, MA: MIT. Dobkins KR, Stoner GR, Albright TD (1998) Perceptual, oculomotor, and neural responses to moving color plaids. Perception 27:681–709. Dougherty RF, Press WA, Wandell BA (1999) Perceived speed of colored stimuli. Neuron 24:893–899. Felleman DJ, Van Essen DC (1991) Distributed hierarchical processing in the primate cerebral cortex. Cereb Cortex 1:1–47. Ferrera V P, Nealey TA, Maunsell JH (1992) Mixed parvocellular and magnocellular geniculate signals in visual area V4. Nature 358: 756–761. Ferrera VP, Nealey TA, Maunsell JH (1994a) Responses in macaque visual area V4 following inactivation of the parvocellular and magnocellular LGN pathways. J Neurosci 14:2080–2088. Ferrera V P, Rudolph KK, Maunsell JH (1994b) Responses of neurons in the parietal and temporal visual pathways during a motion task. J Neurosci 14:6171–6186. Ffytche DH, Guy CN, Zeki S (1995) The parallel visual motion inputs into areas V1 and V5 of human cerebral cortex. Brain 118:1375–1394. Fries W (1981) The projection from the lateral geniculate nucleus to the prestriate cortex of the macaque monkey. Proc R Soc Lond B Biol Sci 213:73–86. Fuchs M, Wagner M, Koehler T, Wischmann H-A (1999) Linear and nonlinear current density reconstructions. J Clin Neurophysiol 16: 267–295. Gegenfurtner KR, Hawken MJ (1995) Temporal and chromatic properties of motion mecanisms. Vision Res 35:1547–1563. Gegenfurtner KR, Hawken MJ (1996) Interaction of motion and color in the visual pathways. Trends Neurosci 19:394–401. Gegenfurtner KR, Kiper DC, Beusmans JMH, Caradini M, Zaidi Q,. 824 Human Cortical Responses to Moving S-cone Stimuli • Morand et al.. Movshon JA (1994) Chromatic properties of neurons in macaque MT. Vis Neurosci 11:455–466. George JS, Aine CJ, Mosher C, Schmidt DM, Ranken DM, Schlitt HA, Wood CC, Lewine JD, Sanders JA, Belliveau JW (1995) Mapping function in the human brain with magnetoencephalography, anatomical magnetic resonance imaging, and functional magnetic resonance imaging. J Clin Neurophysiol 12:406–431. Giese MA (1999) Evidence for multi-functional interactions in early visual processing. Trends Neurosci 22:287–290. Grave de Peralta Menendez R, Gonzalez Andino SL (1998) Distributed source models: standard solutions and new developments. In: Analysis of neurophysiological brain functioning (Uhl C, ed.), pp. 176–201. Heidelberg: Springer Verlag. Grave de Peralta R, Gonzalez SL, Morand S, Michel CM, Landis T (2000) Imaging the electrical activity of the brain: ELECTR A. Human Brain Map 9:1–12. Grüsser OJ, Landis T (1991) Visual agnosias and other disturbances of visual perception and cognition. In: Vision and visual dysfunction (Cronly-Dillon JR, ed.), vol. 12. London: Macmillan Press. Guylas B, Heywood CA, Popplewell DA, Roland PE, Cowey A (1994) Visual form discrimination from color and motion cues. Functional anatomy by positron emission tomography. Proc Natl Acad Sci USA 91:9965–9969. Hendr y SHC, Reid RC (2000) The koniocellular pathway in primate vision. Annu Rev Neurosci 23:127–153. Hotson JR, Anand S (1999) The selectivity and timing of motion processing in human temporo-parieto-occipital and occipital cortex: a transcranial magnetic stimulation study. Neuropsychologia 37: 169–179. Kaiser PK, Lee BB, Martin PR, Valberg A (1990) The physiological basis of the minimally distinct border demonstrated in the ganglion cells of the macaque retina. J Physiol (Lond) 422:153–183. Khateb A, Annoni JM, Landis T, Pegna AJ, Custodi M-C, Fonteneau E, Morand SM, Michel CM (1999) Spatio-temporal analysis of electric brain activity during semantic and phonological word processing. Int J Psychophysiol 32:215–231. Klug K, Tiv N, Tsukamoto Y, Sterling P, Schein SJ (1992) Blue cones contact OFF-midget bipolar cells. Soc Neurosci Abstr 18:838. Knierim JJ, Van Essen DC (1992) Neuronal responses to static texture patterns in area V1 of the alert macaque monkey. J Neurophysiol 67: 961–980. Lee BB, Martin PR, Valberg A (1988) The physiological basis of heterochromatic f licker photometry demonstrated in the ganglion cells of the macaque retina. J Physiol (Lond) 404:323–347. Lee BB, Martin PR, Valberg A (1989a) Non linear summation of Mand L-cone inputs to phasic retinal ganglion cells of the macaque. J Neurosci 9:1433–1442. Lee BB, Martin PR, Valberg A (1989b) Sensitivity of macaque retinal ganglion cells to chromatic and luminance f licker. J Physiol (Lond) 414:223–243. Lee J, Stromeyer CF III (1989) Contribution of human short-wave cones to luminance and motion detection. J Physiol (Lond) 413:563–593. Lehmann D, Skrandies W (1980) Reference-free identification of components of checkerboards-evoked multichannel potential fields. Electroencephalogr Clin Neurophysiol 48:609–621. Lehmann D (1987) Principles of spatial analysis. In Handbook of electroencephalography and clinical neurophysiology (Gevins AS, Rémond A, eds), vol. 1, pp. 309–354. Amsterdam: Elsevier. Logothetis NK, Schiller PH, Charles ER, Hurlbert AC (1990) Perceptual deficits and the activity of the color-opponent and broad-band pathways at isoluminance. Science 247:214–217. Lueck CJ, Zeki S, Friston KJ, Deiber MP, Cope P, Cunningham VJ, Lammertsma A A, Kennard C, Frackowiak RS (1989) The colour centre in the cerebral cortex of man. Nature 340:386–389. Martin PR, White AJ, Goodchild A K, Wilder HD, Sefton AE (1997) Evidence that blue-on cells are part of the third geniculocortical pathway in primates. Eur J Neurosci 9:1536–1541. Maunsell JH, Nealey TA, DePriest DD (1990) Magnocellular and parvocellular contributions to responses in the middle temporal visual area (MT) of the macaque monkey J Neurosci 10:3323–3334. Maunsell JHR, Gibson J (1992) Visual response latencies in the striate cortex of the macaque monkey. J Neurophysiol 68:1332–1343. Merigan WH, Maunsell JHR (1993) How parallel are the primate visual pathways? Annu Rev Neurosci 16:369–402. Mesulam MM (1998) From sensation to cognition. Brain 121:1013–1052..
(9) Michel CM, Seeck M, Landis T (1999a) Spatio-temporal dynamics of human cognition. News Physiol Sci 14:206–214. Michel CM, Grave de Peralta R, Lantz G, Gonzalez Andino S, Spinelli L, Blanke O, Landis T, Seeck M (1999b) Spatio-temporal EEG analysis and distributed source estimation in presurgical epilepsy evaluation. J Clin Neurophysiol 16:239–266. Moutoussis K, Zeki S (1997a) A direct demonstration of perceptual asynchrony in vision. Proc R Soc Lond B Biol Sci 264:393–399. Moutoussis K, Zeki S (1997b) Functional segregation and temporal hierarchy of the visual perceptive systems. Proc R Soc Lond B Biol Sci 264:1407–1414. Mullen KT, Baker CL (1985) A motion aftereffect from an isoluminant stimulus. Vision Res 25:685–688. Munck MHJ, Nowak LG, Girard P, Chounlamountri N, Bullier J (1995) Visual latencies in cytochrome oxidase bands of macaque area V2. Proc Natl Acad Sci USA 92:988–992. Nowak LG, Bullier J (1997) The timing of information transfer in the visual system. In: Cerebral cortex, vol. 12. Extrastriate cortex in primates (Rockland KS, Kaas JH, Peters A, eds), pp. 205–241. New York: Plenum Press. Nowak LG, Munk M, Girard P, Bullier J (1995) Visual latencies in areas V1 and V2 of the macaque monkey. Vis Neurosci 12:371–384. Oldfield RC (1971) The assessment and analysis of handedness: the Edinburgh Inventory. Neuropsychologia 9:97–113. Pascual-Marqui RD, Michel CM, Lehmann D (1995) Segmentation of brain electrical activity into microstates: model estimation and validation. IEEE Trans Biomed Engng 42:658–665. Pegna AJ, Khateb A, Spinelli L, Seeck M, Landis T, Michel CM (1997) Unraveling the cerebral dynamics of mental imagery. Human Brain Map 5:410–421. Probst T, Plendl H, Paulus W, Wist ER, Scherg M (1993) Identification of the visual motion area (area V5) in the human brain by dipole source analysis. Exp Brain Res 93:345–351. Raiguel SE, Lagae L, Gulyas B, Orban GA (1989) Response latencies of visual cells in macaque areas V1, V2 and V5. Brain Res 493:155–159. Ramachandran VS, Gregory RL (1978) Does color provide an input to human motion perception? Nature 275:55–56. Reid RC, Alonso J-M, Hendry SHC (1997) S-cone input is relayed to visual cortex from two koniocellular layers of macaque. Soc Neurosci Abstr 23:13. Saito H, Tanaka K, Isono H, Yasuda M, Mikami A (1989) Directionally selective response of cells in the middle temporal area (MT) of the macaque monkey to the movement of equiluminous opponent color stimuli. Exp Brain Res 75:1–14. Salin P-A, Bullier J (1995) Corticocortical connections in the visual system: structure and function. Physiol Rev 75:107–154. Schmoleski MT, Wang Y, Hanes DP, Thompson KG, Leutgeb S, Schall JD, Leventhal AG (1998) Signal timing across the macaque visual system. J Neurophysiol 79:3272–3278.. Seidemann E, Poirson AB, Wandell BA, Newsome WT (1999) Color signals in area MT of the macaque monkey. Neuron 24:911–917. Solomon SG, White AJ, Martin PR (1999) Temporal contrast sensitivity in the lateral geniculate nucleus of a New World monkey, the marmoset Callithrix jacchus. J Physiol (Lond) 517:907–917. Smith VC, Pokorny J (1972) Spectral sensitivity of color-blind observers and the cone photopigments. Vision Res 12:2059–2071. Smith VC, Pokorny J (1975) Spectral sensitivity of the foveal cone photopigments between 400 and 500 nm. Vision Res 15:161–171. Stromeyer CF III, Kronauer RE, Ryu A, Chaparro A, Eskew JRT (1995) Contributions of human long-wave and middle-wave cones to motion detection. J Physiol (Lond) 485:221–243. Teller DY, Lindsey DT (1993) Motion at isoluminance: motion dead zones in three-dimensional color space. J Opt Soc Am 10:1324–1331. Thiele A, Dobkins KR, Albright TD (1999) The contribution of color to motion processing in macaque middle temporal area. J Neurosci 19: 6571–6587. Thut G, Hauert C-A, Morand S, Seeck M, Landis T, Michel CM (1999) Evidence for interhemispheric motor-level transfer in a simple reaction time task: an EEG study. Exp Brain Res 128:256–261. Thut G, Hauert C-A, Viviani P, Morand S, Spinelli L, Blanke O, Landis T, Michel CM (2000) Internally-driven versus externally-cued movement selection: a study on the timing of brain activity. Cogn Brain Res 9: 261–269. Tootell RB, Reppas JB, Kwong KK, Malach R, Born RT, Brady TJ, Rosen BR, Belliveau JW (1995) Functional analysis of human MT and related visual cortical areas using magnetic resonance imaging. J Neurosci 15:3215–3230. Troscianko T, Davidoff J, Humphreys G, Landis T, Fahle M, Greenlee M, Brugger P, Phillips W (1996) Human colour discrimination on a nonparvocellular pathway. Curr Biol 6:200–210. Valberg A, Lee BB, Kaiser PK, Kremers J (1992) Responses of macaque ganglion cells to movement of chromatic borders. J Physiol (Lond) 458:579–602. Van Essen DC (1985) Functional organization of primate visual cortex. In: Cerebral cortex (Peters A, Jones EG, eds), vol. 3, pp. 259–329. New York: Plenum. Wandell BA, Poirson AB, Newsome WT, Baseler HA, Boynton GM, Huk A, Gandhi S, Sharpe LT (1999) Color signals in human motion-selective cortex. Neuron 24:901–909. White AJ, Wilder HD, Goodchild A K, Sefton AJ, Martin PR (1998) Segregation of receptive field properties in the lateral geniculate nucleus of a New-World monkey, the marmoset Callithrix jacchus. J Neurophysiol 80:2063–2076. Woody CD (1967) Caracterization of an adaptative filter for the analysis of variable latency neuroelectric signals. Med Biol Engng 5:539–553. Zeki S. A century of cerebral achromatopsia (1990). Brain 113:1721–1777. Zihl J, Von Cramon D, Mai N (1983) Selective disturbance of movement after bilateral brain damage. Brain 106:313–340.. Cerebral Cortex Aug 2000, V 10 N 8 825.
(10)
Figure
Documents relatifs