1University of Lausanne, Lausanne, Switzerland 2University of Johannesburg, Johannesburg, South Africa
Corresponding Author:
Christina Györkös, University of Lausanne, Institute of psychology, Quartier UNIL-Mouline, Bâtiment Géopolis, CH-1015 Lausanne, Switzerland
Email: christina.gyorkos@unil.ch
Jérôme Rossier, University of Lausanne, Institute of psychology, Quartier UNIL-Mouline, Bâtiment Géopolis, CH-1015 Lausanne, Switzerland
Email: jerome.rossier@unil.ch
Comparing the Horizontal and
Vertical Individualism and Collectivism
Scale and the Auckland Individualism
and Collectivism Scale in Two
Cultures: Switzerland and South Africa
Christina Györkös
1, Jürgen Becker
2,
Koorosh Massoudi
1, Jean-Philippe Antonietti
1,
Cornelia Pocnet
1, Gideon P. de Bruin
2,
and Jérôme Rossier
1Abstract
This study investigated the psychometric properties of the Horizontal and Vertical Individualism and Collectivism Scale (HVIC) and the Auckland Individualism and Collectivism Scale (AICS). The sample consisted of 1,403 working individuals from Switzerland (N = 585) and from South Africa (N = 818). Principal component factor analyses indicated that a two-factor struc-ture replicated well across the two countries for both scales. In addition,
the HVIC four-factor structure replicated well across countries, whereas the responsibility dimension of individualism of the AICS replicated poorly. Confirmatory factor analyses provided satisfactory support to the original theoretical models for both the HVIC and the AICS. Equivalence measure-ment indices indicated that the cross-cultural replicability properties of both instruments are generally acceptable. However, canonical correlations and correlations between the HVIC and AICS dimensions confirm that these two instruments differ in their underlying meaning of the individualism and collectivism constructs, suggesting that these two instruments assess indi-vidualism and collectivism differently.
Keywords
culture assessment, Horizontal and Vertical Collectivism and Individualism Scale, Auckland Individualism and Collectivism Scale, cross-language replicability, psychometric study
In general, individualism, as opposed to collectivism, is defined as an indi-vidual’s tendency to value personal goals rather than one’s in-group goals (Triandis & Gelfand, 1998). Since Hofstede’s (1981) introduction of the indi-vidualism measure, the study of cultural differences has generated growing empirical interests. Several instruments were developed from then on to assess individualism and collectivism (e.g., Hui, 1988; Shulruf, Hattie, & Dixon, 2007; Triandis & Gelfand, 1998). However, the measures of individu-alism and collectivism have been subjected to theoretical and measure con-troversies and ambiguity around the matter still remains. For instance, whether individualism is a one-dimensional construct and collectivism the implicit opposite, as suggested by Hofstede, is still not a matter of consensus. In fact, various authors stipulate that individualism and collectivism are best represented as “separate constructs with multiple dimensions” (Li & Aksoy, 2007, p. 320; Shulruf et al., 2007; Triandis, 1995). Furthermore, whether individualism and collectivism is best operationalized as an orthogonal or a two-dimensional concept with underlying subscales is still not clear. The main objective of this study was to examine the psychometric properties of two individualism and collectivism measures. Specifically, we investigated the orthogonal structure of the Horizontal and Vertical Individualism and Collectivism Scale (HVIC; Triandis & Gelfand, 1998) and the more recent two-dimensional structure of the Auckland Individualism and Collectivism Scale (AICS) containing five subscales (Shulruf et al., 2007) in Switzerland
and in South Africa. One central difference between these two instruments concerns the conceptual foundations on which they were built. Whereas the HVIC was designed with a theory-based approach, the AICS was designed using an empirical-based approach. Indeed, Triandis and Gelfand (1998) empirically tested the idea that a distinction between individualism and col-lectivism was necessary to expand the construct into a four-attribute con-struct. In a different vein, Shulruf and colleagues (2007) developed the AICS based on five main dimensions that emerged from a meta-analysis of 253 studies examining either solely individualism and collectivism or their psy-chological outcomes (Oyserman, Coon, & Kemmelmeier, 2002). Hence, a second objective of this study is to evaluate the theoretical value on which these instruments were designed.
Triandis (1995) introduced a multidimensional construct of individualism and collectivism by distinguishing it in horizontal (preference for equality) and vertical (preference for hierarchy) terms: Horizontal Individualism (HI), Vertical Individualism (VI), Horizontal Collectivism (HC), and Vertical Collectivism (VC). According to Triandis and Gelfand (1998), HI corre-sponds to individuals who care about being distinct from their groups and who are very self-sufficient. However, the need for high status is not a prior-ity in HI. VI corresponds to individuals who will pursue a higher status, com-monly through competition. HC corresponds to individuals who consider themselves alike others and that value interdependence, sociability, and simi-lar goals with groups. However, complying easily with the authority in HC is not typically observed. VC corresponds to individuals who value the goals of the in-group above all and who will engage in competition only with out-groups. Sacrificing one’s ideals for the benefit of the group as a whole is characteristic of VC, along with complete submission toward authority fig-ures within the in-group. Triandis (1995) further developed 31 scenarios cor-responding to the HVIC behaviors to complement the HVIC attitudes items. However, these scenario measures of the HVIC behaviors do not seem to correlate well with the HVIC attitudes items (Okoro, Cardon, & Marshall, 2008). The HVIC has been validated in various countries and different ver-sions exist (e.g., 32 items, 27 items, 16 items, 14 items). Commonly, samples from the United States were examined in the HVIC validity studies, but sam-ples originating from Singapore (Soh & Leong, 2002), Korea (Triandis & Gelfand, 1998), as well as China, Denmark, and India (Sivadas, Bruvold, & Nelson, 2008) were also examined. For instance, Sivadas et al. found evi-dence for a 14-item version of the scale that outperformed Triandis and Gelfand’s 16-version scale, on the basis of a comparison of six samples in four countries (China, Denmark, India, the United States). For this study, we
focused on the 16 attitudes items of the HVIC taken from Triandis and Gelfand, which seems to be the most frequently used version.
The AICS (Shulruf et al., 2007) is a new tool for assessing individualism and collectivism, which is based on the main dimensions that Oyserman et al. identified in their meta-analyses. According to these authors, the individual-ism and collectivindividual-ism framework’s main asset is its “theoretical parsimony” (Oyserman et al., 2002, p. 44). However, they maintain that the need to define the construct clearly is imperative for operationalization, assessment, and manipulation purposes. They further argue that, only when meeting these condi-tions can this construct have scientific worth. In sum, for future research on individualism and collectivism, these authors conclude from their meta-analysis that the fundamental components of individualism are independence and uniqueness, while those of collectivism are “duty to in-group and, cross-nationally, maintaining harmony.” In addition, they suggest to study “relation-ality” and “enjoyment of belonging to the groups or seeking other’s advice” distinctly, given their weak congruence with the other elements of the con-struct (Oyserman et al., 2002, p. 44). The AICS is comprised of five underly-ing dimensions. Individualism includes three scales (responsibility, uniqueness, and competitiveness), whereas collectivism includes two scales (advice and harmony). As part of the individualism dimension, responsibility is defined as recognizing one’s responsibility for one’s behavior. Uniqueness is the ten-dency to define oneself as separate from others. Competitiveness is described as the tendency to pursue one’s own goals above all. Furthermore, in the col-lectivism dimension, advice is the tendency to obtain advice from others prior to making decisions. Harmony is the tendency to avoid situations of conflict.
Initially, the original version of the AICS consisted of 30 items and the reliability for each scale was between .78 and .71. When first developed, the AICS included an additional dimension of closeness (α = .62) as part of the collectivism scale. However, Shulruf and colleagues (2011) have fur-ther excluded it from the scale given that it did not load in the final model. Few studies were conducted thus far to investigate the psychometric properties of the AICS. For example, Shulruf and colleagues (2011) found adequate goodness-of-fit levels with confirmatory factor analyses (CFAs) in five countries: New Zealand, Portugal, People’s Republic of China, Romania, and Italy. Indeed, these authors postulate that the AICS is a supe-rior measure of individualism and collectivism. They claim that the focus on behaviors rather than on values and attitudes of individualism and col-lectivism is an important and a valuable innovation of this instrument. In addition, Ciochina and Faria (2009) confirmed the internal consistency and validity of the AICS in a study comparing Romanian and Portuguese
samples. However, more studies are needed to examine the measurement equivalence across cultures and also to examine the validity of this scale in other less studied countries, such as the African cultural context.
From an individual’s perspective, culture-driven differences have largely been studied. According to Oyserman and colleagues (2002), various differ-ences across countries and ethnic groups exist regarding individualism and collectivism. For instance, results from their meta-analysis confirm the popu-lar belief that Americans are both higher in individualism and lower in col-lectivism than people from other regions of the world. Nonetheless, their results also showed that American and other Anglophone countries are not significantly different regarding both individualism and collectivism (e.g., Australia, New Zealand, and White South Africa). In a different vein, Americans are lower on collectivism but show no difference in individualism compared with South or Latin Americans. To describe all the differences among individualism and collectivism found in Oyserman and colleagues’ (2002) meta-analyses go beyond the scope of this study. However, their results seem to suggest that there is not a single psychology but rather several psychologies. In addition, numerous outcomes related to individualism and collectivism have been studied. For example, after comparing 46 countries in their study, Kuppens, Realo, and Diener (2008) found that the experience of negative emotions has a more negative effect on life satisfaction in individu-alistic countries than in collectivistic ones. There are few studies addressing the South African or Swiss context specifically in relation to culture-driven individual differences. However, one study found that in South Africa, the
ubuntu concept defined as “communality, openness, cooperation, and
shar-ing” is an essential characteristic of their culture, which diverges from the Occidental health models on which most psychotherapy interventions are commonly based upon (Van Dyk & Nefale, 2005, p. 48). These authors claim that the Western style of therapy is inadequate for South Africans and that adapting the type of therapy is crucial to address these singular ubuntu South African values. To better understand the similarities and particularities of South Africa with Western countries, the study of culture-driven individual differences using culturally robust instruments is fundamental.
The main goal of this study was to evaluate the psychometric properties of two individualism and collectivism scales through internal consistency, exploratory factor analyses (EFA), confirmatory factor analyses (CFA), and invariance equivalence (configural, metric, and scalar). Specifically, we aimed at validating the French versions in Switzerland of both the HVIC and the AICS and to verify the cross-cultural replicability of these instruments in South Africa and Switzerland. We also addressed four identified limitations
of cross-cultural research advanced by Oyserman and colleagues (2002). First, we used samples originating from the working population rather than samples of students most researchers have used to date. Thus, we addressed the generalizability limitation issue. Furthermore, few cross-national studies have actually looked at individual-level differences (culture-driven individ-ual differences in the same culture) along with individindivid-ual difference across groups (cross-cultural differences). Thus, by addressing both levels of analy-sis, we limit the risks of making ambiguous cultural comparisons. Moreover, in this study the conceptualization of individualism and collectivism is based on two original, widely used and robust constructs (HVIC and AICS), which limit the heterogeneity of the results. Finally, a large number of studies com-pared U.S. samples with minorities of East Asian students from Japan, Hong Kong, China, or Korea from the American population. Our study examined samples taken from Switzerland and South Africa, which have been less stud-ied. In fact, the study of culture-driven individual differences is less common in the African context and our study will surely help in gaining more gener-alizable conclusions for both the HVIC and AICS scales.
Method
Subjects
The sample consisted of 1,403 working individuals from Switzerland (N = 585) and from South Africa (N = 818). In Switzerland, 48.4% were men and 51.5% were women (0.2% unknown), aged from 18 to 65 (mean age = 39.92,
SD = 12.88) and 63.1% were Swiss natives while 36.8% originated from
foreign countries (0.2% were unknown). In South Africa, 41% were men and 58.8% were women (0.2% unknown), aged from 16 to 64 (mean age = 33.51,
SD = 10.74) and 93.4% were South African natives (50.7% “White,” 32.1%
“Black,” 6.5% “Asian,” 8.6% “colored,” 2.1% “Other”1) while 6.6% were
foreigners. Participants from both countries completed a minimum of 12 years of education. The education level for 35.9% of the Swiss sample was at the bachelor level or higher while this proportion was of 41.4% in the South African sample.
Instruments
Horizontal and Vertical Individualism and Collectivism Scale (HVIC). The HVIC
is a widely used measure of individualism and collectivism developed by Triandis and Gelfand (1998). The short 16-item HVIC Scale used for this
study is a selection of items made on the basis of the loading of 32 original items (Singelis, Triandis, Bhawuk, & Gelfand, 1995). Each of the four dimen-sions comprises four items. For example, an item from the HI dimension is, “I’d rather depend on myself than others”; an item from the VI dimensions is “Winning is everything.” An example of the HC dimension is, “If a coworker gets a prize, I would feel proud”; an item from the VC dimension is “Parents and children must stay together as much as possible.” The response rate of the HVIC is based on a 9-point Likert-type scale (1 = highly disagree, 9 =
highly agree).
Auckland Individualism and Collectivism Scale (AICS). Shulruf et al. (2007)
developed the AICS. It includes 26 items derived from a review and meta-analysis of 83 studies by Oyserman et al. (2002). Individualism is measured with three dimensions: Responsibility (four items), Compete (seven items), and Unique (four items). Such items include: “I consult with superiors on work-related matters” (Responsibility dimension); “I define myself as a competitive person” (Compete dimension); “I enjoy being unique and dif-ferent from others” (Unique dimension). Collectivism consists of two dimensions: advice (seven items) and harmony (four items). These items include: “I consult my family before making an important decision” (Advice dimension); “I sacrifice my self-interest for the benefit of my group” (Har-mony dimension). The items ask “frequency of behaviors” on a 6-point Likert-type scale (1 = never, 6 = always).
Translation
Items of the HVIC and the AICS were translated from English to French by our research team and further back-translated into English by an English language professional. Finally, refinements and corrections were made according to and in agreement with the authors of the two original scales. The French-translated versions of the two scales were administered in Switzerland while the original English versions were administered in South Africa.
Procedure
As part of a larger ongoing research study, participants were asked to fill out a questionnaire containing 13 different measures on work stress, health, per-sonality, and culture. In Switzerland, participants were recruited with the help of bachelor’s and master’s psychology students from the University of Lausanne who each found between three and six participants in their circle
of acquaintances. In South Africa, participants were recruited with the help of master’s students in work and organizational psychology. No compensa-tion was given for participating in the study. Criteria to participate were working for at least 1 year (between 80% and 100%), 12 years of education minimum, and at least 18 years old.
Results
Descriptive Statistics
The means, standard deviations, kurtosis, skewness, and Cronbach’s alphas of both instruments are presented in Table 1 for the Swiss and South African samples. Internal reliability in Switzerland for the global scales of HVIC individualism and collectivism was .75 and .73, respectively; in South Africa, these values were .78 and .84, respectively. For the four facets, internal reli-ability was satisfactory in both samples (ranging from .83 to .64). Generally, kurtosis and skewness values for the HVIC were below 1, which indicated normal and symmetrical distributions, except for the collectivism general scale in both countries, the VC facet in South Africa, and the HC facet in Switzerland indicating values slightly above 1. Correlations among some dimensions of the HVIC were found, namely VI correlated with HI (r = .28), HC (r = -.16), and VC (r = .15), whereas HC correlated with VC (r = .23) in Switzerland. The general individualism and collectivism dimensions were not correlated in Switzerland. In South Africa, HI correlated with VI (r = .38), HC (r = .18), and VC (r = .33); VI correlated with VC (r = .19); and HC correlated with VC (r = .52). Furthermore, the general individualism and collectivism scales were positively correlated (r = .27) in South Africa.
Internal reliability in Switzerland for the global AICS individualism and the collectivism scales was .84 and .77, respectively; in South Africa, these values are .86 and .80, respectively. For the five facets, internal reliability was generally satisfactory in both samples (ranging from .89 to .61). However, reliability of the responsibility and the harmony facets were weak in Switzerland, with values of .48 and .55, respectively. All kurtosis and skew-ness values for the AICS were below 1 in both samples, which indicated nor-mal and symmetrical distributions. Correlations among some dimensions of the AICS were found in Switzerland, namely advice correlated with: harmony (r = .28), compete (r = .17), unique (r = .13), and responsibility (r = .16); com-pete correlated with unique (r = .32) and responsibility (r = .15); and finally, unique correlated with responsibility (r = .41). Moreover, the general indi-vidualism and collectivism scales were positively correlated (r = .19) in
Switzerland. In South Africa, considerably strong and numerous correlations were found among some of the dimensions. Advice correlated with Harmony (r = .37), Compete (r = .31), Unique (r = .17), and Responsibility (r = .28); Harmony correlated with Compete (r = .23), Unique (r = .09), and Responsibility (r = .18); Compete correlated with Unique (r = .31) and Responsibility (r = .31); and finally, Unique correlated with Responsibility (r = .56). In addition, the general individualism and collectivism scales were positively correlated (r = .36) in South Africa.
Principal Component Analysis
The structure underlying the 16 HVIC items was studied in Switzerland and South Africa using principal components analysis (PCA) with varimax rotation (see Table 2). First, a four-component model was considered. In Switzerland, these four components explained a total of 59.14% of the variance and the five
Table 1. Descriptives, Cronbach’s Alphas, Means, SD, Kurtosis, and Skewness
Coefficients
Switzerland South Africa
α M SD k s α M SD k s
Horizontal and Vertical Individualism and Collectivism Scale
Individualism .75 45.50 9.49 -0.25 -0.20 .78 48.53 10.37 0.01 -0.30 HI .64 27.14 4.69 0.78 -0.76 .78 26.78 6.08 0.23 -0.59 VI .80 18.36 7.03 -0.85 -0.03 .75 21.74 6.51 -0.40 -0.17 Collectivism .73 55.97 7.20 1.09 -0.57 .84 57.15 9.87 1.8 -1.00 HC .76 28.01 4.32 1.51 -0.91 .77 27.99 5.43 0.65 -0.72 VC .72 27.97 4.83 0.84 -0.77 .83 29.16 5.88 1.43 -1.14
Auckland Individualism and Collectivism Scale
Individualism .84 54.22 10.05 0.07 0.35 .86 63.19 11.00 -0.13 0.20 C .89 20.38 7.04 -0.30 0.33 .88 25.95 7.50 -0.51 0.09 U .78 15.84 3.85 -0.06 -0.04 .73 18.21 3.60 -0.12 -0.36 R .48 18.05 2.52 -0.31 0.23 .61 19.03 2.90 0.08 -0.38 Collectivism .77 37.91 6.87 0.16 0.17 .80 39.87 8.38 0.25 0.25 A .81 24.65 5.47 0.36 0.08 .82 25.95 6.45 -0.11 0.06 H .55 13.26 2.89 0.31 0.29 .62 13.92 3.49 0.26 0.36
Note: Switzerland sample, n = 585; South African sample, n = 818; C = collectivism; U = unique; R = responsibility; A = advice; H = harmony; HI = horizontal individualism; VI = vertical individualism; HC = horizontal collectivism; VC = vertical collectivism.
first eigenvalues were 3.18, 2.88, 1.84, 1.56, and 0.85. The first component was associated with VI (r = .97), Component 2 with HC (r = .96), Component 3 with VC (r = .97), and Component 4 with HI (r = .97). In South Africa, the four components explained a total of 63.00% of the variance and the five first eigen-values were 4.74, 2.58, 1.55, 1.22, and 0.78. The first component was associated with HC (r = .96), Component 2 with VC (r = .93), Component 3 with HI (r = .96), and Component 4 with VI (r = .97). We compared the Swiss and South African loading matrices by computing congruence coefficients (CCs) after an orthogonal Procrustes rotation using the South African loadings as the target. Items’ CCs ranged from .84 to .99 (median = .97). The CCs of the four compo-nents ranged from .94 to .97, while the total CC was .96, indicating that this four-component structure replicates very well across the two studied countries.
We also examined a two-component structure for the HVIC Scale in both countries. In Switzerland, these two components explained a total of 37.89% of the variance and the three first eigenvalues were 3.18, 2.88, and 1.84. The first component was closely associated with the Individualism dimension (r = .95)
Table 2. Principal Component Analysis Results for the HVIC, in South Africa and
Switzerland, and Congruence Coefficients After Procrustes Rotation
Four-component model Two-component model
South African matrix Swiss matrix South African matrix Swiss matrix Items 1 2 3 4 1 2 3 4 CCs 1 2 1 2 CCs 1 -.01 .05 .83 .08 -.21 .06 .77 .04 .97 .08 .63 -.14 .45 .91 2 .02 .12 .84 .09 -.29 .07 .78 .09 .93 .15 .66 -.19 .51 .83 3 .03 .16 .78 .12 .28 -.06 .56 .12 .87 .18 .64 .19 .27 .94 4 .25 .14 .52 .24 .26 -.09 .56 .22 .94 .29 .52 .16 .36 1.00 5 .23 .14 .38 .60 .02 .11 .23 .77 .92 .22 .68 .08 .75 .98 6 .05 .11 .12 .80 -.11 .12 .17 .82 .98 .02 .66 -.02 .80 1.00 7 .03 .11 .10 .82 -.00 .11 .15 .77 1.00 -.00 .65 .06 .73 1.00 8 -.21 -.10 .05 .69 -.12 -.05 -.06 .70 .98 -.31 .52 -.13 .55 .95 9 .70 .14 .10 -.12 .60 .07 .20 -.33 .93 .64 -.06 .52 -.29 .91 10 .81 .12 .13 -.02 .76 .06 .12 -.18 .98 .70 .02 .65 -.23 .93 11 .67 .20 -.09 .10 .77 .08 -.15 .08 .98 .62 -.02 .67 -.14 .97 12 .76 .27 .08 .03 .78 .16 -.16 .02 .95 .75 .05 .72 -.18 .95 13 .21 .78 .10 .05 .09 .65 -.08 .21 .94 .66 .20 .46 .30 .96 14 .19 .81 .18 .04 .01 .85 .02 -.04 .95 .67 .26 .51 .22 1.00 15 .16 .84 .15 .10 .04 .84 .03 .08 .98 .66 .29 .53 .31 .99 16 .46 .58 .09 .07 .36 .53 .03 -.03 .99 .72 .16 .61 .07 .99 CCs — — — — .93 .97 .95 .97 .95 — — .96 .93 .94
and the second component was closely associated with the Collectivism dimen-sion (r = .98). In South Africa, the two components explained a total of 45.72% of the variance and the first three eigenvalues were 4.74, 2.58, and 1.55. The first component was associated with the Collectivism dimension (r = .98), and the second component was associated with the Individualism dimension (r = .99). Again, we compared the Swiss and South African loading matrices by computing CCs after an orthogonal Procrustes rotation, using the South African loadings as the target. The items’ CCs ranged from .82 to 1.00 (median = .97). The CCs of the two components were .96 and .93, and the total CC was .95. The CCs clearly indicate that the two- and four-component structures rep-licate well across the two studied countries.
We also examined the structure underlying the AICS in both countries using PCA with varimax rotation (see Table 3). In Switzerland, a PCA with varimax rotation of the 26 items allowed for extracting five components, to be compared with five subscales of the AICS. These five components explained a total of 55.54% of the variance, and the first six eigenvalues were 5.35, 3.45, 2.56, 1.56, 1.52, and 1.03. Component 1 was associated with the Compete subscale (r = .99), Component 2 with Advice subscale (r = .97), Component 3 with Unique subscale (r = .95), Component 4 with Responsibility subscale (r = .74), and Component 5 with Harmony subscale (r = .94). In South Africa, the five extracted components explained a total of 54.97% of the variance, and the first six eigenvalues were 6.19, 3.00, 2.36, 1.50, 1.25, and 1.06. The one-to-one association between subscales and components was not as clear in South Africa. Component 1 was associated with Compete (r = .97), Component 2 with Unique (r = .92), Component 3 with Advice (r = .81), Component 4 with Responsibility (r = .47), and Component 5 with Harmony (r = .94). Furthermore, we compared the Swiss and South African loading matrices by computing CCs after an orthogonal Procrustes rotation using the South African loadings as the target. Items’ CCs ranged from .76 to .99 (median = .98), whereas CCs for the five components ranged from .91 to .98 (median = .97). The total CC was .96, indicating a similar structure in both countries. A series of PCAs with oblique rotation were also conducted and did not improve these results.
Using the same methods described for the five-component model, we also examined the two-component structure of the 26 items in both countries (Table 3). These two components should correspond to the two higher-order individualism and collectivism dimensions. In Switzerland, the two factors explained a total of 33.83% of the variance and the three first eigenvalues were 5.35, 3.45, and 2.56. In Switzerland, Component 1 was closely associ-ated with the Individualism dimension (r = .98), and Component 2 was
closely associated with the Collectivism dimension (r = .97). In South Africa, these two components explained a total variance of 35.33%, and the three first eigenvalues were 6.19, 3.00, and 2.36. Component 1 was associated with the Individualism dimension (r = .97), and Component 2 was associated with the Collectivism dimension (r = .96). Furthermore, we compared the Swiss and South African loading matrices by computing CCs after an orthogonal Procrustes rotation using the South African loadings as the target. Items’ CCs ranged from .54 to 1.00 (median = .98). The CCs for the two dimensions and
Table 3. Principal Component Analysis Results for the AICS, in South Africa and
Switzerland, and Congruence Coefficients After Procrustes Rotation
Five-component model Two-component model
South African matrix Swiss matrix SA matrix Swiss matrix Items 1 2 3 4 5 1 2 3 4 5 CCs 1 2 1 2 CCs 1 .75 .15 .06 .12 -.00 .78 .11 .03 .15 -.06 .99 .65 .21 .74 .06 .97 2 .23 .69 .07 -.06 .03 .19 .79 .16 -.06 -.01 .99 .61 -.00 .56 .08 .99 3 .07 .10 .41 .60 .09 .01 .05 .62 .32 .15 .88 .16 .59 .08 .64 .99 4 .02 -.02 .06 .20 .73 -.09 -.03 -.01 .15 .71 .98 .03 .40 -.10 .24 .89 5 .09 .24 .07 .48 .27 -.06 .05 .16 .30 .39 .84 .29 .32 .01 .29 .76 6 .79 .14 .11 .01 .04 .79 .15 .03 .01 .04 .99 .64 .23 .74 .08 .97 7 .82 .12 .06 .10 .02 .75 .01 .05 .02 -.03 .99 .68 .23 .64 .09 .98 8 .18 -.03 .75 .15 .12 .12 .04 .70 -.21 .13 .88 .05 .75 .07 .69 1.00 9 .11 .07 .39 .11 .42 .13 -.20 .29 .12 .32 .86 .10 .53 .01 .41 .99 10 .11 .03 .75 .22 .09 .00 -.05 .78 .11 .07 .97 .04 .75 -.02 .76 1.00 11 .04 .56 .06 .31 -.02 .10 .11 .08 .65 .12 .62 .45 .09 .24 .15 1.00 12 .06 .74 .13 -.07 .00 .12 .82 .15 -.08 .01 1.00 .52 -.00 .50 .07 .54 13 .09 .04 .84 .18 .09 .09 .08 .81 -.06 .09 .96 .02 .80 .10 .78 .99 14 .63 .13 .19 -.08 .13 .77 -.00 .07 -.05 .05 .95 .51 .28 .64 .13 .96 15 .10 .02 .79 .02 .08 .08 .04 .74 -.22 .06 .95 -.00 .70 .05 .69 1.00 16 .13 -.05 .26 -.07 .64 .06 .03 .18 -.37 .64 .90 -.03 .45 -.02 .37 .99 17 .14 .65 -.05 .10 .11 .12 .62 -.15 .32 .01 .93 .56 -.02 .48 -.16 .96 18 .07 .11 .10 .72 .02 .06 .08 .50 .43 -.02 .76 .20 .36 .16 .48 .98 19 .05 .50 -.07 .39 -.03 .02 .29 -.06 .69 -.04 .87 .43 .02 .28 -.06 .97 20 .05 .09 .01 .01 .76 .10 .01 .09 -.02 .74 .99 .10 .29 .05 .34 .98 21 .55 .26 -.02 .23 .15 .71 .23 .15 .06 .06 .92 .61 .19 .72 .19 1.00 22 .21 .65 .03 .09 .04 .21 .73 -.01 .17 -.03 .99 .59 .03 .58 -.06 .99 23 .82 .14 .10 .09 .05 .82 .18 .06 -.04 -.00 .98 .68 .26 .77 .10 .97 24 .13 .01 .31 .67 .02 .05 -.08 .54 .36 .03 .84 .15 .53 .06 .55 .98 25 .79 .04 .12 .04 .06 .78 .08 .03 .05 .03 .99 .58 .27 .70 .09 .95 26 .11 .66 -.06 .09 -.02 .04 .59 -.09 .30 -.02 .94 .54 -.09 .39 -.12 .99 CCs — — — — — .98 .92 .94 .75 .98 .93 — — .97 .90 .94
the total CC ranged from .90 to .97, indicating that this two-component struc-ture replicates well across the two studied countries. In sum, these results show that the five-component structure of the AICS is less stable across both countries than the two-component structure.
Confirmatory Factor Analysis
We performed confirmatory factor analyses (CFA) to examine the construct validity of the French version of the HVIC in Switzerland in comparison to the original English version in South Africa. Table 4 shows the results of four oblique models. The theoretical model showed a relatively acceptable but not perfect fit given that the comparative fit index (CFI) and Tucker-Lewis Index (TLI) values were between .86 and .90, whereas the RMSEA was .08 in both countries. To improve the fit, we adjusted the theoretical models for each country by allowing three pairs of errors to covariate for South Africa and two pairs of errors to covariate for Switzerland. For Switzerland, we also took into account three secondary loadings: Item 8 on HC, Item 5 on HI, and Item 16 on HC. All these adjustments were associated with a modification
Table 4. Goodness-of-Fit Indices for the HVIC and AICS Models, in South Africa
and Switzerland
χ2 df p χ2/df CFI TLI RMSEA
Horizontal and Vertical Individualism and Collectivism Scale South Africa Theoretical model 566.63 98 <.001 5.78 .90 .88 .08 Adjusted modelb 249.76 93 <.001 2.69 .97 .96 .05 Switzerland Theoretical model 471.85 98 <.001 4.82 .86 .83 .08 Adjusted modelb 284.20 94 <.001 3.02 .93 .91 .06 Auckland Individualism and Collectivism Scale
South Africa Theoretical model 1256.38 269 <.001 4.67 .86 .84 .07 Adjusted modela 966.21 266 <.001 3.63 .90 .89 .06 Switzerland Theoretical model 1023.44 269 <.001 3.81 .85 .83 .07 Adjusted modela 879.18 267 <.001 3.29 .88 .86 .06
Note: n = 818; Switzerland, n = 585; CFI = comparative fit index; TLI = Tucker-Lewis Index; RMSEA = root mean square error of approximation.
aCovariations between error terms associated with a modification index above 40 were taken into account. bCovariations between error terms and secondary loadings associated with a modification index above 20
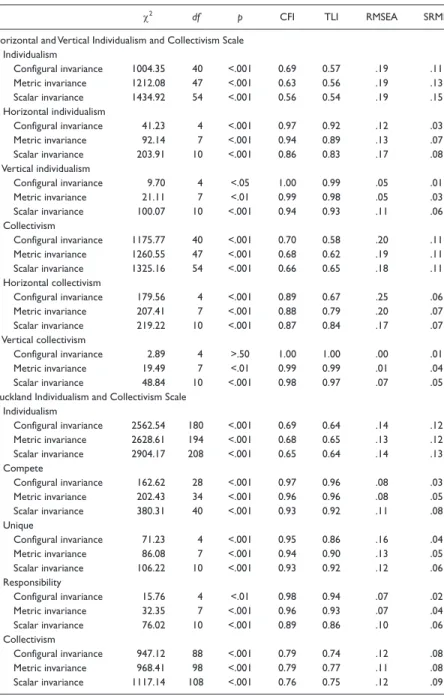
Table 5. Invariance Indices Across South Africa and Switzerland
χ2 df p CFI TLI RMSEA SRMR
Horizontal and Vertical Individualism and Collectivism Scale Individualism Configural invariance 1004.35 40 <.001 0.69 0.57 .19 .11 Metric invariance 1212.08 47 <.001 0.63 0.56 .19 .13 Scalar invariance 1434.92 54 <.001 0.56 0.54 .19 .15 Horizontal individualism Configural invariance 41.23 4 <.001 0.97 0.92 .12 .03 Metric invariance 92.14 7 <.001 0.94 0.89 .13 .07 Scalar invariance 203.91 10 <.001 0.86 0.83 .17 .08 Vertical individualism Configural invariance 9.70 4 <.05 1.00 0.99 .05 .01 Metric invariance 21.11 7 <.01 0.99 0.98 .05 .03 Scalar invariance 100.07 10 <.001 0.94 0.93 .11 .06 Collectivism Configural invariance 1175.77 40 <.001 0.70 0.58 .20 .11 Metric invariance 1260.55 47 <.001 0.68 0.62 .19 .11 Scalar invariance 1325.16 54 <.001 0.66 0.65 .18 .11 Horizontal collectivism Configural invariance 179.56 4 <.001 0.89 0.67 .25 .06 Metric invariance 207.41 7 <.001 0.88 0.79 .20 .07 Scalar invariance 219.22 10 <.001 0.87 0.84 .17 .07 Vertical collectivism Configural invariance 2.89 4 >.50 1.00 1.00 .00 .01 Metric invariance 19.49 7 <.01 0.99 0.99 .01 .04 Scalar invariance 48.84 10 <.001 0.98 0.97 .07 .05
Auckland Individualism and Collectivism Scale Individualism Configural invariance 2562.54 180 <.001 0.69 0.64 .14 .12 Metric invariance 2628.61 194 <.001 0.68 0.65 .13 .12 Scalar invariance 2904.17 208 <.001 0.65 0.64 .14 .13 Compete Configural invariance 162.62 28 <.001 0.97 0.96 .08 .03 Metric invariance 202.43 34 <.001 0.96 0.96 .08 .05 Scalar invariance 380.31 40 <.001 0.93 0.92 .11 .08 Unique Configural invariance 71.23 4 <.001 0.95 0.86 .16 .04 Metric invariance 86.08 7 <.001 0.94 0.90 .13 .05 Scalar invariance 106.22 10 <.001 0.93 0.92 .12 .06 Responsibility Configural invariance 15.76 4 <.01 0.98 0.94 .07 .02 Metric invariance 32.35 7 <.001 0.96 0.93 .07 .04 Scalar invariance 76.02 10 <.001 0.89 0.86 .10 .06 Collectivism Configural invariance 947.12 88 <.001 0.79 0.74 .12 .08 Metric invariance 968.41 98 <.001 0.79 0.77 .11 .08 Scalar invariance 1117.14 108 <.001 0.76 0.75 .12 .09 (continued)
index equal or above 20 (this cutoff was applied to take into account the dif-ferences in terms of degree of freedoms between the HVIC and the AICS). These adjustments improved the goodness-of-fit indices.
We also performed CFAs to examine the construct validity of the French version of the AICS in Switzerland in comparison to the original English ver-sion in South Africa. Table 4 shows the results of four oblique models. The theoretical model showed a relatively acceptable but not perfect fit. For instance, the CFI and TLI values were between .83 and .86, whereas the RMSEA was below .08 for Switzerland and South Africa. To improve the fit, the theoretical models were adjusted for the two countries. Specifically, we allowed three pairs of errors to covariate in the South African model, associ-ated with a modification index above 40, and two pairs of errors to covariate in Switzerland, associated with a modification index above 40. The goodness-of-fit indices were acceptable following these adjustments.
Measurement Invariance
For each scale composing the two instruments, the level of measurement invariance across the South African and Swiss samples was analyzed using the method suggested by Steenkamp and Baumgartner (1998). Regarding the HVIC subscales, goodness-of-fit indices indicated that VI and VC reached configural, metric, and scalar equivalence. HI reached configural and metric invariance. The HC scale was not invariant, given that the corresponding goodness-of-fit values did not reach the expected cutoff values. Overall, the CFI values ranged from .86 to 1.00 (median = .96); TLI values, from .67 to 1.00 (median = .93); RMSEA (root mean square error of approximation) values, from .00 to .25 (median = .12); and SRMR (standardized root mean
χ2 df p CFI TLI RMSEA SRMR
Advice Configural invariance 455.16 28 <.001 0.87 0.81 .15 .07 Metric invariance 465.63 34 <.001 0.87 0.84 .14 .08 Scalar invariance 559.84 40 <.001 0.84 0.84 .14 .08 Harmony Configural invariance 12.67 4 <.05 0.98 0.95 .06 .02 Metric invariance 29.08 7 <.001 0.96 0.93 .07 .04 Scalar invariance 91.14 10 <.001 0.85 0.82 .11 .06
Note: Switzerland sample, n = 585; South African sample, n = 818. CFI = comparative fit index; TLI = Tuker-Lewis Index; RMSEA = root mean square error of approximation.
square residual) values, from .01 to .08 (median = .06). The general indi-vidualism and collectivism scale did not reach configural, metric, or scalar invariance. In sum, the invariances of the four HVIC subscales were rela-tively high but were lower for the two main dimensions. These results sug-gest that mean-level scores may be compared across Switzerland and South Africa for some scales of this instrument, specifically the VI and VC scales.
Regarding the three AICS individualism subscales, goodness-of-fit indi-ces reached configural, metric, and scalar invariance, with the exception of the Responsibility subscale that did not reach scalar invariance. The fit indi-ces were slightly lower for the two collectivism subscales. Concerning col-lectivism, only the Harmony subscale reached configural and metric invariance. Furthermore, the Advice subscale did not even reach configural invariance. Overall, the CFI values ranged from .84 to .98 (median = .94); TLI values, from .81 to .96 (median = .92); RMSEA values, from .11 to .14 (median = .13); and SRMR values, from .08 to .13 (median = .11). The gen-eral individualism and collectivism scales did not reach configural, metric, or scalar invariance. Globally, these results indicate that the AICS subscales generally reached structural and metric invariance, while half of the sub-scales also reached scalar invariance. Results were less positive for the main scales. In sum, the level of invariance of the AICS is rather similar to the level of invariance of the HVIC.
Relationship Between HVIC and AICS
Scales and the Mean-Level Differences
Correlations found between the individualism and collectivism across the AICS and the HVIC were relatively weak in both countries, indicating that both instruments assess these two constructs on the basis of fairly different operationalizations. The correlations between the two individualism scales were .67 and .61, respectively, and the correlation between the two collectiv-ism scales were .31 and .37 in Switzerland and South Africa respectively. We further conducted canonical correlations to evaluate the relationship between the two sets of variables in the HVIC and the AICS. The four canonical vari-ables extracted explained only 24% of the variance of the five AICS dimen-sions in South Africa and 22% in Switzerland and explained 27% of the variance of the four HVIC dimensions in both countries.
Discussion
This study investigated the psychometric properties of the HVIC and AICS measures of individualism and collectivism in two countries: Switzerland and
South Africa. Results obtained indicate that the HVIC is an adequate instru-ment for the measureinstru-ment of horizontal and vertical individualism and col-lectivism in both countries. However, a few nonnegligible associations were found between some dimensions, of which the most important were HI cor-relating with VI (.28 in Switzerland and .38 in South Africa) and HC correlat-ing with VC (.23 in Switzerland and .52 in South Africa). Surpriscorrelat-ingly, Li and Aksoy (2007) found stronger relationships between HI and VI (.39) and between HC and VC (.79), which led them to question the presumed indepen-dence between the four-dimensions constituting the HVIC as postulated by Triandis and Gelfand (Triandis, 1995; Triandis & Gelfand, 1998). Though most correlations were fairly weaker in our study compared to those found by Li and Aksoy (2007), their presence reveals that complete independence was not reached among the HVIC dimensions. In addition, results from PCAs indicate that the two-component and four-component structures of the HVIC replicated well across both countries with very high associations between dimensions and factors. Finally, following a few adjustments to the models, CFAs indicated acceptable goodness-of-fit indices for the HVIC, which con-firms the four-factor structure of the scale. These results seem to be less in line with Lalwani, Shavitt, and Johnson (2006), who found low-indices fits of the HVIC with their data. However, Li and Aksoy have confirmed through CFAs that the HVIC Scale best fits as “separate I-C constructs with multiple dimen-sions” (Li & Aksoy, 2007, p. 325). Finally, the invariance indices (configural, metric, scalar) of the HVIC subscales were relatively high and showed mod-erately good fit, indicating that the HVIC has generally equivalent measure-ment properties in Switzerland and South Africa. Taken together, the invariance indices demonstrate that the respondents shared a similar under-standing of the HVIC Scale and that the underlying meaning and interpreta-tion of the items were comparable in both samples.
Results obtained from the AICS showed that the internal reliability of some scales, in particular the Responsibility subscale, are slightly lower and less adequate in Switzerland than in South Africa. Also, several associations between subscales were found in both countries, of which the most important were advice correlating with harmony (.28 in Switzerland, .37 in South Africa) as well as unique correlating with both compete (.32 in Switzerland, .31 in South Africa) and responsibility (.41 in Switzerland, .56 in South Africa). Similarly to the HVIC, we cannot claim complete independence among the AICS dimensions on the basis of these correlations. In addition, results from PCAs showed that the five-component structure of the AICS seems slightly less stable across both countries than the two-component structure. Specifically, the Responsibility scale underlying the concept of individualism was not confirmed with the PCAs, notably in South Africa.
Furthermore, CFAs showed that goodness-of-fit indices were acceptable for the AICS in both countries, which is in accordance with Bernardo’s (2010) CFA results that led to the most acceptable fit indices using the two higher-order factor structure of individualism and collectivism. Finally, the invari-ances of the AICS subscales were relatively high for the AICS scales and showed moderately good fit in both countries. Similarly to the HVIC, the invariance indices demonstrate that the respondents shared a similar under-standing of the AICS scales and that the underlying meaning and interpreta-tion of the items were comparable in both samples. Moreover, canonical correlations indicate that the relationship between the two sets of variables in the HVIC and the AICS are fairly weak.
When examining the construct validity and the corresponding goodness-of-fit indices, the data had a slightly weaker fit for the AICS compared to the HVIC. However, the goodness-of-fit indices were acceptable following the covariances and secondary loading adjustments. Through the examination of measurement invariance for the AICS and the HVIC, the structural, metric, and scalar equivalence were acceptable but not perfect for both models. However, the four dimensions of the HVIC had the best goodness-of-fit indi-ces compared to the two-dimensional HVIC and compared to the AICS’ five-dimensional and two-five-dimensional models. Similarly, when comparing the validity of three different measures of individualism and collectivism, Paquet and Kline (2009) concluded that the factor structure of the HVIC was the most consistent.
Limitations of this study may be that the two samples taken from Switzerland and South Africa we examined are not representative of the general population. For example, the samples in both countries consisted of particularly well-educated individuals and did not include less socioeconomically privileged indi-viduals. Furthermore, other demographic factors may account for the differences found across countries, such as the higher access to a culturally diverse sample in organizations from Switzerland than from South Africa.
Overall, our results particularly support the idea that Triandis’s HVIC measure of horizontal and vertical individualism and collectivism is perti-nent. Based on our results, it can be concluded that the original four-factor orthogonal structure of the HVIC is particularly reliable and replicates well across both Switzerland and South Africa. Generally, our results are in line with Hofstede’s (1981) results indicating that power distance and individu-alism are the most correlated constructs of culture out of his five dimen-sions. Consequently, the horizontal and vertical components add considerable value to the HVIC and should continue to be used when assessing individu-alism and collectivism. On the other hand, the AICS is slightly less reliable
and valid, but seems to have a fairly transposable construct of individualism and collectivism in both countries nonetheless. More precisely, the relevance of conceptualizing the individualism dimension with three subscales should be questioned and further investigated. In general, our results indicate that these two instruments assess individualism and collectivism quite differ-ently. Indeed, both the HVIC and the AICS define individualism and col-lectivism based on different operationalizations of the constructs. As mentioned in the introduction, the former focuses on attitudes and values, and the latter focuses on behaviors. However, our results do not provide evidence to support Shulruf and colleagues’ (2011) claim that the AICS is an instrument of “superior quality” for measuring individualism and collectiv-ism. This said, the measurement of behaviors seems to have limitations and may represent less stability over time and relative to the different situations compared to attitudes and values. Manifestly, the HVIC scale with its four underlying dimensions seemed to be an especially robust instrument cross-culturally according to our results.
Authors’ Note
Christina Györkös, Institute of Psychology, University of Lausanne, Switzerland; Jürgen Becker, Faculty of Management, University of Johannesburg, South Africa; Koorosh Massoudi, Institute of Psychology, University of Lausanne, Switzerland; Jean-Philippe Antonietti, Institute of Psychology, University of Lausanne, Switzerland; Cornelia Pocnet, Institute of Psychology, University of Lausanne, Switzerland; Gideon P. de Bruin, Faculty of Management, University of Johannesburg, South Africa; Jérôme Rossier, Institute of Psychology, University of Lausanne, Switzerland.
Declaration of Conflicting Interests
The authors declared no potential conflicts of interest with respect to the research, authorship, and/or publication of this article.
Funding
The authors disclosed receipt of the following financial support for the research, authorship, and/or publication of this article: This research was financed through a grant of the Swiss South African Joint Research Program (SSAJRP), organized by the State Secretariat for Education and Research (SER) of the Swiss Confederation and by the South African Department of Science and Technology, to Gideon P. de Bruin, Koorosh Massoudi, and Jérôme Rossier (Grant Number 11).
Note
References
Bernardo, A. B. I. (2010). Extending hope theory: Internal and external locus of trait hope. Personality and Individual Differences, 49, 944-949. doi:10.1016/j. paid.2010.07.036
Ciochina, L., & Faria, L. (2009). Individualism and collectivism: What differences between Portuguese and Romanian adolescents? Spanish Journal of Psychology,
12, 555-564.
Hofstede, G. (1981). Culture and organizations. International Studies of Management
and Organization, 10(4), 15-41.
Hui, C. H. (1988). Measurement of individualism-collectivism: A study of cross-cultural researchers. Journal of Cross-Cultural Psychology, 17, 225-248. Kuppens, P., Realo, A., & Diener, E. (2008). The role of positive and negative
emo-tions in life satisfaction judgment across naemo-tions. Journal of Personality and
Social Psychology, 95, 66-75. doi:10.1037/0022-3514.95.1.66
Lalwani, A. K., Shavitt, S., & Johnson, T. (2006). What is the relation between cul-tural orientation and socially desirable responding? Journal of Personality and
Social Psychology, 90, 165-178.
Li, F., & Aksoy, L. (2007). Dimensionality of individualism-collectivism and mea-surement equivalence of Triandis and Gelfand’s scale. Journal of Business and
Psychology, 21, 313-329. doi:10.1007/s10869-006-9031-8
Okoro, E., Cardon, P. W., & Marshall, B. (2008). Horizontal and vertical individual-ist and collectivindividual-ist tendencies among African American and European American management students. In Proceedings of the 2008 Association for Business
Com-munication Annual Convention, USA (pp. 1-11).
Oyserman, D., Coon, H. M., & Kemmelmeier, M. (2002). Rethinking individualism and collectivism: Evaluation of theoretical assumption and meta-analyses.
Psy-chological Bulletin, 128(1), 3-72. doi:10.1037/0033-2909.128.1.3
Paquet, S. L., & Kline T. J. B. (2009). Uncovering the psychometric properties of scales measuring individualist and collectivist orientations. International Journal
of Testing, 9, 260-270. doi:10.1080/15305050903106859
Shulruf, B., Alesi, M., Ciochina, L., Faria, L., Hattie, J., Hong, F., & Watkins, D. (2011). Measuring collectivism and individualism in the third millennium. Social
Behavior and Personality: An International Journal, 39, 173-188. doi:10.2224/
sbp.2011.39.2.173
Shulruf, B., Hattie J., & Dixon, R. (2007). Development of a new measurement tool for individualism and collectivism. Journal of Psychoeducational Assessment, 25, 385-401. doi:10.1177/0734282906298992
Singelis, T. M., Triandis, H. C., Bhawuk, D. P. S., & Gelfand, M. J. (1995). Hori-zontal and vertical aspects of individualism and collectivism: A theoretical and
measurement refinement. Cross-Cultural Research, 29, 240-275. doi:10.1177/ 106939719502900302
Sivadas, E., Bruvold, N. T., & Nelson, M. R. (2008). A reduced version of the Horizon-tal and Vertical Individualism and Collectivism Scale: A four-country assessment.
Journal of Business Research, 61, 201-210. doi:10.1016/j.jbusres.2007.06.016
Soh, S., & Leong, F. T. L. (2002). Validity of the horizontal individualism and col-lectivism in Singapore: Relationships with values and interests. Journal of
Cross-Cultural Psychology, 33, 3-15. doi:10.1177/0022022102033001001
Steenkamp, J.-B. E. M., & Baumgartner, H. (1998). Assessing measurement invariance in cross-national consumer research. Journal of Consumer Research, 25, 78-90. Triandis, H. C. (1995). Individualism and collectivism. Boulder, CO: Westview. Triandis, H. C., & Gelfand, M. J. (1998). Converging measurement of horizontal and
vertical individualism and collectivism. Journal of Personality and Social
Psy-chology, 74, 118-128. doi:10.1037/0022-3514.74.1.118
Van Dyk, G. A. J., & Nefale, M. C. (2005). The split-ego experience of Africans: Ubuntu therapy as a healing alternative. Journal of Psychotherapy Integration,
15, 48-66. doi:10.1037/1053-0479.15.1.48
Bios
Christina Györkös holds a bachelor’s degree in psychology from Concordia University,
Montreal. She obtained her master’s degree in work and organizational psychology from the University of Neuchâtel and is now completing her PhD in psychology at the University of Lausanne. Her research interests focus on work stress effects on health in diverse cultural settings, individual differences, and psychometrics.
Jürgen Becker is a consultant at the Statistical Consultancy Service of the University
of Johannesburg (STATKON) and lectures psychometrics, research design, and pre-dictive statistical modeling. He has published in the areas of organizational culture, values, assessment centers, integration of minorities in the workplace, burnout, and organizational wellness.
Koorosh Massoudi is a senior lecturer and researcher at the University of Lausanne.
His research mainly focuses on stress and well-being at work, sociocultural integra-tion, and longitudinal study of professional trajectories. He is also active as a career counselor and consultant for public and private organizations, aiming at the imple-mentation of empirical results in order to improve the psychosocial conditions at the work place.
Jean-Philippe Antonietti is a chemical engineer (EPFL). He worked several years at
psychology at the University of Lausanne, where he obtained a master’s degree and a PhD. His research focuses on the teaching and learning of mathematics. He cur-rently teaches statistics at the University of Lausanne (Faculty of Social and Political Sciences).
Cornelia Pocnet completed her degree in psychology in 1997, a postgraduate degree
in “Analysis and psychosocial intervention” in 1999 and a certificate in “Ericksonian Hypnosis and Psychotherapy” in 2003 at the Alexandru Ioan Cuza University of Iasi, Romania. After several years of clinical work in Romania and then in Switzerland, she started in 2009 a thesis on the relationship between personality and cognitive decline in Alzheimer’s disease. She’s also working on various research projects at the University of Lausanne, Switzerland, as a researcher or graduate assistant.
Gideon P. de Bruin received his MA (counseling psychology) and DLitt et Phil
(psychology) degrees from the Rand Afrikaans University. After successive positions at the Rand Afrikaans University, the University of Stellenbosch, he joined the Industrial Psychology program in the Department of Human Resource Management at the University of Johannesburg as a full professor. His research focuses on cross-cultural psychological assessment, with a particular emphasis on personality, career development, and work-related stress. His teaching focuses on research methods in industrial psychology. He has published a large number of articles in scientific jour-nals on the topics of psychological test construction, career development, and cross-cultural personality assessment.
Jérôme Rossier studied psychology at the University of Lausanne, Switzerland, and
at the Catholic University of Louvain, Belgium. He obtained a PhD in psychology at the University of Lausanne. After work experiences at the Academy of Sciences of the Czech Republic; at the National Institute of Health, United-States; and at the University of Fribourg, Switzerland, he is currently full professor of vocational and counseling psychology at the Institute of Psychology of the University of Lausanne. He is also editor of the International Journal for Educational and Vocational
Guidance and member of several editorial boards of scientific journals. His teaching
areas and research interests include counseling, personality, psychological assessment, and cross-cultural psychology. He published a great number of articles and book chap-ters mainly about cross-cultural, personality, and vocational counseling issues.