Renewable Energy
Onsite Generation and
use in Buildings
Of the total electricity consumption in year 2014-15 in India, residential and commercial buildings accounted for ~23% and ~8%, respectively. It is likely that there could be ten fold increase in electricity consumption in these segments in the next thirty years. While energy efficiency measures can reduce demand significantly, onsite renewable energy generation can help further reduce energy & electricity bills, dependence on the central electricity grid, reduce transmission and distribution (T&D) losses while generating clean energy at the same time. Direct onsite renewable energy use in buildings has significant potential and forms one of the key blocks within the larger move by India towards greater use of renewable energy. This report looks at the various onsite renewable energy generation technologies available in India, their policy-regulatory framework and their experience in deployment through various case studies. Supplemented by interaction with various stakeholders in this sector, the report focuses on identifying the opportunities and challenges in realizing the potential of onsite RE generation and use in buildings in India.
Renewable Energy Onsite
Generation and use in Buildings
June 2017
Prepared by
Prayas (Energy Group) Pune - 411038 (India)
Website: www.prayaspune.org/peg/ Greentech Knowledge Solutions Pvt. Ltd.
New Delhi - 110078 (India) Website: www.gkspl.in
Authors :
Greentech Knowledge Solutions Pvt. Ltd., New Delhi
Prashant Bhanware | Bharath Reddy | Sameer Maithel Ananthakrishnan Ravi | Sonal Kumar
Prayas (Energy Group), Pune
About Prayas
Prayas (Initiatives in Health, Energy, Learning and Parenthood) is a non Governmental, non-profit organization based in Pune, India. Members of Prayas are professionals working to protect and promote the public interest in general, and interests of the disadvantaged sections of the society, in particular. Prayas (Energy Group) works on theoretical, conceptual regulatory and policy issues in the energy and electricity sectors. Our activities cover research and intervention in policy and regulatory areas, as well as training, awareness, and support to civil society groups. Prayas (Energy Group) has contributed in the energy sector policy development as part of several official committees constituted by Ministries and Planning Commission. Prayas is registered as SIRO (Scientific and Industrial Research Organization) with Department of Scientific and Industrial Research, Ministry of Science and Technology, Government of India.
Prayas (Energy Group)
Unit III A & III B, Devgiri, Kothrud Industrial Area,
Joshi Railway Museum Lane, Kothrud
Pune 411 038. Maharashtra Phone: 020 - 2542 0720
E-mail: [email protected]; http://www.prayaspune.org/peg
About GKSPL
Greentech Knowledge Solutions Pvt. Ltd. (GKSPL) is a Clean Energy Research and Advisory firm which offers services across Renewable Energy, Energy Efficiency, and Green Buildings domains. GKSPL has been involved in providing technical support for design of several energy-efficient buildings, studies related with integration of renewable energy in buildings, conducting technical training programmes for building design professionals and undertaking policy studies in the field of energy-efficient/low carbon buildings.
Office Address:
197, Indraprastha Apartment,
Pocket 3, Sector 12, Dwarka, New Delhi -110078 Telefax: +91 11 45535574
Email: [email protected] Website: http://www.gkspl.in
Acknowledgements:
We would like to thank all the people we interacted with for the building case studies. They shared relevant information and gave us various insights to understand the practical aspects of the use of renewable energy in buildings. This study could not have been completed without their support. We would also like to thank all the participants of the stakeholder workshop on renewable energy onsite generation and use in buildings organised in
November, 2016 in New Delhi. This roundtable discussion yielded a very fruitful and engaging dialogue and brought out useful suggestions which were incorporated into the report. We would also like to thank the many stakeholders who were interviewed as part of the research for this study and whose valuable comments were useful in widening our perspective and helping us see different dimensions of the issue. Finally we are grateful to Shilpa Kelkar, our colleague at Prayas for her assistance in producing the report.
We are grateful to the Swiss Agency for Development and Cooperation (SDC) for supporting this work.
June 2017
For Private Circulation only
Copyright:Any part of this report can be reproduced for non-commercial use without prior permission, provided that Prayas and GKSPL is clearly acknowledged, and a copy of the published document is sent to Prayas and GKSPL.
Printed by:
Mudra
383, Narayan Peth, Pune. [email protected]
Chapter 1. Introduction and Literature Review ... 1
1.1 Background ... 1
1.2 Objective and Scope of Study ... 3
1.3 Literature Review ... 4
1.3.1 History of global renewable energy use and its outlook ... 4
1.3.2 International Indian scenario: RE potential, target and achievement ... 5
1.3.3 Energy consumption in buildings ... 5
1.3.4 Building codes and rating systems ... 7
Chapter 2. Technologies, Business Models and Case Studies ... 10
2.1 RE Technologies ... 10
2.1.1 Solar photovoltaic technologies ... 10
2.1.2 Solar Water Heating (SWH) ... 11
2.1.3 Solar air conditioning ... 12
2.1.4 Heat pumps ... 13
2.1.5 Waste to energy technologies ... 14
2.2 Business Models ... 14
2.2.1 CAPEX or end-user owned ... 15
2.2.2 OPEX or third party owned and operated ... 15
2.2.3 Utility owned ... 15
2.3 Case Studies ... 15
2.3.1 Influence of building typologies on RE potential and economics ... 17
2.3.2 Need for innovative implementation models ... 17
2.3.3 Using RE for meeting hot water demand in hotels and hospitals... 18
2.3.4 Key role of third party ownership RESCO model... 20
2.3.5 Importance of fully functional net-metering regime ... 20
2.3.6 Importance of planning RE integration during building design and benefits of planned maintenance ... 21
2.3.7 Prioritising between Solar Photovoltaic (SPV) and Solar Water Heating (SWH) ... 22
Chapter 3. Policy/Regulatory Environment for RE in India ... 24
3.1 Central Government/State Policy and Regulatory Framework for RE Technologies ... 24
3.1.1 Solar water heaters ... 24
3.1.1.1 Capital subsidies ... 25
3.1.1.2 Building bylaws for mandatory use of solar water heaters in buildings ... 25
3.1.1.3 Rebate in electricity bill for installation of SWHs ... 25
3.1.1.4 Rebate in property tax for installation of SWHs ... 26
3.1.2 Solar Rooftop PV ... 26
3.1.2.1 Government subsidies ... 26
3.1.2.2 Net-metering regulations ... 26
3.1.3 Biogas ... 28
3.1.4 Heat pumps ... 29
3.2 Hurdles and challenges to deployment at scale ... 29
Table 1 : RE provisions in Indian building codes and rating systems ... 8
Table 2 : Application of solar thermal technologies in buildings ... 10
Table 3 : Comparison of absorption chiller technologies ... 12
Table 4 : Comparison of solar concentrator technologies ... 12
Table 5 : Comparison of air source heat pump and convention water heating systems ... 14
Table 6 : Details of various case studies ... 15
Table 7 : Net-metering regulations in some states ... 27
Table 8 : Solar PV system — Technical details ... 36
Table 9 : Solar water heating system — Technical details ... 38
Table 10 : Technical details of solar PV system ... 40
Table 11 : SWH system — Technical details ... 42
Table 12 : Solar PV system — Technical details ... 43
Table 13 : Solar PV system — Performance details ... 44
Table 14 : Installed solar PV system — Building wise ... 46
Table 15 : Solar PV system — Technical details ... 47
Table 16 : Solar PV system — Performance details ... 47
Table 17 : Solar PV system — Cost details ... 48
Table 18 : Solar thermal cooling system — Technical details ... 53
Table 19 : Solar PV system — Technical details ... 54
Table 20 : SWH system — Technical details ... 56
Table 21 : Air heat pump — Technical details ... 58
Table 22 : EnergyBin 250 — Technical details ... 60
Figure 1 : Projection of energy consumption under best (Level 4)
and worst (Level 1) scenarios ... 1
Figure 2 : Projection of built-up area ... 2
Figure 3 : End-use wise energy demand (excluding cooking energy) in residential and commercial building sectors (2012) ... 2
Figure 4 : History of renewable energy use ... 4
Figure 5 : Seasonal variation in household energy consumption ... 6
Figure 6 : Distribution of household energy consumption in different EPI bands ... 6
Figure 7 : EPI for commercial buildings ... 6
Figure 8 : Classification of heat pumps ... 13
Figure 9 : Different types of business models ... 14
Figure 10 : Key observations and findings of case studies ... 17
Figure 11 : Schematic of electricity supply and SPV system at Orange County, Pune ... 18
Figure 12 : SWH system at Holy Family Hospital ... 19
Figure 13 : Heat pump and Radisson Blu Hotel ... 19
Figure 14 : SPV system at Aranya Bhawan, Jaipur and its schematic ... 21
Figure 15 : SWH system at Magarpatta city, Pune ... 22
Figure 16 : Schematic of energy flow from solar PV system ... 35
Figure 17 : Magarapatta city, site photos ... 37
Figure 18 : Schematic of centralised SWH system at Prime tower ... 38
Figure 19 : Schematic of Solar PV integration in the building ... 40
Figure 20 : Site photos — Solar PV and SWH system installed on a roof top ... 41
Figure 21 : Schematic of energy flow from solar PV system ... 43
Figure 22 : Google earth image of solar PV system installed at IHC ... 45
Figure 23 : Schematic diagram of solar PV system integrated into the buildings at IHC ... 46
Figure 24 : Google earth image of solar PV system installed at Aranya Bhawan ... 49
Figure 25 : Schematic diagram of solar PV system integrated into
the buildings at Aranya Bhawan ... 50
Figure 26 : Comparison of Building energy consumption and solar energy generation ... 50
Figure 27 : Solar cooling system and roof top PV system installed at NETRA building office ... 51
Figure 28 : Schematic of solar thermal cooling system operation ... 52
Figure 29 : Schematic of solar roof top PV system ... 54
Figure 30 : Google earth image of SWH installed at HFH ... 55
Figure 31 : Schematic of hot water system installed at HFH ... 56
Figure 32 : Schematic of air heat pump working ... 58
Figure 33 : Schematic of biogas plant operation and Energy Bin 250 ... 59
Figure 34 : SPV schematic for grid-connected with net-metering and 100% export ... 61
Figure 35 : SPV schematic for grid-connected with net-metering and excess energy export ... 62
Figure 36 : SPV schematic for hybrid system (system with grid back-up power) ... 62
Figure 37 : SPV schematic for stand-alone off-grid configuration ... 63
Figure 38 : Schematic for individual SWH system for each flat ... 64
1. http://www.unep.org/sbci/AboutSBCI/Background.asp
2. Energy Statistics 2015; Ministry of Statistics and Programme Implementation, Govt. of India 3. India Energy Security Scenario (IESS) 2047, NITI Aayog
4. Ibid
1.1
Background
Across the world, buildings use about 40% of total global energy, and in the process, account for approximately 1/3rd of GHG emissions.1 Of the total electricity
consumption in year 2014–15 in India, residential and commercial buildings accounted for ~23% and ~8% respectively.2 Projections by NITI Aayog3 under
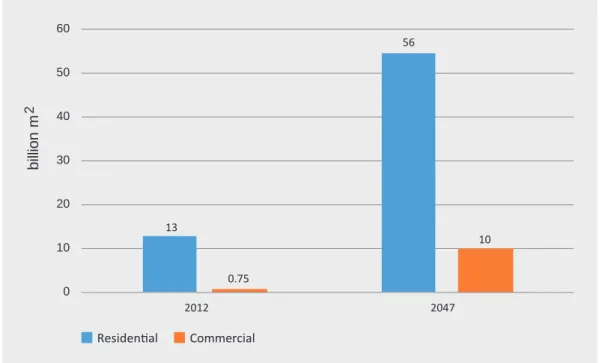
different scenarios (Figure 1) show that the electricity consumption for the residential sector is expected to increase 6–13 times, and 7–11 times for the commercial sector, from 2012 to 2047. This increase in electricity consumption in buildings is primarily attributed to the increase in building stock, with the residential sector built-up area expected to increase by ~4 times, the commercial sector by ~13 times from 2012 to 20474 (Figure 2), expansion of electrification in rural areas as well
as an increased intensity of electricity consumption in urban buildings, mainly due to the rapid growth of air conditioning.
Figure 1 : Projection of energy consumption under best (Level 4) and worst (Level 1) scenarios
1 : Introduction and Literature Review
158 2074 927 80 858 565 0 500 1000 1500 2000 2500 2012 2047 (Level 1: 'Least
Effort' scenario) 2047 (Level 4: 'HeroicEffort' scenario)
TW
h/y
The share of energy demand (excluding cooking energy) in residential and commercial building sectors in 20125 is presented in Figure 3. Space cooling and
ventilation (Ceiling fans + ACs) account for the largest demand of 37% in the residential sector and 55% (Heating, Ventilation and Air Conditioning (HVAC)) in the commercial sector. Water heating and lighting are the other major end-uses of energy in both residential and commercial buildings.
Figure 3 : End-use wise energy demand (excluding cooking energy) in residential and commercial building sectors (2012)
Figure 2 : Projection of built-up area
13 56 0.75 10 0 10 20 30 40 50 60 2012 2047 b illi on m 2 Residential Commercial 17% 22% 21% 12% 12% 16% Residential Sector Share of electricity demand in 2012
55%
20% 14%
11%
Commercial Sector Share of electricity demand in 2012
Water heating Lighting
Refrigerator ACs
Others Water heating
Lighting HVAC
T.V Ceiling fans
In the light of the above discussion and in order to minimise energy consumption in buildings, it is important that the new building stock should be designed for thermal comfort and energy efficiency. This can be achieved through incorporation of passive design measures6 and the use of efficient systems and appliances7.
To further reduce energy demand, a proven solution is to integrate renewable energy systems which can generate energy onsite and allow for its consumption within the building. This not only helps in reducing the dependence of the buildings on the electricity grid, but also helps in reducing GHG emissions by replacing
primarily fossil fuel based grid electricity with renewable energy. It also helps to reduce the transmission and distribution (T&D) losses of the electricity grid, which are very high (~23% in 2014–158) in India.
Direct onsite renewable energy use in buildings has significant potential and forms one of the key blocks within the larger move by India towards greater use of renewable energy. The Government of India has set a target of 175 GW of renewable energy capacity by the year 2022, which includes 100 GW from solar, out of which 40 GW is to be generated from roof top solar or onsite solar energy generation in buildings. Similarly, target for a solar thermal collector (mainly to be installed on buildings) installed area is set at 20 million m2 by 2022.
In addition to the policy intent to utilise buildings for renewable energy generation, the building codes such as the Energy Conservation Building Code (ECBC) and the National Building Code (NBC) as well as various green building rating systems (IGBC, LEED, GRIHA, EDGE) promotes use of Renewable Energy (RE) in buildings. Yet, the penetration of RE in buildings remains limited in India.
1.2
Objective and Scope of Study
The present study focuses on identifying the opportunities and challenges in realising the potential of onsite RE generation and use in buildings in India. It includes: •● Review of renewable energy technology options for use in buildings, •● Review of policies and regulations for renewable energy use in buildings, •● Case studies of building wherein considerable amount of renewable energy is used and •● Interaction with key stakeholders to understand key challenges, opportunities and action points in further increasing the effective use of RE in buildings. Building sectors covered in this study include residential, commercial, and
institutional buildings, but excludes industrial buildings with process heating/cooling and electricity generation applications; and focuses on RE technologies (used/
installed within the building premises), which include solar Photovoltaics (PV), solar water heaters, solar concentrators, air-source heat pumps and biogas generation. 6. Passive design features include facing longer facades towards north and south direction, shading for
windows, wall and roof insulation, optimising window to wall ratio for maximising daylight utilisation and designing spaces for natural ventilation, etc. For details, please see http://www.beepindia.org/. 7. BEE star rated equipment and appliances, LED lighting, efficient chillers, heat recovery, free cooling,
radiant cooling, etc. For details, please see http://www.beepindia.org/.
1.3
Literature Review
1.3.1 History of global renewable energy use and its outlook
Renewable energy (mainly biomass) was the main source of energy till the year 1800, after which the use of coal as primary source of energy increased drastically and the share of fossil fuel (mainly coal) increased to ~50% by 1900. After 1900, crude oil and natural gas production started increasing and contributed to ~56% of the total world primary energy consumption in the year 2000, while the share of renewable energy decreased to ~20%.9
Figure 4 : Share in total primary global energy consumption
0% 10% 20% 30% 40% 50% 60% 70% 80% 90% 100% 1800 1820 1840 1860 1880 1900 1920 1940 1960 1980 2000 2020 Renewable Energy (% share) Fossil Fuel (% share)
While the share of renewable energy in the overall energy consumption has decreased, the overall energy consumption has increased rapidly in recent years. Total primary energy consumption across the world has increased from ~364 EJ in 1990 to ~580 EJ in 2012, and projections by the U.S. Energy Information Administration suggest that it will rise to ~860 EJ in 2040.10
Going forward, it is noted that most predictions have projected a significant increase in primary energy consumption across the globe. At the same time, these studies also project a reversal in the trend of renewable use where it is expected to rise instead of drop as has occurred in the past. The International Renewable Energy Agency (IRENA) has developed a renewable energy roadmap11 (includes 40 countries,
representing 80% of the world’s total final energy consumption), with a target to double the renewable share in total primary energy supply (TPES) from ~18% at 2014 to ~36% in 2030, along with ten solutions to achieve it. The International Energy Agency (IEA), under the ●450 Scenario● (with a 50% chance of limiting global warming to 2°C)12, suggests nearly 60% of the electricity generated in 2040 to come
9. https://ourworldindata.org/energy-production-and-changing-energy-sources/ 10. http://www.eia.gov/outlooks/ieo/pdf/0484(2016).pdf
11. www.irena.org/DocumentDownloads/.../IRENA_REmap_2016_edition_report.pdf
12. http://www.iea.org/publications/freepublications/publication/World EnergyOutlook2016Executive SummaryEnglish.pdf
from renewables, almost half of this from wind and solar PV. The World Energy Council projected13 the renewable energy share to be 23.4% to 40.7% in TPES by
2050 under two different scenarios.
1.3.2 International Indian scenario: RE potential, target and achievement
As per the Ministry of New and Renewable Energy (MNRE), the total potential of all RE technologies in India is ~1100 GW14, out of which solar (~750 GW) has the
highest potential (~68%) followed by wind (100 meter hub height), small hydro and bioenergy, with potential of 27%, 2% and 2.2% respectively. The Government of India has set the target of renewable energy installed capacity of 175 GW by the year 2022, which includes 100 GW from solar (40 GW from Rooftop Solar and 60 GW through Large and Medium Scale Grid Connected Solar Power Projects), 60 GW from wind, 10 GW from bio-power and 5 GW from small hydro-power. Similarly, the target for the solar thermal collector installed area is set to 20 million m2 by 202215. As on
December 2015, India has installed 1020 MW of roof top solar capacity16, while the
SWH installation17 is 8.9 million m2.
1.3.3 Energy consumption in buildings
Different types of buildings have large variation in terms of overall energy consumption, types of equipment/appliances used, seasonal variation in demand, end-use energy break-up and space availability for RE systems. These variations in energy demand can be captured through the Energy Performance Index (EPI) in kWh/sq. m./year in terms of purchased and generated electricity divided by built up area in sq. m.
A survey conducted in India for multi-story middle class residential buildings (~1150 households) shows an average Energy Performance Index (EPI)18 of ~ 46
kWh/m2.y, while the energy consumption in the peak summer could be 2–2.3 times
as compared to that in the winter19 (Figure 5). The survey also shows that ~50% of
households have an EPI ranging from 20 to 50 kWh/m2.y (Figure 6), and that there is
also a trend in overall shift towards the higher EPI range.
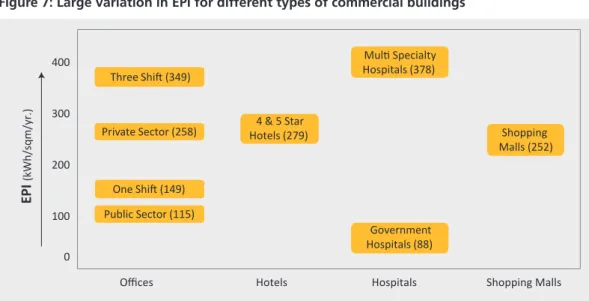
Another study conducted for ~800 commercial building (offices, hotels, hospitals and malls) shows an EPI ranging from 100 to 350 kWh/m2.y20 (Figure 7). The energy
requirement for cooling in all types of buildings remains the highest (30–60%), while the energy requirement for water heating is also significant (Please see Figure 3). Limited space availability, particularly in case of high-rise buildings, constrains the amount of energy that can be supplied by solar energy.
13. https://www.worldenergy.org/wp-content/uploads/2013/09/World-Energy-Scenarios_Composing-energy-futures-to-2050_Full-report.pdf
14. Annual report (2015–16), Ministry of New and Renewable Energy (MNRE) 15. Ibid
16. Bridge to India estimates as on September 30, 2016
17. http://mnre.gov.in/file-manager/annual-report/2015-2016/EN/Chapter%201/chapter_1.htm
18. Energy Performance Index (EPI) is measured in kWh/m2.y and it is the ratio of total annual electricity consumption (excluding the energy generated from renewable energy) for the building to its total built-up area (excluding the basements used for services and/or parking).
19. Household energy survey under Indo-Swiss Building Energy Efficiency Project (2012-16) 20. ECO-III Study on “Energy use in commercial buildings – National benchmarking study” (2011)
Figure 6: EPI distribution in high-rise residential buildings
Figure 5 : Comparison of Average Monthly Electricity Consumption
0 100 200 300 400 500 600 700
Jan Feb Mar Apr May Jun Jul Aug Sep Oct Nov Dec
kW h/m on th Composite Climate Warm-Humid 13% 15% 20% 13% 15% 5% 9% 11% 0% 5% 10% 15% 20% 25% <20 20-30 30 -30-40 40-50 50-60 60-70 70-80 >80 % of hou se ho ld EPI Band 100 0 200 300 400 EPI (kWh/sqm/yr.) One Shift (149) Three Shift (349) 4 & 5 Star Hotels (279) Multi Specialty Hospitals (378) Shopping Malls (252) Public Sector (115) Private Sector (258) Government Hospitals (88)
Offices Hotels Hospitals Shopping Malls
1.3.4 Building codes and rating systems
In recent years a number of organisations have developed green building standards and rating systems. These are typically voluntary certifications for residential, commercial and industrial buildings. A building code is developed to align closely with standards, and rating systems provide for guidelines on energy conservation and green construction techniques. As an example, the National Building Code (NBC) of India, contains administrative regulations, development control rules and general building requirements; fire safety requirements; stipulations regarding materials, structural design and construction (including safety); and building and plumbing services. The NBC also serves as a Model Code for adoption by all agencies involved in building construction works, be it the Public Works Departments, other government construction departments, local bodies or private construction agencies. The Bureau of Indian Standards (BIS) is responsible for the development of NBC, and the first edition of the NBC was published in 1970. In the later years, NBC has been revised as new construction techniques and buildings material became available, and its scope expanded to address new challenges, such as environmental sustainability. In India, Urban Local Bodies (ULBs) and development authorities have their own building bylaws which are mandatory for all construction within their jurisdiction. The local building bylaws are usually based on the National Building Code, which serves as model code providing guidelines for regulating building construction activity. In recent years, the NBC has integrated aspects of thermal comfort, energy efficient design and integration of renewable energy. In 2007, another code, called the Energy Conservation Building Code (ECBC) was developed by the Bureau of Energy Efficiency (BEE), and it is aimed at energy-efficient designs of commercial buildings. Apart from integration of solar water heating, the ECBC does not address the issue of renewable energy integration in buildings. Some states have made the ECBC mandatory, paving the path for its integration in local building bylaws. A revised ECBC with more provisions for Renewable Energy is also under development. In addition to building bylaws and codes, several green building ratings systems have come into effect during the last 15 years. They promote green concepts and techniques in the building sector to address issues like water efficiency, energy efficiency, handling of waste and conserving natural resources. The green building rating systems available in India include the India Green Building Council (IGBC) part of the Confederation of Indian Industries (CII), Leadership in Energy and Environmental Design (LEED) for applications registered under Green Building Council of India (GBCI), Green Rating for Integrated Habitat Assessment (GRIHA) which was founded by The Energy Research Institute (TERI), and Excellence in Design for Greater Efficiencies (EDGE) which is promoted by the International Finance Corporation (IFC).
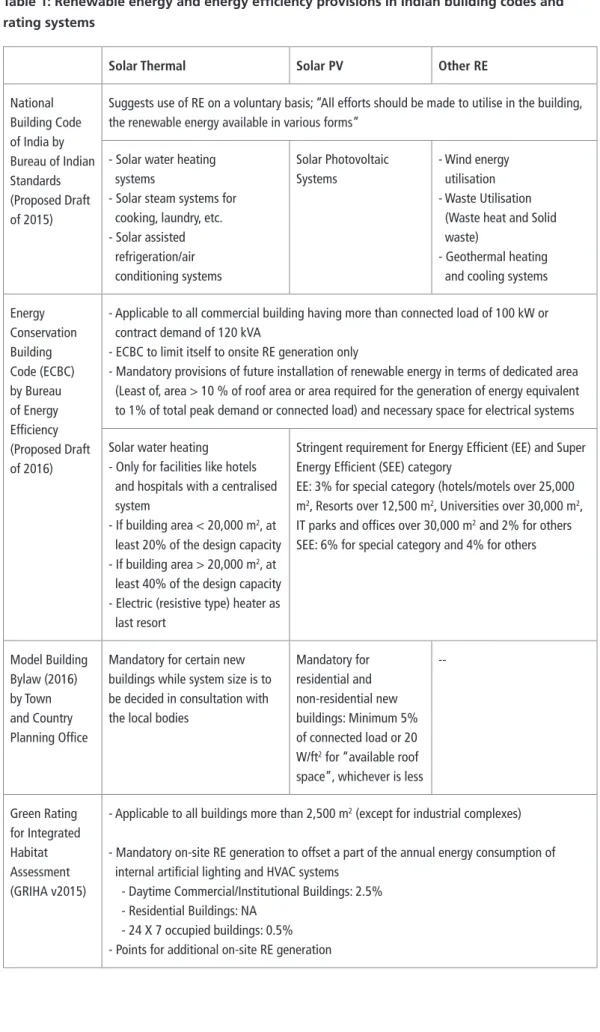
A comparison of provisions for RE systems in building codes and green building rating systems are presented in Table 1.
Table 1: Renewable energy and energy efficiency provisions in Indian building codes and rating systems
Solar Thermal Solar PV Other RE
National Building Code of India by Bureau of Indian Standards (Proposed Draft of 2015)
Suggests use of RE on a voluntary basis; “All efforts should be made to utilise in the building, the renewable energy available in various forms”
- Solar water heating systems
- Solar steam systems for cooking, laundry, etc. - Solar assisted refrigeration/air conditioning systems Solar Photovoltaic Systems - Wind energy utilisation - Waste Utilisation (Waste heat and Solid waste)
- Geothermal heating and cooling systems Energy Conservation Building Code (ECBC) by Bureau of Energy Efficiency (Proposed Draft of 2016)
- Applicable to all commercial building having more than connected load of 100 kW or contract demand of 120 kVA
- ECBC to limit itself to onsite RE generation only
- Mandatory provisions of future installation of renewable energy in terms of dedicated area (Least of, area > 10 % of roof area or area required for the generation of energy equivalent to 1% of total peak demand or connected load) and necessary space for electrical systems Solar water heating
- Only for facilities like hotels and hospitals with a centralised system
- If building area < 20,000 m2, at least 20% of the design capacity - If building area > 20,000 m2, at least 40% of the design capacity - Electric (resistive type) heater as last resort
Stringent requirement for Energy Efficient (EE) and Super Energy Efficient (SEE) category
EE: 3% for special category (hotels/motels over 25,000 m2, Resorts over 12,500 m2, Universities over 30,000 m2, IT parks and offices over 30,000 m2 and 2% for others SEE: 6% for special category and 4% for others
Model Building Bylaw (2016) by Town and Country Planning Office
Mandatory for certain new buildings while system size is to be decided in consultation with the local bodies
Mandatory for residential and non-residential new buildings: Minimum 5% of connected load or 20 W/ft2 for “available roof space”, whichever is less
--Green Rating for Integrated Habitat Assessment (GRIHA v2015)
- Applicable to all buildings more than 2,500 m2 (except for industrial complexes) - Mandatory on-site RE generation to offset a part of the annual energy consumption of internal artificial lighting and HVAC systems
- Daytime Commercial/Institutional Buildings: 2.5% - Residential Buildings: NA
- 24 X 7 occupied buildings: 0.5% - Points for additional on-site RE generation
IGBC Green Homes Rating System (v2.0)
Applicable for new and major renovated residential buildings including hostels, service apartments, resorts, motels and guest houses
Not mandatory; credit points for SWH system
- Minimum demand: 20 L/ (person.day)
- Hot water through SWH system as a percentage of total hot water requirement of the building
- Not mandatory; credit points for RE system
- Renewable energy as a percentage of total connected load of the building
- Different percentages for Individual Residential Unit and Multi-dwelling Residential Units IGBC Green
New Buildings Rating System (v3.0)
- Applicable for air-conditioned/non air-conditioned buildings including offices, IT parks, banks, shopping malls, hotels, hospitals, airports, stadiums, convention centres, educational institutions (colleges, universities), libraries, museums, etc.
- Divided in owner-occupied and tenant-occupied buildings
-- - Not mandatory; credit points for RE system
- On-site Renewable Energy: Renewable energy as a percentage of total annual energy consumption of the building
- Off-site Renewable Energy: Percentage of off-site Renewable Energy generated to the total annual energy consumption of the building
- Different percentages for owner-occupied and tenant-occupied buildings
Some of the key observations that are very relevant for the present study derived from the review of building codes and green building rating systems suggest that:
•● Both ECBC and model building bye-laws make use of RE mandatory for certain types of buildings, though the RE mandates remain small in comparison to the overall energy consumption of the building. Although both ECBC and model building bylaws mandate RE, there is a lack of coherence between the two. As seen from the above table, the ECBC guidelines focus mainly on solar water heating applications and energy efficiency measures mostly for commercial buildings, whereas the model building bylaws allow for use of other RE systems as well.
• Green Building Rating systems:
o While use of RE is mandatory in certain types of buildings in GRIHA, RE integration in buildings is not mandatory in IGBC rating systems. However, there are credit points for RE integration.
o There is large variation in terms of RE system size and associated points; in some cases it is based on installed capacity and in other cases it is based on energy generation.
2.1
RE Technologies
A few renewable energy technologies are suitable for use in buildings. Technologies like solar PV and solar water heating have been used and accepted widely across buildings. Technologies like on-site wind generation and geothermal energy (heating/cooling) have been used in some buildings, but the application has been restricted due to limited resource availability or high costs of RE integration in buildings.
In the present study, technologies that have relatively higher probability of use in Indian buildings have been considered. These are:
1. Solar photovoltaic technologies for electricity generation
2. Solar thermal technologies for end-use applications of water heating, cooling and cooking (Table 2)
3. Heat pumps
4. Waste to energy systems (Biogas plants)
Table 2: Application of solar thermal technologies in buildings
Solar Thermal Technologies Applications/End Use Types of Buildings
Solar water heaters Water heating for bathing,
cleaning, laundry, etc. Residential, Hotels, Institutions Concentrated solar thermal
technologies
Steam generation for cooking or
other utilities like laundry, etc. Institutions, Hotels Solar water heaters, Concentrated
solar thermal technologies
Hot water/steam generation for space cooling
Commercial buildings (hotels, hospitals, offices), Institutions
2.1.1 Solar photovoltaic technologies
Solar photovoltaic (PV) technology enables direct conversion of sunlight into electricity. Photovoltaic cells, commonly known as solar cells, are used to convert light (photon) into electricity. There are three types of solar cell technologies in the market, namely mono-crystalline, poly-crystalline and thin films. The output of the solar PV system varies based on the type of solar cells. Mono-crystalline and poly-crystalline cells generally have higher efficiency than thin film cells and require less roof area for the same system capacity.
The output of the solar PV system is integrated in buildings in four types of configurations as per building loads and operations. The details of these configurations are given in the Annexure 2.1. In addition to roof top solar PV systems, a solar PV system can be installed as building-integrated photovoltaics
2 : Technologies, Business Models and
Case Studies
(BIPV). With BIPV, photovoltaic material replaces parts of the building envelope, such as the wall, roof, skylights, or facades. These can be incorporated into the construction of new buildings and retrofitted to existing buildings, and help achieving higher RE share in the overall building energy consumption. However, at present BIPV is more expensive compared to the roof top solar PV systems since the bulk of the savings on a BIPV arise from reduced mounting structures and offsetting traditional building materials. BIPV prices could reduce over time as market adoption increases.
Photovoltaic thermal hybrid solar collector:
These systems are sometimes also called hybrid PV/T systems. A hybrid system/panel combines the abilities of a solar panel and air heater. This allows a single panel to generate electricity and provide water heating through the same panel. Although this appears to be an effective method and efficient space usage, currently the cost of the system makes its usage prohibitive.
2.1.2 Solar Water Heating (SWH)
A solar water heater utilises global solar radiation and provides hot water (or working fluid) at a temperature of 40–80oC. Generally, there are 3 type of
technologies available in SWH systems:
1. Flat plate collector system (FPC) :
The Flat Plate Collector consists of an insulated metallic box with a toughened glass top. The metallic box contains an absorber sheet (normally made of copper) that has a selective coating to increase the absorption of solar energy. Vertical tubes made of copper, known as riser tubes, are attached to the absorber and carry the water to be heated. The riser tubes are connected to two horizontal tubes called headers, one placed at the bottom and the other at the top. The bottom header is used for flow of water into the collector, whereas the top header is used to take out the heated water.
2. Evacuated Tube Collector system (ETC):
The Evacuated Tube Collector consists of two co-axial glass tubes fused at both ends. The air between the tubes is evacuated to create vacuum that works as insulation. The outer surface of the inner tube forms the collector area and is selectively coated to increase the absorption of solar energy.
3. Evacuated tube heat pipe system:
In this type of evacuated tube, there is a pipe (usually made of copper) filled with a fluid of low boiling point. When the pipe is heated by the sun, the fluid boils and rises in the pipe due to the thermo-siphon effect. At the top, there is a connection of this heat pipe to a header pipe where this heat is transferred to the water flowing through the header pipe. The fluid in the heat pipe condenses on cooling and flows back to the bottom of the heat pipe. The SWH systems is primarily used in buildings for bathing and then for washing clothes and cleaning utensils. The details of SWH system integration in the buildings are given in Annexure 2.2.
2.1.3 Solar air conditioning
Solar air conditioning technology provides for an air conditioning (cooling) system to use solar power (passive solar, solar thermal or photovoltaic) sources to power the compressor. Solar air conditioning process can be classified in two categories, namely solar electric cooling systems and solar thermal cooling systems.
Solar electric cooling systems :
In solar electric cooling system, solar energy is absorbed and converted into direct current (DC) by a solar PV panel. This DC supply is then either used directly or converted into alternating current (AC) to run the compressor of a vapour compression system.
Solar thermal cooling systems:
Solar thermal cooling systems usually use concentrating solar collectors and absorption chillers. Solar concentrators are used to generate high pressure and temperate fluid which in turn is supplied to vapour absorption chillers. Absorption chillers use this solar-heated fluid to drive the refrigeration process.
The vapour absorption chillers21 could be classified as single effect, double effect and
triple effect absorption chillers. The efficiency of triple effect chillers is the highest. A comparison of these systems is presented in the Table 3.
Table 3: Comparison of absorption chiller technologies22
System Operating temperature (
oC) Working fluid Cooling capacity COP
Heat source Chilled water ton
Single effect 80 - 110 5 - 10 LiBr / Water 10 - 100 0.5 - 0.7
Double effect 120 - 150 5 - 10 LiBr / Water Up to 1000 0.8 - 1.2
Triple effect 200 - 230 5 - 10 LiBr / Water N/A 1.4 - 1.5
It can be seen from Table 3 that the higher the heat source temperature, the higher is the Coefficient of Performance (COP). The selection of solar concentrating technology depends on absorption chiller heat source requirements. The comparison of commercially available solar concentrator technologies is given Table 4.
Table 4: Comparison of solar concentrator technologies23
Motion Concentrator type Absorber type Concentra-tion ratio24 Output temperature range (oC) Single-axis tracking
Linear Fresnel reflector (LFR) Tubular 10 – 40 60 – 250 Parabolic trough collector (PTC) Tubular 15 – 45 60 – 300 Cylindrical trough collector (CTC) Tubular 10 – 50 60 – 300 Two-axes tracking Parabolic dish reflector (PDR) Point 100 – 1000 100 – 500
Heliostat field collector (HFC) Point 100 – 1500 150 – 2000
21. P. Srikhirin et al. 2001 — A review of absorption refrigeration technologies 22. P. Srikhirin et al. 2001 — A review of absorption refrigeration technologies 23. S.A. Kalogirou et al. 2004 — Solar thermal collectors and applications
24. Concentration ratio is defined as the aperture area divided by the receiver/absorber area of the collector
2.1.4 Heat pumps
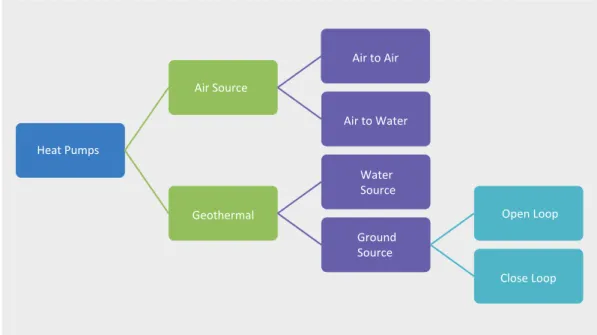
A heat pump is an electrical device that extracts heat from one place and transfers it to another. Heat pumps can be used for both cooling (e.g. refrigerator, air-conditioner) and heating (e.g. heat pumps for water heating, space heating) applications. A heat pump is a well-known and proven energy efficient technology for generating hot water or hot air. Heat pumps are of three types, namely air source, water source and ground source (Figure 8). Air-to-air and air-to-water are the two variations of technologies that come under air source heat pumps. Of these, air-to-water heat pumps are commonly used for water heating, unlike air-to-air heat pumps, which can be used for space heating. Geothermal heat pumps although more efficient (with a higher Coefficient of Performance) in comparison to air source heat pumps, are much costlier. However, ground source heat pumps have a greater life span of 25 years in contrast to the 10 to 15 years span of air source and water source heat pumps.25
Figure 8: Classification of heat pumps
25. Ruqun WU 2009 , Energy Efficiency Technologies, Air Source Heat Pump vs. Ground Source Heat Pump Heat Pumps Air Source Air to Air Air to Water Geothermal Water Source Ground Source Open Loop Close Loop
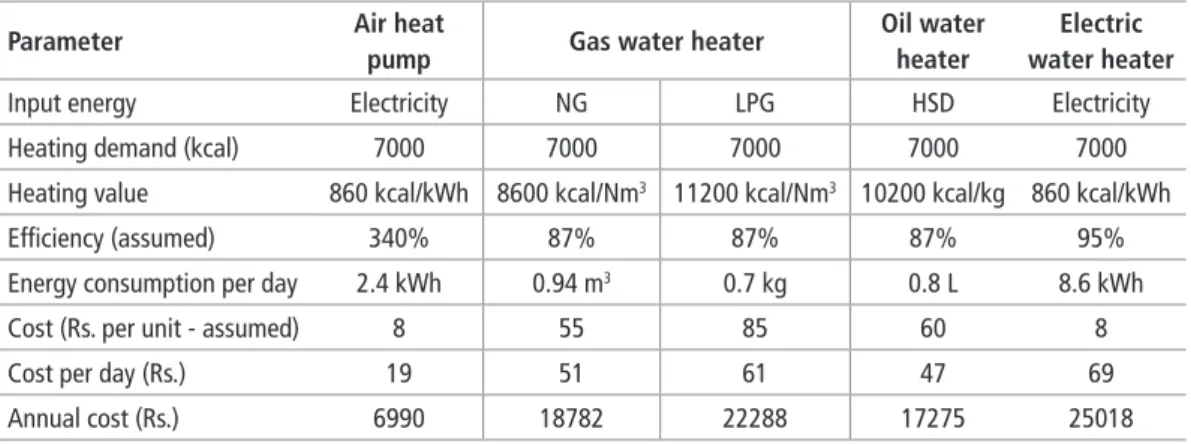
Some stakeholders from the manufacturing industry and commercial consumers have suggested that India has seen a rise in the use of air source heat pumps for residential and commercial buildings, however there is no available data repository to validate the same. Ground source heat pumps and water source heat pumps can work with high efficiency in moderate to extreme hot and cold temperature conditions, unlike air source heat pumps which work more efficiently in moderate temperature conditions. However, despite the variability in Indian climatic conditions that range from moderate to extreme heat and cold in various parts of the country, air source heat pumps have the highest market share amongst various types of heat pumps. A comparison of air source heat pumps with conventional water heating systems is presented in the Table 5.
Table 5 : Comparison of air source heat pumps and convention water heating systems Parameter Air heat
pump Gas water heater
Oil water heater
Electric water heater
Input energy Electricity NG LPG HSD Electricity
Heating demand (kcal) 7000 7000 7000 7000 7000
Heating value 860 kcal/kWh 8600 kcal/Nm3 11200 kcal/Nm3 10200 kcal/kg 860 kcal/kWh
Efficiency (assumed) 340% 87% 87% 87% 95%
Energy consumption per day 2.4 kWh 0.94 m3 0.7 kg 0.8 L 8.6 kWh
Cost (Rs. per unit - assumed) 8 55 85 60 8
Cost per day (Rs.) 19 51 61 47 69
Annual cost (Rs.) 6990 18782 22288 17275 25018
Note: Heating demand calculated for 200 L water heated from 15°C to 55°C
2.1.5 Waste to energy technologies
Large quantities of organic waste is generated in residential complexes, restaurants, hotels, hostels, industrial canteens, etc. This organic waste generated in buildings can be utilised using bio-methanation technologies. The organic waste is converted into bio gas which can then be used either for producing heat or electricity (by using it in an engine). While in case of industrial canteens and restaurants, it is possible to use biogas for cooking applications, in case of large residential complexes it may be more practical to use biogas for generating electricity, which in turn can be used for the operation of common services like corridor and outdoor lighting, water pumping, etc. The application of bio-methanation technologies not only help in producing onsite renewable energy, but also help in decentralised waste management, and therefore reduce the burden on city-level waste management systems.
2.2
Business Models
Many new and innovative business models support increased deployment of RE technology in buildings, and may be categorised into three main types (Figure 9).
Figure 9: Different types of business models26
26. MNRE/USAID/GERMI report on “Best practices manual for implementation of state level rooftop solar photovoltaic programme in India”, June 2016
CAPEX or End-user Owned OPEX or Third party owne
& operated Utility-Owned
• End user invests in RE system
• Energy generated is either used for internal consumption or exported to grid
• Financing for the system from banks / financial institutions • Design and deployment by
system integrators
• Third Party (e.g. RESCO) makes the investments, installation & responsible for O&M
• No investment and hassle free for end-user
• Agreement between third party and end-user on electricity generated (e.g. PPA for rooftop SPV)
• Supports lower cost financing, scale, technical expertise & efficient operation
• Investment by utility • Emerging business model –
mostly in developed countries for rooftop solar PV • RE System becomes an
integral part of the electricity supply and distribution infrastructure
CAPEX-OPEX model
2.2.1 CAPEX or end-user owned
This is the first-generation business model, where the building owner/user is responsible for the investment in the RE system. This investment could be 100% equity or a combination of debt (through banks / financial institutions) and equity. The energy generated by the RE system can either be used for self-consumption or export (e.g. net-metering with a solar PV system) to reduce energy bills or to generate revenue. The design and the deployment of the RE system is implemented by RE system integrators.
2.2.2 OPEX or third party owned and operated
This is the second-generation model, where a third party (e.g. RESCO) makes capital investments for the RE system, installs it and is also responsible for its operation and maintenance. The model is becoming popular in India as it addresses the key barriers of ‘high capital cost’ and ‘performance apprehensions’ of the RE system, and reduces the risks of the building owner. Third party can make the investment as 100% equity or a combination of debt (through banks / financial institutions) and equity. The model allows the third party to bring in lower cost financing, scale, technical expertise and efficient operation. The revenue/saving from the RE is shared by the third party and building owner/user which is done through an agreement between the third party and the building owner/user (e.g. PPA for rooftop SPV).
2.2.3 Utility owned
This is an emerging business model, mostly in developed countries for rooftop solar PV system. Here the investment is made by the utility through procurement contracts / direct investment on customer’s roof or financing support. PV becomes an integral part of the electricity supply and distribution infrastructure. The ownership, operation and maintenance of the RE system is carried out by the utility.
2.3
Case Studies
A few buildings with different typologies were studied to understand the several factors that contribute to successful integration of RE technologies and also understand their impact on overall energy consumption of the buildings. The following table enlists the case studies in brief.
Table 6: Details of various case studies
S. No Building Name Building Typology RE System Ownership/Business Model
1 Residential building - Najafgarh, Delhi
Residential — 3 storey (low-rise)
Roof top Solar PV (2 kWp, future plan to expand it to 5 kWp) Self-owned 2 Magarpatta City, Pune Residential — high-rise township
Solar Water Heater (8240 collectors, 10,30,000 LPD)
Self-owned; Cost included in the flat price
Maintenance by Magarpatta City Management
3 Royal Orange County, Pune
Residential high-rise apartments
- Solar water heater (SWH): 6500 LPD - Solar Photovoltaic (PV): 20 kWp (additional electricity supply)
Self-owned; Cost included in the overall building cost 5 year operation of SPV system by building developer
4 Lunkad Sky Lounge Society, Pune
Residential high-rise apartments
Roof top Solar PV - 12 kWp
Renewable Energy Service Company (RESCO) model Power Purchase Agreement (PPA): 20 years
@0.8 x Electricity tariff 5 Indian Habitat
Centre, New Delhi
Commercial — Office, High-rise, Multi-tenant/ owner
Roof top Solar PV (250 kWp)
RESCO model PPA: 25 years Unit cost: Rs. 5 per unit (Constant) 6 Aranya Bhawan, Jaipur Commercial — Public Office (Daytime operation)
Roof top Solar PV (45 kWp) Self-owned 7 NTPC Energy Technology Research Alliance, Noida Commercial — Office + Workshop (low-rise) -Solar concentrator based cooling: 40 TR; retrofitted; not integrated with conventional HVAC system
-Solar PV: 80 kWp
Solar Cooling: Self-owned Solar PV: Self-owned (30% subsidy from MNRE) Internal R&D
8 Radisson Blu, Pune Commercial — Hotel (high-rise)
Heat pump (air source) Capacity: 40 TR
Build Own Operate Transfer (BOOT) model — 15 months
9 Holy Family Hospital, New Delhi
Commercial — Hospital (low-rise)
Solar water heater (200 m2; 10,000 LPD)
RESCO model: 7 years’ contract
- Agreement: 51000 - gas bill (paid to RESCO operator) - Now self-owned 10 Thyssenkrupp Industries Ltd., Pune Industrial Biogas (250 kg/d of waste) Generation: 30–32 m3/ day
Self-owned, O&M with developer
Out of ten case studies, four are from the residential sector, five from the
commercial sector, while one is from the industrial sector. These case studies include six installations of SPV, three installations of SWH, and one installation each of solar concentrator, heat pump and biogas. Some of the case studies have multiple RE systems installed. Key observations and findings of these case studies are listed in Figure 10 below and explained in subsequent sections. Detailed information on all case studies is given in Annexure 1.
2.3.1 Influence of building typologies on RE potential and economics
Parameters like energy demand, energy usage pattern, roof space availability, and applicable electricity tariff varies significantly with building typologies. Therefore, the potential and the economics of the RE system varies with building typologies. For example, an energy efficient, low-rise residential building with lower energy demand and sufficient space available for an RE system has the potential to become a net/near zero energy building. Although, lower electricity tariffs for residential consumers lead to less attractive economics of the RE system. On the other hand, for a high-rise commercial building, electricity tariffs are higher, making the RE system financially more attractive. However, due to limited space and the high energy demand, only a small part of the total demand can be met through an RE system. It is estimated that almost 90% of the total built-up area of the country will be for residential buildings and hence the roof area available on residential buildings is much higher compared to commercial buildings. However, because of lower electricity tariffs, economics of roof top SPV systems is less attractive, even with net-metering. Though, capital subsidies for residential consumers, presently available from the Ministry of New and Renewable Energy (MNRE), can help make it more viable.
2.3.2 Need for innovative implementation models
Different types of building typologies and ownership patterns require different types of innovative business and implementation models for exploiting the full potential of RE integration in buildings. The example, an innovative implementation model for a high-rise, multiple-ownership residential building, is explained in Box 1. This model also promotes energy conservation and demand side management.
Figure 10: Key observations and findings of case studies
Low-rise (Up to 15-18m height) • Potential to become net-zero energy • SWH: Space is not a constraint; Financially more attractive if demand is round-the-year • SPV: Lower electricity
tariff; financially less attractive even with net-metering
High-rise (> 15-18m height)
• Limited space (Need to prioritize among RE technologies) • SWH: Distribution issues • SPV with net-metering: Financially attractive if commercial tariff applicable for part of building (e.g. common services in Pune township; net zero for
common services) • Innovation in
implementation model to encourage end-user for DSM; optimal use of energy from RE system (e.g. Royal Orange County, Pune)
Hotel/Hospital (24x7, 365 days use)
• Energy intense
- SPV: Can meet only part of the demand
- SWH in low-rise: Can meet most of the hot water demand (e.g. Holy Family Hospital, Delhi) • Limited space (high-rise) - Heat pumps financially
attractive (e.g. Hotel Radisson Blu, Pune; payback ~2 years) • RE integration financially
attractive
- SWH: Round-the-year demand
- SPV: High electricity tariff
Office/School/College (Day-use, 5-6 days/week)
• SPV with net metering financially attractive - Solar fraction can vary
significantly
• Solar concentrator based cooling is in demonstration stage
- Long payback period - Needs tailor-made
solutions
• Need for energy storage for non-operational days (thermal and/or electrical) - No need for electrical storage if it has net-metering
Buildings Residential
(~90% of total built-up area)
Commercial (~10% of total built-up area)
Box 1 :
Example of an innovative implementation model that incentivises electricity conservation and demand side management
Royal Orange County, Pune is a residential building complex of 9 –12 storey high buildings with 2 and 3 BHK homes. A 20 kWp SPV system (and 104 m2 of SWH
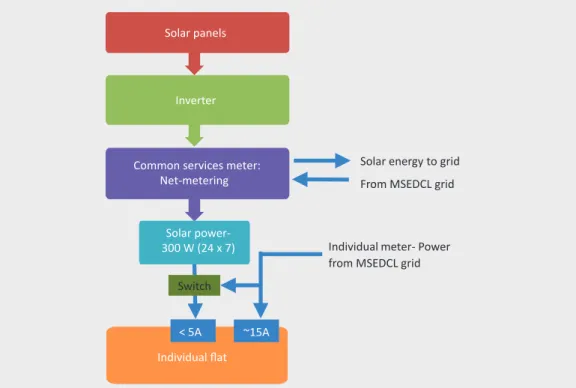
also) has been installed on one of the towers, which is 11 storey high and has 44 flats. All flats have been given dual electricity supply: one from the SPV system and other from the electricity grid (Figure 11).
Figure 11 : Schematic of electricity supply and SPV system at Orange County, Pune
The supply from the SPV system per flat is limited to 300 W. At any point in time when the household electricity demand remains below 300 W, the electricity can be supplied from the SPV system. The solar electricity is free for building occupants. Once household demand goes above 300 W, the electricity supply switches from the SPV system to the electricity grid, and electricity is charged to the end-user at the applicable utility tariff. The end-user can observe if they are getting electricity from the SPV or the electricity grid. With this arrangement, end-users always try to maintain their electrical load below 300 W, by minimising wastage of electricity and managing their electricity usage pattern. This also make the end-user aware of the energy usage and gives them a good incentive (minimum electricity bill to be paid if demand remains below 300 W) to use electricity consciously.
Solar panels
Inverter
Common services meter: Net-metering
Solar power-300 W (24 x 7)
Individual flat
Solar energy to grid From MSEDCL grid
Switch
Individual meter- Power from MSEDCL grid
~15A < 5A
2.3.3 Using RE for meeting hot water demand in hotels and hospitals
The commercial viability of RE technologies like SWH and heat pumps is higher in case of commercial buildings such as hotels and hospitals which have round-the-year hot water demand, and have higher electricity tariff or use costly petroleum fuels like diesel for water heating. For low-rise commercial buildings where
sufficient roof space is available, the SWH system can meet most of the hot water demand (Box 2 – Holy Family Hospital). For high-rise buildings where the space is limited, heat pumps (Box 2 – Radisson Blu) or a combination of an SWH and a heat pump can meet the hot water demand.
Box 2 :
SWH for commercial building having round-the-year hot water demand
Holy family hospital (HFH), New Delhi is a 332 bedded multi-specialty hospital, having hot water demand round-the-year. A 200 m2 of SWH system (Figure 12) has been installed on the rooftop with backup heating by gas boilers, to meet the hot water demand. SWH system was installed under RESCO model and handed over to HFH after completion of 7 years of contract with RESCO. HFH could save 40% of water heating expenses during RESCO contract period and could also retain SWH system after completion of contract. Based on information shared, it is estimated that ~80% of the hot water demand is being met by the SWH system.
Figure 12 : SWH system at Holy Family Hospital
Figure 13 : Heat pump and Radisson Blu Hotel
Similarly, in case of Radisson Blu hotel, Pune (5 storey building with 220 rooms), the hot water demand remains round-the-year, the area on the rooftop was not available for SWH system installation. An air source heat pump of 40 TR (138.4 kW) capacity has been installed (Figure 13) to meet the hot water demand for bathing and kitchen applications. The space needed for heat pump (excluding storage tank) is only ~2 m2. Since, it runs on electricity therefore no backup heating is needed and it consumes 3-4 times less electricity as compared to electric (resistive) heaters.
2.3.4 Key role of third party ownership RESCO model
Third party ownership (OPEX) model (e.g. RESCO model) is key to overcome two major barriers: high capital cost and uncertainty/doubt in RE technology
performance. The case-studies covered four projects that were done under the RESCO model (Box 3). From the end-user perspective, it is almost zero risk and zero investment, and they can get energy at a lower cost as compared to conventional sources. For the end-user, this also eliminates the burden of O&M of the RE system. However, for a third-party owner (RESCO), raising finances for investing in projects is difficult, which limits their ability to undertake multiple projects.
Box 3 :
OPEX model a key for RE system installation up-scaling
Out of ten case studies, four (Lunkad Sky Lounge Society Pune, Indian Habitat Centre New Delhi, Radisson Blu Pune and Holy Family Hospital New Delhi) follow the RESCO model. In all four cases, the end-user did not have to invest any capital cost for the installation of the RE system and they could save their energy cost from day one of the installation. Also, the operation and maintenance of the system is done by third party (RESCO) which makes this model more attractive for the end-user.
These case studies cover residential, office, hotel and hospital buildings and include SPV, SWH and heat pump technologies. This suggests that the OPEX model can play a major role in up scaling of RE system installations.
2.3.5 Importance of fully functional net-metering regime
Net-metering arrangements (Box 4) help the end-user to overcome the additional cost and maintenance related to energy storage in electric batteries and eliminates wastage of energy generated during non-operational days. Hence, net-metering improves the economics of solar PV systems.
Box 4:
Net-metering could be a big boost for roof top SPV system installation
One of the key challenges for SPV systems remains the electricity storage which is usually set up with batteries. In case of locations where the availability of grid electricity is good, opting for net-metering not only improves the techno-economic feasibility of the system but also reduces the operation and maintenance cost (replacement of batteries).
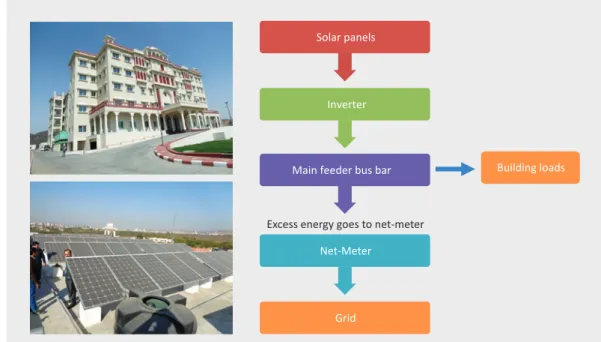
Aranya Bhawan, Jaipur has a 45 kWp SPV system with a net-metering system (Figure 14). Initially, a 26 kWp system was installed without net-metering and energy storage. Hence, they were not able to utilise the energy generated during weekends and holidays, and almost 30% of the SPV generated energy was being wasted. After the capacity addition and net-metering arrangement was in place, they could fully utilise the SPV generated electricity. During weekdays, the electricity is consumed within the building, while during the weekends/holidays, the electricity is exported to the grid and they pay only for the net electricity (electricity taken from the grid – electricity exported to the grid) consumed. It is estimated that ~20% of the annual electricity requirement of the building would be met by the SPV system.
Lunkad Sky Lounge Society, Pune which is a residential high-rise apartment building, also has an SPV system installed in RESCO mode with similar benefits.
2.3.6 Importance of planning RE integration during building design and benefits of planned maintenance
Planning RE integration with building construction ensures optimal implementation and operation of the RE system and reduces its cost. An example of a small scale PV system installed during the construction at a household (Najafgarh house) helped the end-user to get all the electricity required (water pumping and lighting) during the house construction from the solar PV system and helped meet part of the energy demand post construction (Please see Annexure 1 for detailed information). Similarly, in a large township (Magarpatta City, Pune; Box 5), installation of SWH system during the construction ensured that all households got hot water from RE by paying a small additional amount during house purchase.
Figure 14: SPV system at Aranya Bhawan, Jaipur and its schematic
Solar panels
Inverter
Main feeder bus bar
Net-Meter
Grid
Building loads
Box 5:
RE system (particularly SWH) integration during construction stage and having a proper maintenance arrangement gives optimal results
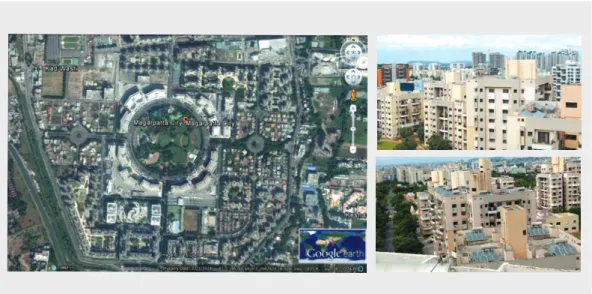
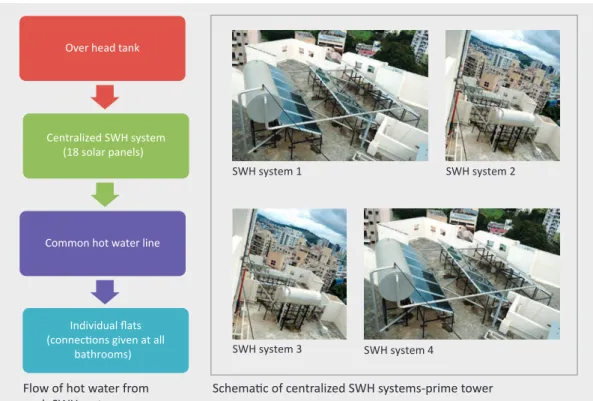
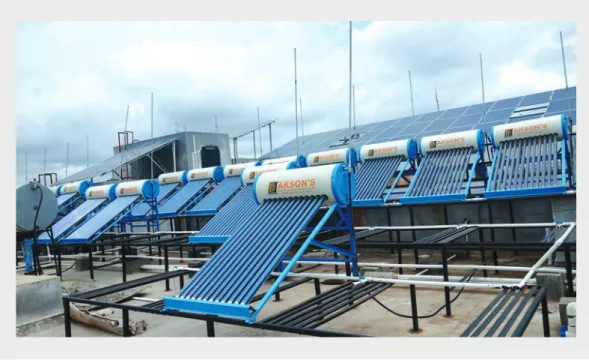
Magarpatta city, Pune is large township (~600 acre of land) which has residential and commercial buildings. All the households in this township have a provision of hot water system through SWH system (Figure 15). A total of 8240 solar hot water panels were installed in the entire township till date, having a solar collector area of 16,480 m2. Individual the SWH system was provided with individual housing while a centralised SWH systems was provided in a multi-storey building (one system for each wing of tower).
Figure 15: SWH system at Magarpatta city, Pune
But the most important thing is that SWH system integration was planned during the construction stage itself. Purchasers of houses had to pay only a small additional upfront cost for the SWH system. All the bathrooms of the flats were provided with solar hot water connections with all the piping work done during the building construction. This ensured proper integration of the SWH system, which ensured proper operation of the system and reduced maintenance requirement. Further, the Magarapatta city property management is carrying out the operation and maintenance for the SWH system, and hence ownership of SWH is totally hassle free for the house owners. A few of the residents we talked to were very happy with the performance of the SWH system, and it is estimated that ~80% of their hot water demand is being met by the SWH system.
2.3.7 Prioritising between Solar Photovoltaic (SPV) and Solar Water Heating (SWH)
As buildings become taller, space availability on the roof has increasingly become a limiting factor for RE system capacity. A common point of debate is related to the choice of technology best suited to make maximum benefit of the available space. Typically the debate is focused on deciding whether to install an SWH or SPV system or a combination of both. More often, SWH systems have received priority in installations as many urban local bodies have been supporting and mandating the installations of SWH systems for over a decade, whereas subsidies and schemes for solar roof top PV have entered the markets very recently. Case studies for buildings which have year-round hot water demand (≥9 months) show that these
systems have a shorted payback period for SWH systems. This has been observed in two case studies (Residential: Orange County, Pune and Hospital: Holy Family Hospital, Delhi) where the roof area was first utilised for SWH system installation to meet the hot water demand, and the remaining area was later used for SPV system installation. With newer technology there are two technology options that can be used to address this concern. Using a solar PV system for electricity generation in combination with air source heat pumps for water heating can be an efficient space utilisation strategy. Also, the new solar hybrid panel technology can support water heating and electricity generation in the same available space.
Almost 40% of the total energy today is utilised by the building sector and it is set to rise rapidly as the building stock in India grows by leaps and bounds each year. The innovative applications and business models discussed above show that using renewable energy in retrofit mode and design stage can help in significantly reducing the energy demand of buildings. These RE integration practices in buildings emphasise that not only does RE integration in buildings provide long term savings but also that it enhances a comfortable living experience.
The Government of India has a target of 40,000 MW of solar rooftop PV capacity to be installed by 2022, and as on September 2016, only 1020 MWs27 of solar
rooftop PV systems have been installed. Similarly, the targeted solar water heater installation is 20 million sq. m. of which 11 million sq. m. have been installed by 2016. Several national and state/local policies today require that greater amounts of energy are generated using a renewable energy source; the various targets set by the Government of India, building codes and green building rating systems are a step forward in this direction. According to the recent U.S. Green Building Council Report28, India has approximately 15.90 million gross square meters of space
certified to LEED of a total 644 projects. The other two major green building rating systems, IGBC and GRIHA, also have large areas of buildings certified. The following chapter discusses the policy and regulatory framework that support RE integration in buildings and highlights barriers or constraints in full scale RE integration in buildings.
3.1
Central Government/State Policy and Regulatory Framework
for RE Technologies
Most of the policies/programmes which promote RE technology use in buildings have focused on solar water heating and in the recent years on solar roof top PV integration. A few other technologies that have the potential to be readily integrated in buildings to offset energy consumption have not had as much policy-regulatory attention for a variety of reasons including high costs, lack of awareness, etc. The following section details the policy-regulatory framework for some of the RE technologies being used in buildings.
3.1.1 Solar water heaters
MNRE, state and municipal governments have tried three types of policies to promote integration of solar water heaters into buildings.
3 : Policy/Regulatory Environment for
RE in India
27. BTI Solar Rooftop Map 2016: http://www.bridgetoindia.com/reports/india-solar-rooftop-map-2016-edition-2/
3.1.1.1 Capital subsidies
For a long time, one of the major incentives for installing SWH was a capital subsidy from the MNRE. The capital subsidy was introduced in the 1990s but was discontinued towards the end of the decade. It was again reintroduced with the launch of the Jawaharlal Nehru National Solar Mission (JNNSM) in 2010, however, it was again discontinued from October 2014.
3.1.1.2 Building bylaws for mandatory use of solar water heaters in buildings The Ministry of Urban Development had issued a government order and model building bylaws in 1999 for mandatory installation of solar water heaters in certain types of buildings. The buildings covered were hotels, hospitals, hostels, rest houses, canteens, residential institutes, and residential housing. Since then, around 20–25 state/UTs have issued notification in this regard, and around 100 municipal corporations and urban local bodies have incorporated the mandatory use of SWHs in their building bylaws. However, except for a few cities, its implementation has not been as effective as desired because of multiple reasons such as:
•● Limited technical know-how of SWHs among the Urban Local Bodies (ULB) officials who were responsible for the implementation of the regulation
•● Absence of technical guidelines for ULB officials on SWH system sizing and their installation for different categories of buildings which at many places resulted in installation of under-sized systems or poor quality installation
•● The end-users not being convinced about the utility of SWH in regions or
building types, where the hot water demand is limited, e.g. residential buildings in some of the northern states where the hot water demand is only during few winter months and during these months, due to fog, available solar insolation is less which puts a question mark on the utility of SWH systems
There are some examples of success in cities such as Bengaluru, Pune and Rajkot where there is a demand for hot water for a large part of the year and
implementation has been quite effective. The success can be attributed to factors such as active role of ULBs (mandatory regulations as well as promotions and incentives), high level of user appreciation and awareness, strong SWHs supply and after sales service chain, and the presence of a good number of reference installations in various types of buildings. Recently, the Ministry of Urban
Development issued model building bylaws 2016, in which both Solar PV as well as SWH systems have been mandatory in various types of buildings. The new building bylaws do not address the issue of choice between SWH and Solar PV systems in buildings having limited roof availability for installation of both the RE systems. 3.1.1.3 Rebate in electricity bill for installation of SWHs
In an effort to reduce the peak demand load in the electricity grid, particularly during the winter mornings when geysers in all the buildings are simultaneously switched on, electricity distribution companies in some of the states/cities
(e.g. Rajasthan, Uttarakhand, Bengaluru, etc.) are offering rebates in electricity bill for installation of SWHs. For example, in Karnataka, a rebate of Rs. 0.50 is being extended in the electricity bills per unit of consumption subject to a maximum of Rs. 50, and in Rajasthan the scheme allows every SWH user to receive a rebate on their electricity bill of Rs. 0.25/kWh, capped at a maximum of Rs. 300 per month independent of the age of the system.