British Journal qf Nutrition (1995), 74, 289-302 ~289
Determination
of
digestible energy values and fermentabilities
of
dietary fibre supplements:
a
European interlaboratory study
in
vivo
BY G. LIVESEY', T. SMITH', B. 0. EGGUM2, I. H.TETENS2*, M. NYMAN3,
M. R O B E R F R O I D 4 , N . D E L Z E N N E 4 , T. F. S C H W E I Z E R 5 A N D J. DECOMBAZS Institute of Food Research, Norwich Laboratory, Norwich Research Park, Colney,
Norwich NR4 7UA
National Institute of Animal Science, Research Centre Foulum, PO Box 39, 8830 Tjele, Denmark
The Chemical Centre, Lund University, PO Box 124, 221 00 Lund, Sweden
Department of Pharmaceutical Science, Catholic University of Louvain, U C L 7369, 1200 Brussels, Belgium
Nestlk Research Centre, Nestec Ltd., Av. Nestle' 55, 1800 Vevey, Switzerland (Received 23 March 1994 - Revised 6 June 1994 - Accepted 7 June 1994)
The performance of methods to determine energy conversion factors for dietary fibre (DF) supplements and fermentability ( D ) values of their non-starch polysaccharides (NSP) was investigated. Heats of combustion, digestible energy (DE) and D values were determined on five DF supplements in five European laboratories on five separate occasions. In each instance the DF supplements were fed to juvenile male Wistar rats at two doses, 50 and 100 g/kg basal diet, for 3 weeks with food and faeces collected in the 3rd week. Among-laboratory variations in heats of combustion (AHc) were < 2%. DE values (kJ/g dry weight) at the upper and lower doses respectively were: 104 and 9.9 for a high-methoxyl apple pectin, 9-5 and 9.4 for a sugar-beet DF supplement, 122 and 12.7 for soyabean DF supplement, 3.8 and 4.0 for maize bran, and 0.3 and 0.3 for Solka-floc cellulose. Variations among laboratories, among occasions and among animals were < 1, < 2 and < 2.5 kJ/g respectively. The among- occasion: among-laboratory variance ratio for DE was 05, suggesting the method performed equally well in all laboratories. There was no evidence of learning or fatigue in the performance of the method. D values were also independent of dose and at the high and lower doses were: pectin 0.92 and 0.95, sugar- beet NSP 0.68 and 0.68, soyabean NSP 0.86 and 0.88, maize bran 0.17 and 0.18, cellulose 0.07 and 0.06. Among-laboratory variance tended to increase with decreasing fermentability and ranged from 0.03 to 0.18. The DE and D data were not significantly different from a previously proposed relationship DE = 0.7 x AHc x D, where AH, is the heat of combustion of the supplement. We conclude that while the among-laboratory variation in the D of diacult-to-ferment NSP is too large for the reliable prediction of energy value the method for the direct determination of DE is both reproducible and repeatable, that DE is independent of dosage of DF supplement up to 100 g/kg diet, and that it is safe to discriminate between energy values with a precision of 3 kJ/g. The conversion of both DE and D to net metabolizable energy for the purpose of food labelling, tables and databases is described.
Food energy value: Fermentation: Non-Starch polysaccharide : Dietary fibre
Non-starch polysaccharides (NSP) are the main constituents of dietary fibre (DF) or unavailable carbohydrate (British Nutrition Foundation, 1990). The contribution of these carbohydrates to whole-body energy metabolism in humans and rats is small but is measurable (Harley et al. 1989; Johnson et a/. 1990; Livesey, 1990) and is supplied via
* Present address: Research Department of Human Nutrition, The Royal Veterinary and Agricultural University, Rolighedsvej 25, DK- I958 Fredriksberg C, Denmark.
290 G . LIVESEY A N D O T H E R S
fermentation in the large intestine. How well the determinations of fermentability ( D ) of NSP and energy value of D F supplements compare in different laboratories and whether there is a relationship between the two values are questions addressed by the present study. Human studies performed in different laboratories with various amounts and sources of unavailable carbohydrates for which energy values have been derived have yielded varied results (Southgate & Durnin, 1970; Goranzon et al. 1983; Goranzon & Forsum, 1987; Wisker et al. 1988; Miles, 1990). Based on an analysis of the world literature on over thirty such mixed diets eaten by humans in the Western world, the unavailable carbohydrate contributes an average of about 8 kJ/g to digestible energy (DE; Livesey, 1991). However, different forms or sources of unavailable carbohydrates were suggested to have values in the range 0-12 kJ/g (Livesey, 1992). The precise value for any one source was proposed to be related to its susceptibility to fermentation (Livesey, 1990, 1992; Roberfroid et al. 1993). Nevertheless, because energy is lost to faeces, predominantly as unfermented carbohydrate and as bacterial biomass, all these DE values (DEV,) are less than the 17.5 kJ/g value for available starch. A further amount of energy is lost during fermentation as heat and combustible gases; so it is thought that only about 50 % of the unavailable carbohydrate fermented is recoverable as net metabolizable energy (NE, ; British Nutrition Foundation, 1990; Livesey, 1992). A further possible route of energy loss is to urine, but such losses are usually ignored as they are either negligible (Livesey, 1990) or may be slightly reduced by unavailable carbohydrate (Brown & Livesey, 1994).
While knowledge about the availability of energy from unavailable carbohydrates has become clearer in recent years, it is not reflected in European Food Labelling Regulations, which have not yet assigned an energy value to this class of dietary fuel (European Council Directive, 1990). This situation contrasts with undigested oligosaccharides and sugar alcohols that partly undergo fermentation in the large intestine. For example, sugar alcohols have been assigned an average energy value of 10 kJ/g (European Council Directive, 1990).
Acceptance of energy values for unavailable carbohydrate in food labelling regulations, tables and databases requires energy evaluation methodology that is recognized by academic and commercial organizations and by regulatory authorities. The performance of such methods, therefore, needs to be tested and its use standardized among different laboratories. The degree of agreement between laboratories on the energy values of different preparations provides the limits on the accuracy and precision with which energy values can be assigned. However, until now no such interlaboratory study of method performance has been reported,
The primary aim of the present study was to determine how reproducible the determinations of energy value and D would be in different laboratories throughout Europe and to determine the replicability of these determinations within laboratories. The second aim was to establish whether the extent of fermentation of NSP predicts the availability of energy from NSP-rich DF supplements. The third aim was to provide standard energy and
D values for five DF products and their NSP content respectively, which would help in the development of an in vitro method that predicts in vivo D and energy values (see accompanying paper, Barry et al. (1995)).
The rat was chosen for these investigations since we concluded that observations with the rat corresponded reasonably closely to observations with humans when NSP fermentability was determined (Nyman et al. 1986; Livesey, 1992; Bach-Knudsen et al. 1994). Five European laboratories were invited to participate, from Belgium, Denmark, England, Sweden, and Switzerland. Each laboratory determined the D of N S P and DEVs of each of five different D F supplements. The supplements had been selected for their minimal starch content and wide range of D from about 0 to about 100%. The sources chosen were a high-
D I E T A R Y F I B R E , E N E R G Y A N D F E R M E N T A T I O N IN V I V O 29 1 methoxyl pectin from apple, sugar-beet D F supplement, soyabean D F supplement, maize bran and Solka-floc cellulose. Because there is little information in the literature on the dependency of energy values and
D
on dietary dosage with D F supplements, each laboratory made these determinations at two dose levels. Further, by making replicate observations on five consecutive occasions an assessment was made of whether increasing experience (learning or fatigue) in execution of the methods affected the results. This was important since the protocol and analytical methods used were new to most of the researchers and technical staff involved.M E T H O D S
Materials
Apple pectin was ' slow-set ' high-methoxyl pectin kindly provided by Sanofi Bio-Industries
(66 Avenue Marceau, 75008, Paris, France). Soyabean D F was 'FIBRIM 2000 (red)' from Protein Technologies International (16A, Princewood Road, Earstree Industrial Estate, Corby, Northants). Sugar-beet D F was Betafibre kindly provided by British Sugar plc, Peterborough, Cambs. Maize bran was from Honeyville Grain Inc., 4380W, 2100 South, Salt Lake City, Utah 84120, USA. Cellulose was Solka-floc, grade BW 2030, from Jurgenson and Wettre Ltd., Johnson House, Wellington Road, Wokingham, Berks.
Diets
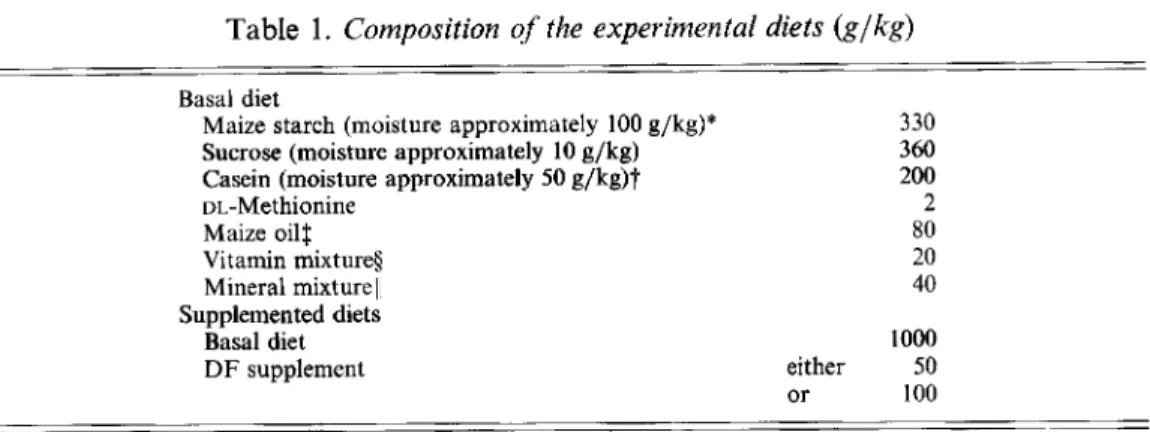
The composition of the basal diet to which the D F supplements were added was as shown in Table 1. The basal diet was free of NSP and test diets were prepared by adding D F supplements at the rates of 50 and 100 g/kg basal diet. All the diets were prepared and distributed from one laboratory.
Animals
Male Wistar rats (70-130 g) obtained from local suppliers were used: for Belgium and Switzerland they were from Iffa Credo, Lyon, France; for Denmark from Mollgaards Breeding Centre, Lille Skensved, Denmark; for England from A. Tuck and Son, Battlebridge, Essex ; and for Sweden from ALAB, Sollentuna, Sweden. Animals were allocated randomly to dietary treatments, kept at 20-24" and relative humidity 4&60 %, had light for 12 h daily from approximately 06.00 hours and had water ad lib.
Experimental design
Each of the five laboratories determined the DEV8 (equations 1 and 2, p. 292) of the five D F preparations at two dietary doses on five occasions. On each occasion two rats per D F source and dose received a test diet and four rats the control diet. This produced an experimental design with 500 observations (five laboratories x five D F supplements x two doses x five occasions x two rats). Animals from the first three occasions were also used to determine D for NSP (equation 3, p. 293) and produced a total of 300 observations (5 x 5 x 2 x 3 x 2 ) .
On each occasion each laboratory housed twenty-four rats singly in cages with wire-mesh floors. Feed (stock feed as usually used in each laboratory) was withdrawn from animals for 16 h before feeding the experimental diets. Experimental diets were provided at 10.00 hours each day for 21 d ; basal diet alone was fed to four rats and each of the five DF- supplemented diets at each dosage was fed to two rats. Spilt food was collected daily for each animal and a fresh weight of the amount spilt was returned to the animal in the next day's ration. Each day the animals received spill-weight from the previous day plus 15 g basal diet or 15.8 g low-dose-DF diet or 16.5 g high-dose-DF diet. In some laboratories the
292 G . L I V E S E Y A N D O T H E R S
Table 1 . Composition of the experimental diets (glkg)
Basal diet
Maize starch (moisture approximately 100 g/kg)* Sucrose (moisture approximately 10 g/kg) Casein (moisture approximately 50 g/kg)t DL-Methionhe Maize oil$ Vitamin mixture9 Mineral mixture11 Supplemented diets Basal diet DF supplement 330 360 200 2 80 20 40 1000 either 50 or 100 ~~
* The starch was 'Snowflake' maize starch from Corn Products Ltd., Manchester; in addition there was
t
Casein was edible casein, mesh 30, from G . Fiske and Co. Ltd., Richmond, Surrey.$ The maize oil was Mazola from CPC International, Esher, Surrey.
5 Provided the following amounts in the basal diet (mg/kg): nicotinic acid 60, cyanocobalamine in mannitol 50, calcium D-pantothenate 40, thiamine hydrochloride 10, riboflavin 10, folk acid 10, pyridoxine 10, D-biotin 1, vitamin K, 2, Rivomix E-50 (containing 7.5 mg vitamin E, Roche) 150, Rivomix A-500 (containing 3.75 mg vitamin A, Roche) 25, Rivomix D,-500 (containing 0.19 mg vitamin D,, Roche) 15, choline bitartrate 1800, maize- starch carrier 17800.
)I Provided the following amounts in the basal diet (g/kg): CaHPO, 13, CaCO, 8.2, KCI 7.04, Na,HPO, 7.4, MnSO, . H,O 0.18, MgSO,, H,O 4, ZnCO, 0.1, FeSO,. 7H,O 0.144, CuSO, 0.023, K10, 0,001.
approximately 18 g in the vitamin mix.
amount of diet spilt early after introduction of the D F supplements was partly discarded because the diet provided an amount that exceeded voluntary intakes, but during the period of faecal collections spillages were usually minimal.
Faeces were collected before feeding during the last 7 d of the 21 d of dietary treatment and were pooled for each animal. Faecal collections were frozen at -20" daily.
Analysis
The basal diet, D F supplements and faeces were analysed for gross energy and total NSP. Gross energy was the heat of combustion determined by adiabatic bomb calorimetry using benzoic acid thermochemical standard (for review, see Brown, 1993). Total NSP was the sum of the neutral and acid NSP. Neutral NSP was measured by the colorimetric method of Faulks & Timms (1985) with a glucose standard. Acidic NSP (uronic acid) was measured by the method of Scott (1979) with a galacturonic acid standard. The neutral NSP and uronic acids were measured without removal of the negligible amounts of available or resistant starches as in the apple pectin (Barry et al. 1995) by dimethyl sulphoxide treatment. Each value was expressed on a per g dry weight basis after freeze-drying. The supplements were also assayed for total dietary fibre (TDF) by the Association of Official Analytical Chemists' method (Prosky, 1985; Prosky et al. 1988).
Calculations
DEVs were calculated using equations 1 and 2:
D E E = AH,
-
AFE, (1)= [(Et,/M,,) - ( E c f / M c d ) l / ( ~ s / M t J ? (2)
where AH, is the heat of combustion of the supplement, AFE is the increase in faecal energy per g D F supplement ingested, E is gross energy, M is mass, and the subscripts were : t , test;
D I E T A R Y FIBRE, ENERGY A N D FERMENTATION I N V I V O 293
c, control;f, faeces; d, basal diet; s, supplement. An example calculation and discussion has been given (Livesey, 1989).
D of the NSP was calculated as its ‘digestibility’, a method that assumes NSP was used only by fermentation:
where
Z
is intake of NSP (a product of supplement intake multiplied by the proportion of the supplement that was NSP) and F was NSP excretion in faeces during the balance period (after deduction of the NSP ‘apparently’ excreted from the basal diet alone).DEV, and D were converted to N E , according to information from Livesey (1990, 1992) using equations 4 and 5 respectively.
D = ( I - F)/Z, (3)
N E , = 0.7 DEV, (4)
( 5 ) NE, = 0.5 x AHc x
D.
In these equations, DEWs/,, AH? and D were as described for equations 1 and 3 .
Statistics
For each DF supplement at each dose a factorial analysis was undertaken with occasions and laboratories represented by blocks in multiple regression. Each animal was the unit of measurement and the residual variation was ascribed to variation among animals (sD,). In keeping with methods-performance assessment (Boyer et a!. 1985), terms for interactions between factors were excluded and variation among occasions (sD,, often referred to as replicability) and variation among laboratories (sD,, often referred to as reproducibility)
were obtained as the standard deviation about the mean determination for each occasion and laboratory respectively. LRD was the largest residual difference or deviation of any one laboratory mean value from the all-laboratory mean value.
Factorial analysis including all D F supplements at each dose in addition to each laboratory and each occasion was also undertaken by multiple regression to obtain inter- laboratory differences and among-laboratory variation and inter-occasional differences and among-occasion variation over all the energy determinations. Again terms for interactions were excluded from the analysis. For the energy values, homogeneity of variances within each factor (DF supplement, dose, laboratory and occasion) were evident from F ratios.
All data were retained in the statistical analyses unless they were laboratory means that either were impossible observations (e.g. highly negative fermentabilities) or were significant outliers in Dixon’s rI2 test (Barnett & Lewis, 1978), which permitted data from one laboratory in five to be excluded from a statistical analysis (Boyer et al. 1985). The excluded data were few and are identified by parentheses in the tables.
Significance of difference between the estimates for each DF supplement of NE, converted from DEV, and D were based on the standard error of difference (SED). The SED
was derived from the variance among animals (sD,) according to z/[(si/n,)
+
(si/n,)],where s, was the SD, for
D
with n1 60 determinations including both treatment doses and s2 was the SD, for DEVs with n, 100 determinations including both doses.R E S U L T S
Heats of combustion
Each of the five laboratories determined the heat of combustion of each of the five D F products (Table 2). The mean values ranged from 15.6 kJ/g for pectin to 19.0 kJ/g for the maize bran. Among-laboratory variation (SDJ of the mean determinations for the
294 G . L I V E S E Y A N D O T H E R S
Table 2. Heats of combustion ( k J / g dry weight) for jive dietary Jibre
(OF)
supplements determined in jive laboratories participating in the study*- Laboratory DF supplement A B C D E Mean SD,, LRD Pectin 15.9 15.9 155 15.8 15.2 15.6 0-2 0.4 Soyabean 17.3 17.3 16.6 16.8 168 16.9 0.3 0.4 Maize bran 19.5 191 18.6 18.9 18.9 19.0 0.3 0.4 Solka-floc cellulose 17.3 17.4 17.2 17.1 17.0 17.2 0.3 0 2 Sugar beet 17.7 17.5 17.7 17.6 17.4 17.6 0.1 0.2
SD,, standard deviation among laboratories; LRD, largest residual deviation of an individual laboratory mean
*
For details of supplements and procedures, see pp. 291-293.value from the all-laboratory mean value.
Table 3. Digestible energy values ( k J / g dry weight) for jive dietary Jibre ( D F ) supplements at two doses in jive laboratories participating in the study"
Laboratory
DF supplement Dose A B C D E Mean SD, SD, SD, LRD
Pectin L 12.0 H 10.4 Sugar beet L 9.8 H 10.0 Soyabean L 13.3 H 12.9 Maize bran L 5.7 H 5.5 Solka-Roc cellulose L 0.7 H 0.7 11.1 9.3 10.3 9.4 10.4 1.1 0.5 1.9 1.6 (8.4)t 102 107 9.9 10.3 0.4 0.7 1.8 0.4 11.4 9 9 9.4 7 0 9.5 1.4 0 6 1.8 2.5 11.8 9.2 9.3 6 6 9.4 1.9 0 2 1.3 2.8 11.9 11.3 13.6 11.1 12.2 1.0 0.9 1.7 1.4 14.5 11.8 12.3 11.8 12.7 1.1 0.4 1.6 1.8 3.2 4.7 3.1 2.3 3.8 1.2 0 8 1.6 1.9 3.4 3.8 4.7 2.7 4.0 1.0 0.8 1.8 1.5 - 0 4 0.6 0-8 -0.4 0 3 0.5 0.6 2.2 0.7 0.4 -0.5 0 0 0.8 0.3 0.5 0.9 1.7 0.8
L, lower dose of 50 g DF supplement/kg basal diet; H, higher dose of 100 g/kg basal diet; SD,,, standard deviation among laboratories; SD,,, standard deviation among occasions; SD,, standard deviation among animals; LRD, largest residual difference or deviation of an individual laboratory mean value from the all-laboratory mean value.
*
For details of supplements and procedures, see pp. 291-293. t The value is a statistical outlier.individual D F supplements were obtained to within 0.3 kJ/g, which corresponds to a coefficient of variation of
<
2YO.
All the laboratories obtained values within 0.4 kJ/g (3YO)
of the all-laboratory mean for each D F supplement (LRD, Table 2).Digestible energy values
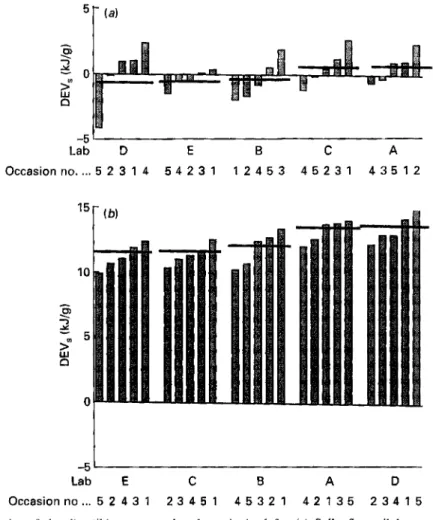
Each of the five laboratories determined the DEVs of each of the five D F supplements at doses of 50 and 100 g/kg basal diet (Table 3). For all the supplements the mean values were independent of dosage and ranged from about 0 kJ/g for Solka-floc cellulose to 12 kJ/g for the soyabean-DF supplement. As examples of the data obtained, those observations for the D F supplements with the highest and lowest energy values at the lower of the two doses are shown in Fig. 1.
Variations in the DEVs among laboratories (sDJ, among occasions (sD,) and among animals (sD,) were independent of the amount of DF supplement in the diet (Table 3).
D I E T A R Y F I B R E , E N E R G Y A N D F E R M E N T A T I O N I N
vrvo
295 -5’
Lab D E B C A Occasionno .... 5 2 3 1 4 5 4 2 3 1 1 2 4 5 3 4 5 2 3 1 4 3 5 1 2 -5 Lab E C B A 0 Occasionno ... 5 2 4 3 1 2 3 4 5 1 4 5 3 2 1 4 2 1 3 5 2 3 4 1 5Fig. 1. Examples of the digestible energy value data obtained for (a) Solka-floc cellulose supplement and
(b) soyabean-DF supplement, both at 50 g/kg basal diet. Values are the mean observations for two rats determined on each occasion (nos. 1-5) in each laboratory (A-E). -, Mean values for each laboratory. Values are shown with the lowest to the left. For details of supplements and procedures, see pp. 291-293.
Limiting the precision of the determinations was variation among animals (sD,), which
tended to be higher than SD, and SD,. Replicability of the determinations among occasions
(sD,) was < 1 kJ/g ( < 6
YO
of the heat of combustion), whereas reproducibility of the determinations among laboratories (SDJ was less than 2 kJ/g and variation among animals(sD,) was less than 2 3 kJ/g.
All the laboratories obtained DEV, for the individual D F supplements that were within
3 kJ/g (LRD, Table 3) of the all-laboratory mean values.
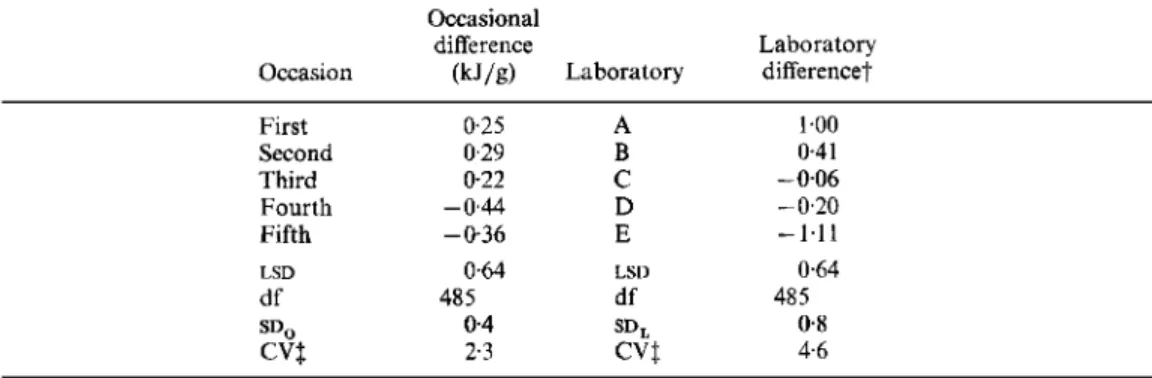
Factorial analysis incorporating all the D F supplements at both doses showed (Table
4)
that overall there were no significant differences in DEVs between occasions; the value for each occasion was within 0.5 W/g of the mean. There were significant
(P
< 0.05) differences between laboratories, whch reached as high as 2 kJ/g or 12 % of the heat of eombustion (Table 4).TDF and N S P contents of the DF supplements
The D F supplements consisted mainly of Prosky TDF (Prosky, 1985; Prosky et al. 1988)
296 G . L I V E S E Y A N D O T H E R S
Table
4.
Inter-occasional and inter-laboratory dzfferences in digestible energy value over all dietary jibre supplements and doses ( k J / g dry weight)*Occasional
difference Laboratory
Occasion (kJ/g) Laboratory difference?
First Second Third Fourth Fifth df LSD 0.25 0.29 0.22 - 0.44 -036 485 0.64 0.4 2.3 A B
c
D 1.00 0.4 1 - 0.06 - 0.20-
1.1 1 0.64 485 0.8 4.6LSD, least significant difference at P < 0.05 ; S D ~ , inter-occasional variance; SD,,, inter-laboratory variance; CV,
* For details of procedures, see pp. 291-293. coefficient of variation.
Each difference (from the overall mean) included 100 determinations (i.e. not excluding the outlier shown in Table 3).
2 Percentage of the heat of combustion.
Table 5. Totul dietary fibre ( T D F ) and total non-starch polysaccharide ( N S P ) content of the dietary Jibre ( D F ) supplements ( g / g dry weight)?
Variable.. . TDF (g/g dry wt) NSP (g/g dry wt) Procedure.. . Prosky (1985) and Faulks & Timms DF supplement Prosky et al. (1988) (1985) Pectin 0.70 0.67 0.94 31 Sugar beet 0.78 0-17 0.61 13 Soyabean 0.82 0.81 0.69 9* Maize bran 0.88 0.88 0.69 8** Solka-floc cellulose 1.00 1.00 1.03 3
The total NSP values differed significantly from those for TDF: * P < 0.05,
**
P < 0.01.t TDF determinations are from two separate laboratories with previous experience of the methods. Total NSP are all-laboratory mean values and among-laboratory standard deviations with data from the five laboratories. For details of procedures, see pp. 291-293.
laboratories that determined TDF. The colorimetric method of Faulks & Timms (1985) showed values that differed from the TDF method and the difference was significant
(P
<
0.05) for both the soyabean supplement and the maize bran. Except for the Solka-floc cellulose, variances with the Faulks & Timms (1985) analysis were high and pectin gave particularly variable results.Fermentability
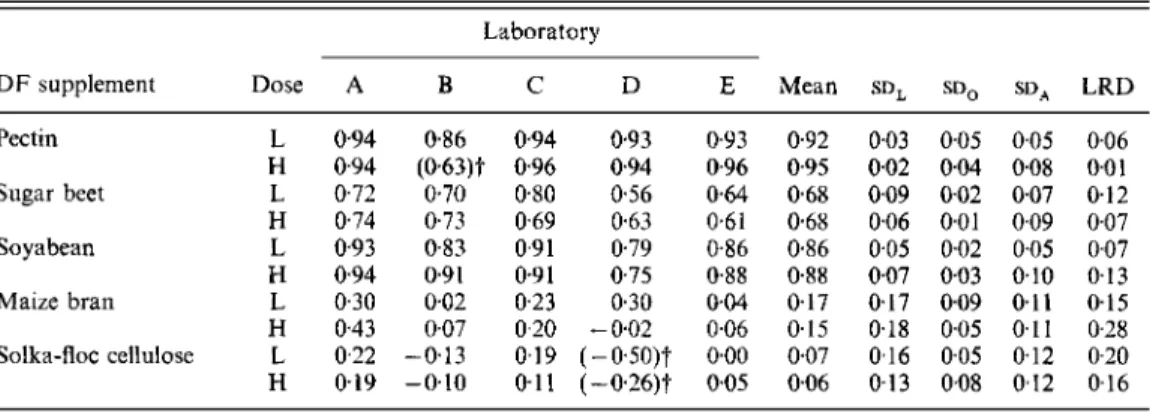
Each of the five laboratories determined D for each of the five sources of NSP at two dietary dosages (Table 6). For all the sources of NSP the values were independent of dosage and
mean values ranged from about zero for Solka-floc cellulose to about 0.9 for pectin. Variations in
D
values among laboratories (sD,), among occasions (sD,) and among animals (sD,) were independent of the amount of NSP source in the diet. Replicability of the determinations among occasions (sD,) was < 0.1, but reproducibility of theD I E T A R Y F I B R E , E N E R G Y A N D F E R M E N T A T I O N I N V I V O 297
Table 6 . Fermentability ( g / g dry weight) of non-starch polysaccharides in theJive dietaryJibre ( D F ) supplements determined at two doses in jive laboratories participating in the study*
Ldboratory
D F supplement Dose A B C D E Mean S D ~ S D ~ SD, LRD
Pectin L 094 H 0.94 Sugar beet L 0.72 H 0.74 Soyabean L 0.93 H 0.94 Maize bran L 0.30 H 0.43 Solka-Roc cellulose L 0.22 H 0.19 0.86 (0.63)t 070 0.73 0.83 0.9 1 0.02 0.07 -0.13 -0.10 0.94 0.93 0.93 0.96 0.94 0.96 0.80 0.56 0.64 0.69 0.63 0.61 0.91 0.79 0.86 0.91 0.75 0.88 0.23 030 0.04 0.20 -002 0.06 0.19 (-0'50)t 0.00 0.11 (-026)t 0.05 0.92 0.95 0.68 0.68 0.86 0.88 017 0.15 0.07 0.06 0.03 0.02 0.09 0.06 0.05 0.07 0.17 0.18 0.16 0-13 0.05 0.04 002 0.01 0.02 0.03 0.09 0.05 0.05 0.08 0.05 0.08 0.07 0.09 0.05 0.10 0.1 1 0.11 0.12 0.12 0.06 0.0 1 0.12 0.07 0.07 0.1 3 0.15 0.28 0.20 0.16
L, lower dose of 50g DF supplement/kg basal diet; H, higher dose of lOOg/kg basal diet; SD,, standard deviation among laboratories; S D ~ , standard deviation among occasions; S D ~ , standard deviation among animals; LRD, largest residual deviation of an individual laboratory mean value from the all-laboratory mean value.
t
Values did not contribute to the statistical analysis being excluded as either unreasonably negative (-0.50, -026) or as a statistical outlier (0.63).* For details of supplements and procedures, see pp. 291-293.
D
Fig. 2. The relationship between the fermentability (D) of non-starch polysaccharide (NSP) and digestible energy
value (DEV,). The line shows the anticipated relationship DEV, = 0.7 x D x AHc, where AHc is the heat of combustion of the supplement (Livesey, 1990). (0, O), Pectin; ( 0 ,
a),
Sugar-beet NSP; (A, A), Solka-floc cellulose; (M, H), maize bran;(a,
a),
soyabean NSP; 0 , 8, A, El, 0 , 5 0 g/kg basal diet; 0 , A, M, 100 g/kgbasal diet. Individual values and associated standard deviation (SDJ are from Tables 3 and 6. For details of supplements and procedures, see pp. 291-293.
298 G . L I V E S E Y A N D OTHERS
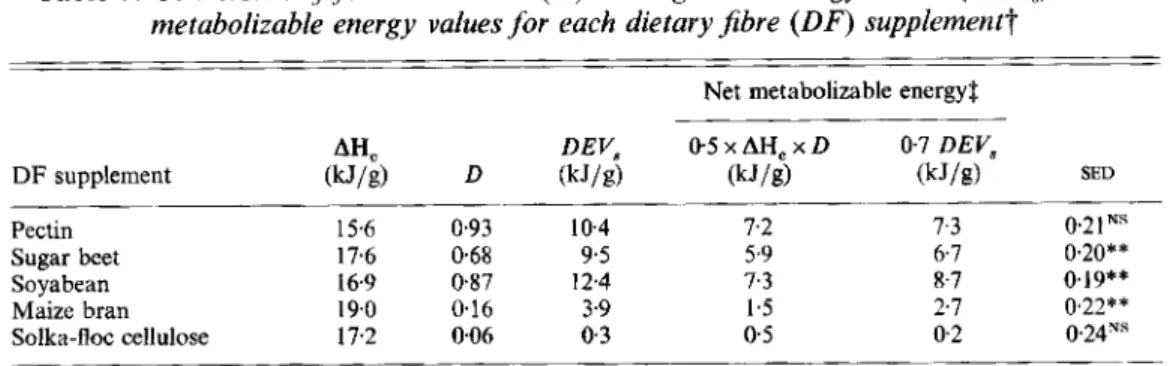
Table 7. Conversion of fermentabilities (D) and digestible energy values (DEVJ to net metabolizable energy values for each dietary fibre ( D F ) supplementt
Net metabolizable energy3 DEV, 0 5 x AHc x D 0.7 DEV,
SED AHC
____
DF supplement (kJ/g) D (kJ/g) (kJ/g) (kJ/g) 10.4 7.2 7.3 021"s Sugar beet 17.6 0.68 9.5 5.9 6.7 0.20** Maize bran 19.0 0.16 3.9 1.5 2.1 0,22** ______ Pectin 15.6 0.93 Soyabean 16.9 0 8 7 12.4 7.3 8-7 0.19**Solka-floc cellulose 17.2 006 0.3 0 5 0.2 024ys
SED, standard error of difference with > 68 df; NS, not significant. The difference between net metabolizable
t
For details of supplements and procedures, see pp. 291-293.3 The conversion procedures are based on Livesey (1990, 1992), where AHc is the heat of combustion (see energy values calculated by the two methods was significant: ** P < 001.
equations 4 and 5, p. 293).
determinations among laboratories (SDJ was higher at
<
0-2. Variation among animals(sD,) tended to fall between SD, and SD,. These variances tended to be less for the NSP
sources that were readily fermented than for those that were not.
Factorial analysis incorporating all the NSP sources at both doses showed that overall there were no inter-occasional or inter-laboratory differences in D values, nor was there any trend for a change in D with the number of occasions that the determinations were made (values not shown); however, variation in these values was sometimes large (Table 6).
Digestible energy value related to fermentability
The mean DEV, of the D F preparations correlated with the mean D of their constituent
NSP (r 0.92). All data fell withn 3 kJ/g of the line expected (Fig. 2) when assuming (Livesey, 1990) the DEV, to equal 0.7 multiplied by both the general heat of combustion and fermentability of the NSP.
Net metabolizable energy values
The conversion of mean DEV, of the D F supplements and D of NSP to NE, is shown in Table 7. Values obtained by the two approaches were within 1.5 kJ/g of each other (< 10 %
of their heat of combustion) and because of the large number of observations some differences were significantly different statistically, as indicated.
D I S C U S S I O N
From an early view that unavailable carbohydrate (as Southgate dietary fibre) contributes no energy to the human diet (Southgate & Durnin, 1970) has evolved a current view that unavailable carbohydrate in mixed human diets (as determined by several different methods) contributes about 8 kJ or 2 kcal DE/g substrate (British Nutrition Foundation, 1990; Livesey, 1990, 1991, 1992). It should be emphasized that the assignment of a zero value was an empirical view as Southgate, Durnin and many other preceding authors were aware of fermentation in the large bowel and the possibility that short-chain fatty acids could provide energy. Southgate confirms the current view commenting (discussion following Wisker & Feldheim, 1992) that 'the 2 kcal/g [digestible energy] value is about right [for mixed diets] but for individual constituents the average value may either
D I E T A R Y FIBRE, E N E R G Y A N D FERMENTATION I N V I V O 299 overestimate or underestimate the energy [(Livesey, 1990, 1992; Roberfroid et al. 1993)] and that there is a need for methods to assess the energy values of ingredients so that specific conversion factors are available to food producers who wish to use the material as an ingredient
’.
The revised thinking on the energy value of unavailable carbohydrates was reached for four main reasons which have been cited and discussed elsewhere (British Nutrition Foundation, 1990; Livesey, 1990, 1992). One is that provided an examination is made of a large enough data-set that contains varied sources and amounts of unavailable carbohydrate the energy values determined by experiment agree with theoretical expectations based on the extent and stoichiometry of fermentation. In keeping with this statement the present study incorporates a large data-set by running identical protocols in five different European laboratories and includes various sources and doses of D F supplements
.
There are a number of differences between the present work and that in humans reviewed previously. The present study has focussed on D F supplements rich in NSP, with either no or minimal starch content, rather than on the unavailable carbohydrates in mixed diets. Also, five D F supplements from different sources representing NSP of differing
D
were included rather than a mixture from different foods in which the D of unavailable carbohydrate tends towards an average value of about 0.7, at all intakes of unavailable carbohydrate (Livesey, 1990). Further, the rat was used in place of humans since D of NSP in the two species appear to be similar (Nyman et al. 1986; Livesey, 1992; Bach-Knudsenet al. 1994) and an investigation of methods performance in humans of the present complexity would have been impractically expensive.
The DEVs of the Solka-floc cellulose and sugar-beet-DF supplements have been determined previously at 0 and 9 kJ/g respectively (Harley et al. 1989; Johnson et al. 1990); the 0.3 and 9.5 kJ/g respectively obtained at present agree with those values (Table 3).
It is very clear that for the five D F supplements investigated neither the DEV, nor the D of the NSP depend on the amount in the diet between 50 and 100 g D F supplement/kg basal diet. Indeed, the similarities in DEV8 at each dose are within 3 % of the heat of combustion (i.e. within 0.5 kJ/g) and differences in D between doses also did not exceed
0.03 ( 3 % ; Tables 3 and 6). The rat, therefore, was well within its capacity to accommodate the higher intake of NSP and did so within the 2 weeks adaptation period before the energy balance measurements. Moreover, within experimental error, the DEV, of the five NSP-
rich products could be anticipated from their
D
and the theoretical relationship between the two values suggested previously (Livesey 1990, 1992). We conclude, therefore, that doses in the range 50-100 g D F supplement/kg basal diet are suitable for the determination of energy value and that D is a reasonable index of the energy value.The procedure for the determination of energy value performed reasonably well, but that for the determination of D was not good. The less than 2% among-laboratory variation in heat of combustion compares with expectations of approximately 2
YO
for the analysis of a 100 % ‘pure’ material by any satisfactory analytical method (Horwitz et al. 1980). The among-laboratory variation in the D E evaluation procedure, usually about 1 kJ/g (Table3) or 6 Yo of the heat of combustion, is twice that expected of an analytical procedure with a material of 0.05-0.1 ‘purity’, probably due to biological variation. It should be noted that any differences in animals from the different suppliers used by the participating laboratories, although all having the same specification, will contribute to the among-laboratory variance.
The ratio, among-replicate variation within laboratories : among-laboratory variation is an indicator of the quality of the data in analytical methods performance, typically values in the range 0.5-0.7 are expected (Horwitz et al. 1980). Variation within laboratories,
300 G . LIVESEY A N D O T H E R S
among animals (sD,) is higher than variation among laboratories (sD,), by about x 1.6 (Table 3); this value is above the 0.5-0.7 expected of an analytical method. Again biological variation is probably the limiting factor in the precision of the method and the explanation of the high SD, : SD, value. However, biological variation has less influence on the among- occasion: among-laboratory variance ratio and over all the D F supplements and doses the ratio was 0 5 (2-3/4.6; Table 4). This ratio compares with mean values of 0.5-0-7 expected of analytical methodology that is applied equally well in the participating laboratories (Honvitz et al. 1980).
SD,:SD, for the present D determinations is about 1.6 (Table 6), and similar to that for
the DE determinations (Table 3). Again the value is high probably because of biological variation, and possibly also because of difficulties in the execution of the analytical procedure for NSP. SD,:SD, tended to be below 1 (except for pectin) indicating tighter control over the determinations within laboratories than among them.
While the analysis of NSP is not the focus of the present work certain pertinent points are made using apple pectin and Solka-floc cellulose as examples that help inter- pretation of the D data. With apple pectin the among-laboratory variation in NSP determination was unacceptably high at 0.3 (30 %) (Table 5) reflecting difficulties among the participating laboratories when analysing uronic acids in this particular source by the method of Scott (1979). However, variation in the determined D for pectin among laboratories, among occasions and among animals (Table 6) was small for two reasons. First, D is a ratio of NSP determinations so any analytical bias within laboratories is largely cancelled, and second, the amount of NSP in the faeces is small giving rise to little analytical variation. The situation with Solka-floc cellulose is different. The among-laboratory variation in NSP determination by the method of Faulks & Timms (1985) in the cellulose supplement was small, 0.03 (3
W )
and very close to the 0 0 2 expected for the analysis of a ‘pure’ substance (Horwitz et al. 1980). However, the among-laboratory and, to a lesser extent, the among-animal variations in the determined D for Solka-floc cellulose were high (0.1-0.2 ; Table 6) indicating either a high biological variation (including variation among animals from the different suppliers) or a high analytical variation when measuring large amounts of substrate in faeces. These different circumstances probably explain the low variation about the D of the more-easily-fermentable NSP and the high variation about theD
of poorly-fermentable NSP. A different result might have been reached had either a more sophisticated procedure been employed for the NSP determinations, such as in some previous studies on fermentation measured with GLC analysis (Nyman & Asp, 1985, 1988), or had the researchers learned more about the colorimetric methods before use here. Nevertheless, the finding of a large among-laboratory variation in D of the difficult-to- ferment NSP indicates that the present procedure is not yet sufficiently well developed for predicting energy value, which is better determined directly.We have determined DEV,, but food labelling practice with other fermentable carbohydrates and sugar alcohols uses NE, values (European Council Directive, 1990). Conversion of D and DEVs to NE, values (Table 7) is simpler than direct determination (Livesey, 1992). This is because with several test products it is not practical to determine the sum of the energy expended on the heat of fermentation, the additional heat generated when short-chain fatty acids are oxidized in place of glucose and the transfer of energy to combustible gases. The two conversions to NE, give similar values, within 2 kJ/g of each other (Table 7), so that in principle either approach would seem satisfactory. The small discrepancies in the values obtained by the two approaches could well arise because of combustible impurities in the dietary fibre preparations ; for example, with maize bran the higher NE, calculated from DEV8 than from D may be due to small amounts of starch being present. Such may also explain the departure of observations from the expected
D I E T A R Y F I B R E , E N E R G Y A N D F E R M E N T A T I O N I N V I V O 301
relationship between DEVs and D in Fig. 2. Nevertheless, with the present methods the conversion of DEV, to N E , would be more reliable than prediction from D because of the large among-laboratory variations in the
D
of difficult-to-ferment NSP.In conclusion, the method described for determining the energy values of different non-
starch polysaccharide-rich dietary fibre supplements is both reproducible and repeatable. The result is independent of dietary dosage with supplements over the range used so that it is feasible to apply the method using a single dose within this range. Provided that the user of the method is reasonably proficient in animal husbandary and general analytical procedures there is no evidence that the result is dependent on the experience gained by the user of the method. We suggest the method is acceptable as an official method for obtaining energy values of dietary fibre supplements for the purpose of food labelling, tables and databases.
This study was coordinated and supported by the Dietary Fibre Task Force of the International Life Sciences Institute - ILSI Europe, Avenue E. Mounier, 83
-
Box 6 , B- 1200 Brussels. Coordinators were Drs J.-L. Barry (INRA, Nantes, France), T. F. S. (present author), G . L . (present author), and U. Priebe (ILSI Europe). Thanks are due to R. M. Faulks for guidance on the use of the Faulks & Timms (1985) colorimetric method for NSP. The authors are grateful for technical help from Mr F. Montigon, Mrs D. Cavin and MrsS. Reimann of Nestle, Mr K. Olsson and Mrs M. Stenberg of Lund University.
R E F E R E N C E S
Bach-Knudsen, K. E., Wisker E., Daniel, F., Feldheim, W. & Eggum, B. 0. (1994). Digestibility of energy, protein, fat and non-starch polysaccharides in mixed diets: comparative studies between man and rat. British Journal of Nutrition 71, 471-487.
Barnett, V. & Lewis, T. (1978). Outliers in Statistical Data, p. 99. Chichester: John Wiley & Sons.
Barry, J.-L., Hoebler, C., MacFarlane, G . T., MacFarlane, S., Mathers, J. C., Reed, K. A., Mortensen, P. B., Norgaard, I., Rowland, I. R. & Rumney, C. J. (1995). Estimation of the fermentability of dietary fibre in vitro: a European interlaboratory study. British Journal of Nutrition 74, 303-322.
Boyer, K. W., Horwitz, W. & Albert, R. (1985). Interlaboratory variance in trace element analysis. Analytical Chemistry 57, 454459.
British Nutrition Foundation (1990). Complex Carbohydrates in Foods: The Report of the British Nutrition Foundation’s Task Force. London: Chapman & Hall.
Brown, J. C . (1993). Energy: measurement of food energy. In Encylopaedia of Food Science, Food Technology and Nutrition, vol. 13, pp. 1590-1595; [R. Macrae, R. K. Robinson and M. J. Sadler, editors]. London: Academic Press Ltd.
Brown, J. C. & Livesey, G. (1994). Urinary energy excretion in rats fed guar gum: implications for putative thermogenesis. Food Hydrocolloids 8, 69-12.
European Council Directive (1990). Nutrition labelling for foodstuffs. Official Journal of the European Community
33, L276.
Faulks, R. M. & Timms, S. B. (1985). A rapid method for determining the carbohydrate component of dietary fibre. Food Chemistry 17, 213-287.
Goranzon, H. & Forsum, E. (1987). Metabolisable energy in humans in two diets. Calculation and analysis. Journal of Nutrition 117, 261-213.
Goranzon, H., Forsum, E. & Thilh, M. (1983). Calculation and determination of the metabolisable energy in mixed diets to humans. American Journal of Clinical Nutrition 38, 954963.
Harley, L. J., Davies, I . R. & Livesey, G. (1989). Digestible energy value of gums in the rat - data on gum arabic.
Food Additives and Contaminants 6, 13-70.
Horwitz, W., Kamps, L. R. & Boyer, K. W. (1980). Quality assurance for the analysis of foods for trace constituents. Journal of the Association of Oficial Analytical Chemists 63, 1344-1 354.
Johnson, I. T., Livesey, G., Gee, J. M. G . , Brown, J. C. & Wortley, G . M. (1990). The biological effects and digestible energy value of a sugar-beet fibre preparation in the rat. British Journal of Nutrition 64, 187-199. Livesey, G. (1989). Procedure for calculating the digestible and metabolizable energy values of food components
making a small contribution to the diet. Journal q f t h e Science of Food and Agriculture 48, 475-481. Livesey, G. (1990). Energy values of unavailable carbohydrates and diets: an inquiry and analysis. Americun
302 G . LIVESEY A N D O T H E R S
Livesey, G. (1991). Calculating the energy values of foods: towards empirical formulae based on diets with varied Livesey, G. (1992). The energy values of diets and sugar alcohols for man. Nutrition Research Reviews 5, 61-84. Miles, C. (1990). The metabolisable energy of diets differing in dietary fat and fibre in humans. Journal ofNutrition
122, 306311.
Nyman, M. &Asp, N.-G. (1985). Dietary fibre fermentation in the rat intestinal tract: effect of adaptation period, protein and fibre level, and particle size. British Journal of Nutrition 54, 635-643.
Nyman, M. & Asp, N.-G. (1988). Fermentation of oat fibre in the rat intestinal tract: A study of different cellular areas. American Journal of Clinical Nutrition 48, 274-279.
Nyman, M., Asp, N.-G., Cummings, J. H. & Wiggins, H. (1986). Fermentability of dietary fibre in the intestinal tract: comparison between man and rat. British Journal of Nutrition 55, 487-496.
Prosky, L. (1985). Total dietary fibre in foods. Enzymatic-gravimetric method. Journal of the Association of Oj’icial Analytical Chemists 68, 399.
Prosky, L., Asp, N.-G., Schweizer, T. M., DeVries, J. W. & Furda, I. (1988). Determination of insoluble, soluble, and total dietary fibre in foods and products: interlaboratory study. Journal of the Associution of Oficiul
Analytical Chemists 71, 1017-1023.
Roberfroid M., Gibson, G . R. & Delzenne, N. (1993). The biochemistry of oligofructose, a non-digestive fiber: an approach to calculate its caloric value. Nutrition Research 51, 137-148.
Scott, R. W. (1979). Colorimetric determination of hexuronic acids in plant materials. Analytical Chemistry 51, 936941.
Southgate, I). A. T. & Durnin, J. V. G. A. (1970). Calorie conversion factors: an experimental reassessment ofthe
factors used in the calculation of the energy values of human diets. British Journal of Nutrition 24, 517-535. Wisker, E. & Feldheim, W. (1992). Faecal bulking and energy value of dietary fibre. In Dietury Fibre- A
Component of Food, pp. 233-246 [T. F. Schweizer and C. A. Edwards, editors]. London: Springer-Verlag. Wisker, E., Maltz, A. & Feldheim, W. (1988). Metabolisable energy of diets low or high in dietary fibre from
cereals eaten by humans. Journal of Nutrition 118, 945-952.
intakes of unavailable complex carbohydrates. European Journal of Clinical Nutrition 45, 1-22.