CRYOGENIC ZONE COMPRESSION GAS CHROMATOGRAPHY COMBINED WITH
HIGH RESOLUTION MASS SPECTROMETRY (CZC GC-HRMS) – APPROACHES TO
SUB FEMTOGRAM LEVEL ANALYSIS OF DIOXINS
Krumwiede D1, Mehlmann H1, Focant J-F2, Patterson Jr. D3, Turner W4, D´Silva K1 1
Thermo Fisher Scientific GmbH, Hanna-Kunath Str. 11, 28199 Bremen, Germany; 2CART, University of
Liège, B-4000 Liège, Belgium; 3EnviroSolutions Consulting, Inc., 172 Camelot Way, #20198, Jasper, GA
30143, USA, 4National Center for Environmental Health, Centers for Disease Control and Prevention, Atlanta,
GA, USA
Introduction
The analysis of dioxins and furans with low limits of detection (LODs) is often challenging and requires GC-MS
capabilities of enhanced selectivity and the lowest attainable sensitivity1. Even with GC-HRMS, low LODs can
often not be met with instrumental performance alone, especially when residue levels are very low within a sample. Thankfully, low limits of detection can regularly be achieved with the use of increased sample size and high volume sample introduction techniques for most sample types, such as food.
However, when sample sizes are small, and residue levels are low, a unique analytical challenge is presented, such as with infant dried blood spot analysis - typical sample sizes can be as small as 10-100 µL only, the residue levels are very low, there is no opportunity to scale up sample size and there is no advantage in using high volume sample introduction techniques. Typically this challenge would preclude the analysis of dioxins and furans in such samples. However, large archives of dried blood spot samples exist in hospitals globally. These are routinely sampled from children at birth in many countries. These samples present an unprecedented sample resource for epidemiological and toxicological studies of population background exposure to dioxins and furans, providing these significant analytical challenges can be overcome.
Cryogenic peak modulation is a well established technique and commonplace in GCxGC applications. In GCxGC a cryogenic modulator continuously traps and releases the eluent from a first dimension column onto another short second dimension column in a very narrow band. The combination of two different column phases for first and second dimension results in a substantial increase of chromatographic separation power and due to the cryogenic peak focusing also in sensitivity. For each first dimension peak several second dimension chromatograms are obtained allowing constructing and evaluating data from two-dimensional chromatograms.
The applicability of this technique has previously been demonstrated for the analysis of dioxins2.
CZC GC operates in a comparable fashion except that only one single column is used with the cryogenic modulator placed shortly before the detector. Analytes elute through the first part of the column to the modulator, where each target analyte is completely trapped and re-injected onto the second short part of the column. This time controlled cryogenic trapping focuses the analytical peaks resulting in very narrow and intense chromatographic peaks. Broad conventional GC peaks at very low levels that would possibly be lost to background noise can now be detected. As only the peak focusing capabilities of GCxGC are used without real first dimension peak modulation common one-dimensional chromatograms are obtained.
CZC GC-HRMS was evaluated as an approach to detect very low femtogram to sub femtogram levels of selected analytes, previously undetectable by conventional GC-HRMS.
Fast GC – the use of short narrow columns combined with high oven heating ramps - was investigated for its peak zone focusing capabilities as an alternative technique.
Both analytical approaches – CZC GC-HRMS and Fast GC-HRMS – are potential solutions to the analytical challenge of blood spot analysis as described above.
Materials and methods
All experiments were carried out on a Thermo Scientific DFS High Resolution GC/MS coupled to a Thermo
Scientific Trace GCxGC unit equipped with a Thermo Scientific TriPlusTM autosampler. The GCxGC was
equipped with a cryogenic GC modulator device using liquid CO2 as cooling medium. A standard split/splitless
injector was employed in splitless mode for all injections.
CZC experiments were carried out using single standard columns; Thermo Scientific TR-Dioxin 5MS 30 m and 60 m, I.D 0.25 mm, 0.1 µ m film (Thermo Scientific). The modulator was placed between 1-4 m from the MS end of the analytical column.
Fast GC experiments were conducted using a short narrow bore column; TR-Dioxin 5MS 5 m x 0.18 mm, 0.18 µ m film (Thermo Scientific). Rapid oven heating ramps were employed.
Results and discussion:
Different experimental approaches were investigated for refocusing the target analytes. Long modulations times of ca. 20 seconds were used as well as time controlled peak trapping. Time controlled trapping seemed to be the safer and easier approach to assure the complete trapping of an analyte in one slice and was preferably used for most of the experiments.
Significant peak intensity improvements were made using CZC GC over conventional GC (Figure 1). In comparison to an early eluting TCDD peak (RT 11 – 14 min) on a 30 m column the increase in peak height was between factors of 3-5. Considerably higher factors would result when comparing to a TCDD peak from a 60 m column.
In order to let the MS work at an increased scan speed only a reduced number of target masses were monitored. Basically in one function only 2 native target masses and 1 internal standard mass were used. Sample frequencies up to around 10 - 15 Hz are possible this way.
Analytical peak widths could be controlled through variable positioning of the cryogenic unit from the MS end of the column. Longer column lengths post
cryogenic unit (2nd dimension), lead to wider
analytical peaks. Short 2nd dimension column
lengths resulted in narrower chromatographic peaks. It should be noted that reducing dwell time basically results in reduced sensitivity, thus it can be concluded that an optimum between peak width and minimum dwell time should exist.
In experiments too narrow peaks (here e.g. for 2nd dimension col. length ≤ 1-2 m) with too small dwell times seemed to give non reproducible results.
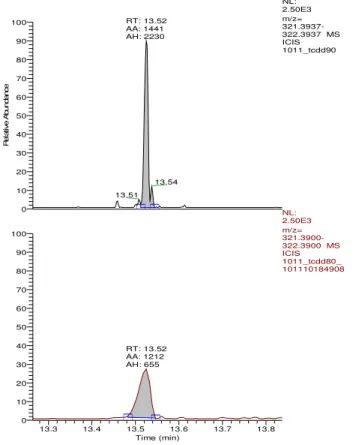
Figure 1: CZC Peak (upper trace, 4 m 2nd dim. col. length) versus conventional GC Peak on 30 m column (lower trace), both: 20 fg 2378-TCDD
Peakwidth (50 %): CZC: 0.57 sec, Standard GC: 2 sec RT:13.26 - 13.84 13.3 13.4 13.5 13.6 13.7 13.8 Time (min) 0 10 20 30 40 50 60 70 80 90 100 0 10 20 30 40 50 60 70 80 90 100 R e la ti v e A b u n d a n c e RT: 13.52 AA: 1441 AH: 2230 13.54 13.51 RT: 13.52 AA: 1212 AH: 655 NL: 2.50E3 m/z= 321.3937-322.3937 MS ICIS 1011_tcdd90 NL: 2.50E3 m/z= 321.3900-322.3900 MS ICIS 1011_tcdd80_ 101110184908
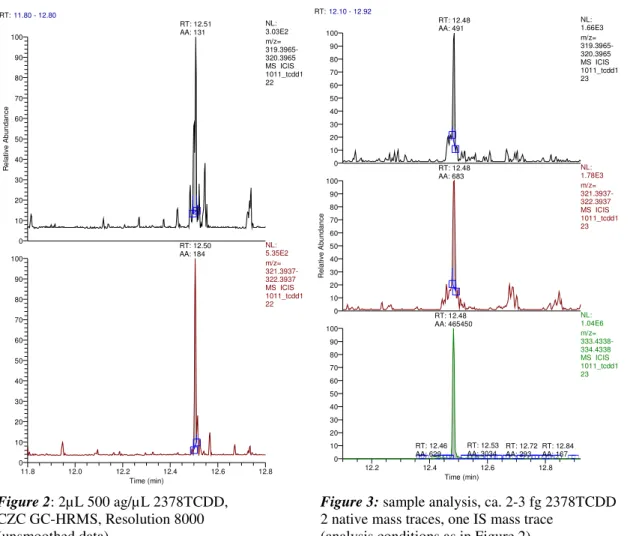
A typical setup used a 4 m 2nd dimension column length on a 30 m x 0.25 column resulting in peak width of about 0.5 seconds for 2378-TCDD, which allowed to monitor 3 masses at a scan speed of about 10 Hz with dwell times for the 2 native target masses being close to 30 ms (Figures 2 and 3).
Figure 2: 2µL 500 ag/µL 2378TCDD, Figure 3: sample analysis, ca. 2-3 fg 2378TCDD
CZC GC-HRMS, Resolution 8000 2 native mass traces, one IS mass trace
(unsmoothed data) (analysis conditions as in Figure 2)
Similar peak widths and thus peak focusing effects were achievable using Fast GC. However, Fast GC experiments were found to be prone to reduced retention time reproducibility and higher column background bleed.
Initial experiments were focused on the analysis of 2378-TCDD. Optimization of the timed segmented CZC GC allowed analysis of additional target analytes. Investigations are underway to further optimize methods and more extensive analysis of relevant sample matrices.
Acknowledgements:
Brock Chittim (Welington Laboratories) for providing the low level chemical standards used in this study. Daniela Cavagnino (Thermo Scientific Italy) for providing the GCxGC unit.
References:
1. Patterson DG, Welch SM, Turner WE, Sjödin A, Focant JF; (2011) J. of Chromatography A, 1218, 3274-3281 2. Focant JF, Eppe G, Scippo ML, Maghuin-Rogister G, De Pauw E; (2005) Organohalogen Compounds, 67, 85-90 RT:11.80 - 12.80 11.8 12.0 12.2 12.4 12.6 12.8 Time (min) 0 10 20 30 40 50 60 70 80 90 100 0 10 20 30 40 50 60 70 80 90 100 R e la ti v e A b u n d a n c e RT: 12.51 AA: 131 RT: 12.50 AA: 184 NL: 3.03E2 m/z= 319.3965-320.3965 MS ICIS 1011_tcdd1 22 NL: 5.35E2 m/z= 321.3937-322.3937 MS ICIS 1011_tcdd1 22 RT:12.10 - 12.92 12.2 12.4 12.6 12.8 Time (min) 0 10 20 30 40 50 60 70 80 90 100 0 10 20 30 40 50 60 70 80 90 100 R e la ti v e A b u n d a n c e 0 10 20 30 40 50 60 70 80 90 100 RT: 12.48 AA: 491 RT: 12.48 AA: 683 RT: 12.48 AA: 465450 RT: 12.53 AA: 3034 RT: 12.46 AA: 629 RT: 12.72 AA: 293 RT: 12.84 AA: 167 NL: 1.66E3 m/z= 319.3965-320.3965 MS ICIS 1011_tcdd1 23 NL: 1.78E3 m/z= 321.3937-322.3937 MS ICIS 1011_tcdd1 23 NL: 1.04E6 m/z= 333.4338-334.4338 MS ICIS 1011_tcdd1 23