HAL Id: hal-02390724
https://hal.umontpellier.fr/hal-02390724
Submitted on 3 Dec 2019HAL is a multi-disciplinary open access archive for the deposit and dissemination of sci-entific research documents, whether they are pub-lished or not. The documents may come from teaching and research institutions in France or abroad, or from public or private research centers.
L’archive ouverte pluridisciplinaire HAL, est destinée au dépôt et à la diffusion de documents scientifiques de niveau recherche, publiés ou non, émanant des établissements d’enseignement et de recherche français ou étrangers, des laboratoires publics ou privés.
Boat anchoring pressure on coastal seabed:
quantification and bias estimation using AIS data
Julie Deter, Xavier Lozupone, Adrien Inacio, Pierre Boissery, Florian Holon
To cite this version:
Julie Deter, Xavier Lozupone, Adrien Inacio, Pierre Boissery, Florian Holon. Boat anchoring pressure on coastal seabed: quantification and bias estimation using AIS data. Marine Pollution Bulletin, Elsevier, 2017, 123 (1-2), pp.175-181. �10.1016/j.marpolbul.2017.08.065�. �hal-02390724�
1 Boat anchoring pressure on coastal seabed: quantification and bias estimation using AIS data
Authors : Deter Juliea,b, Lozupone Xaviera, Inacio Adriena,b, Boissery Pierrec, Holon Floriana
Affiliations :
aAndromède Océanologie, 7 place cassan, 34280 Carnon, France
bUMR 5554 –ISEM, campus triolet de l’Université Montpellier, place Eugène Bataillon, 34095 Montpellier cedex
05, France
cAgence de l’eau Rhône-Méditerranée-Corse, immeuble le Noailles, 62 La Canebière, 13001 Marseille, France
Corresponding author: Julie Deter
Andromède océanologie, 7 place Cassan, 34280 Carnon, France E-mail: [email protected]
Abstract (150 words)
Global shipping is economically important, but has many adverse environmental effects. Anchoring contributes greatly to this adverse impact, as it is responsible for mechanical disturbance of highly sensitive marine habitats. Recovery of these ecosystems is limited by slow regrowth. Anchoring pressure on coastal seabed habitats was estimated using AIS (Automatic Identification System) data along 1800 km of Mediterranean coastline between 2010 and 2015. A comparison with field
observations showed that these results were most consistent for large boats (> 50 m). An analysis of AIS data coupled with a seabed map showed that around 30 % of the habitats between 0 and -80 m exhibited anchoring pressure. Posidonia oceanica seagrass beds were the most impacted habitat in terms of duration. This methodology efficiently estimates spatial and temporal anchoring pressure principally due to large boats and should interest managers of marine protected areas as much as coastline managers.
Key words: mooring impact; benthic habitats; ship; method; habitat vulnerability; resilience
INTRODUCTION
Global shipping (maritime transport and recreational boating) is an important sea use and has significant economic value. A recent review of maritime transport reported that “around 80 % of global trade by volume and over 70 % of global trade by value are carried by sea and are handled by ports worldwide” (United Nations Conference on Trade and Development (UNCTAD), 2015). The studied ships comprise commercial vessels (passenger and/or goods transport, service and assistance, professional use such as fishing, or research) and recreational vessels. Recreational boating represents a large number of users with 29 % (34.2 million) of U.S. households having at least one member who boated in 2011 (USCG boating, 2011), and Europe having 36 million boaters and six million boats in its waters (European Boating Industry, 2010). There are numerous adverse
environmental effects from this high number of boats: collision, pollution (e.g., ballast, oil, antifouling products), devoted buildings on land (harbours) and anchoring (Cappato, 2011). Anchoring is defined as the short-term deployment of a physical device to hold fast to the substrate by a vessel
(Kininmonth et al., 2014). Anchoring is responsible for mechanical disturbance of highly sensitive marine habitats like seagrass meadows (Short and Wyllie-Echeverria, 1996) and biogenic reefs (Ballesteros, 2006; Davis, 1977), whose recovery is limited by slow regrowth. Concentrated in shallow waters by its very nature, anchoring causes direct and indirect damage to some of the most valuable marine ecosystems (Costanza et al., 1997; Forrester et al., 2015) through deployment and retrieval of the anchor and the movement of the attached chain/rope (Milazzo et al., 2004; Walker et al., 2012). Concentrated on shallow waters by its very nature, anchoring causes direct and indirect damages to some of the most valuable marine ecosystems (Costanza et al., 1997; Forrester et al.,
2 2015) through deployment and retrieval of the anchor and the movement of the attached
chain/rope. These ecosystems have already suffered serious decline from man-made coastline, land-based pollutants and climate change (Coll et al., 2012; Forrester et al., 2015; Hughes et al., 2003; Waycott et al., 2009). Locating and quantifying areas of anchoring pressure is an essential, basic step in a multiple-use zoning approach, avoiding conflicting use of zones and facilitating impact
management. Anchoring pressure has been the subject of local studies based on direct observations (Francour et al., 1999), aerial photography (Bonhomme et al., 2013; F. Holon et al., 2015) or models combining geophysical, ecological, and social components (Kininmonth et al., 2014).
Automatic identification systems (AIS) can help to locate and quantify anchoring pressure. AIS are designed to provide information about the ship to other ships and to coastal authorities
automatically. Since 31th December 2004, the regulation requires “AIS to be fitted aboard all ships of
300 gross tonnage and upwards engaged on international voyages, cargo ships of 500 gross tonnage and upwards not engaged on international voyages and all passenger ships irrespective of size” for safety reasons (International Maritime Organization, 2016). Data are exchanged between ships, terrestrial AIS bases and satellites. Most of the pleasure boats are not concerned by the regulation as they are shorter than 24 m (Direction générale des infrastructures, des transports et de la mer, 2015) and a few of them are expected to voluntarily use an AIS.
This work outlines a new method of using data from this automatic tracking system to locate and quantify anchoring pressure along 1800 km of coastline over six years. The impact of this pressure is outlined using a seabed habitat map (11 classes including seagrass and biogenic reefs). A comparison of these results with aerial and land-based observations is performed to estimate the bias of AIS data.
1. MATERIAL AND METHODS
1.1. Study area and existing seabed maps
This work considers the whole Mediterranean French coast including Corsica i.e., 1800 km coastline between 0 and -80 m. This area was chosen to take advantage of an existing seabed habitat map. This 1:10 000 seabed habitat map (between 0 and -80 m) was freely obtained from the “DONIA Expert” project, hosted by the cartographic platform Medtrix (www.medtrix.fr). This continuous map was built in 2014 using a combination of aerial pictures, multi-beam echosounder data, side-scan sonar data and direct observations (“ground-truth points”) by divers (Holon et al., 2015; Holon, 2015). Eleven habitat classes were considered: Cymodocea nodosa seagrass, Posidonia oceanica seagrass, dead matte association, infralittoral shingle association, infralittoral soft bottoms, photophilous algae association, coralligenous reefs (= biogenic reefs), circalittoral soft bottoms, artificial habitats, offshore rocks and the bathyal zone. Dead matte association is the habitat resulting from the death of P. oceanica seagrass beds (Boudouresque et al., 2012).
1.2. AIS ship data pre-treatment
For this work, AIS data were purchased from MarineTraffic.com for a six-year period from 2010 to 2015 along the Mediterranean French coastline. No data prior to 2010 were available. Our request concerned data received by terrestrial AIS bases with an hourly frequency for vessels declared as “anchored”. The dataset contained the following fields for over two million (2145523) AIS positions: vessel identity (Maritime Mobile Service Identity – MMSI), speed, position (longitude and latitude), course, heading, timestamp and vessel length. Vessel length was found to be unusable because of a high number of null, missing or incorrect data because this field is manually recorded when AIS is installed.
First, anchoring positions were localised and vessels that were not anchored (false positives) were removed if they did not meet the following conditions: speed < 1 knot, distance between the hourly AIS points ≤ 600 m (300-meters-long vessels are now common in maritime transport) and AIS points per vessel ≥ 4. Anchored vessels are generally not totally immobile and often drift with current, wind and/or swell around the anchor according to a circle or an arc of a circle pattern (Figure 1). A regression
3 circle and its centre were defined as the anchoring position for each vessel using the “lsfit.circle” function of the Circular v.0.4-7 package (Agostinelli and Lund, 2013) with R version 3.2.4 (R Core Team 2015). In the case of the radius being higher than 600 m (highly clustered points or aligned points) or when the centre was positioned on land or within harbours (“harbour” layer obtained from (Meinesz et al., 2010)), the centroid, instead of the centre of the circle, was taken as the anchoring position. It was also verified that no anchoring points were identified within the 27 equipped mooring areas declared and controlled by prefectural decrees.
4 Figure 1. Examples of anchoring zones (grey) and anchoring impact areas (yellow). a) Anchoring areas (grey) are determined from AIS data. Each colour represents a different anchoring. Estimated anchoring positions are
5 presented in red. b) Anchoring zone was reduced of one third in a concentric manner to define anchoring impact areas.
1.3. Anchoring impact analysis
An anchoring zone was defined as a polygon including the anchoring position of a vessel and its AIS points. Anchoring zones partly covering land or harbours were removed from the dataset. The area of each anchoring zone was reduced by one third in a concentric manner to remove the chain length placed in the water column and to define the anchoring impact area (Figure 1) (Boudouresque et al., 2012). Anchoring duration was calculated based on the first and last AIS points (date and time) used to define the area. A grid composed of 20 x 20 m cells was applied and the duration was divided by the area of the anchoring zone and multiplied by the area of cell occupied by the anchoring zone polygon to determine a proportional anchoring duration per cell (400 m²). Anchoring density was studied through the number of anchored vessels per cell and per year as well as the time interval between two anchorings. Combining this with the seabed habitat map allows studying the impact of anchoring (range, duration, seasonality) on these habitats. This part of the work was performed using ArcMap version 10.0 and Qgis 2.13.3.
1.4. Comparison between AIS and observation data
To estimate the bias of AIS data, it was compared with existing field observations. Anchored vessels were counted and their length estimated in the framework of two studies: i) from the coastline at 12h00 UTC over 21 days (15 May - 30 September) in 2014 between the capes of Nice and Ail (Meinesz and Miranda, 2014) and ii) from a plane over three days (26July 12h55 pm to 1h20 pm, 10 August 11h14 am to 11h22 am UTC and 25 September 09h52 am to 09h56 am UTC) in 2014 (MEDOBS project, http://medtrix.fr). These data were compared with AIS data obtained from the same days, within the same areas and time slots through analyses of variance (ANOVAs).
2. RESULTS
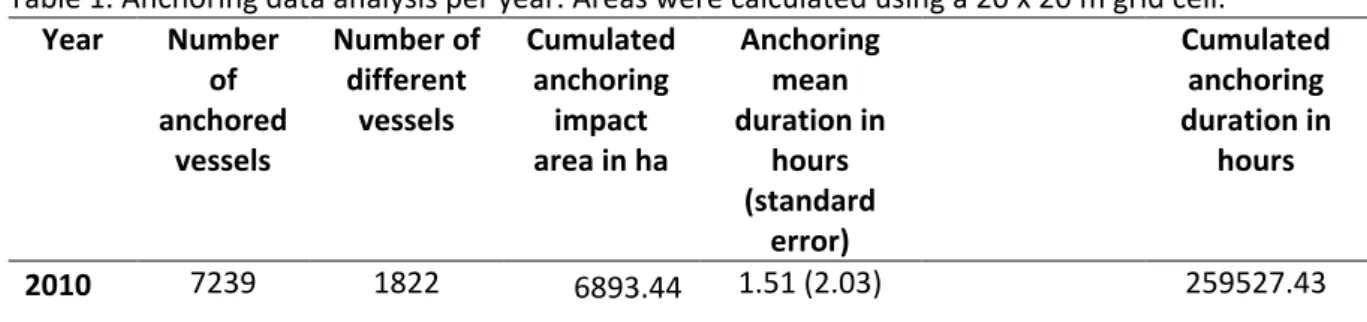
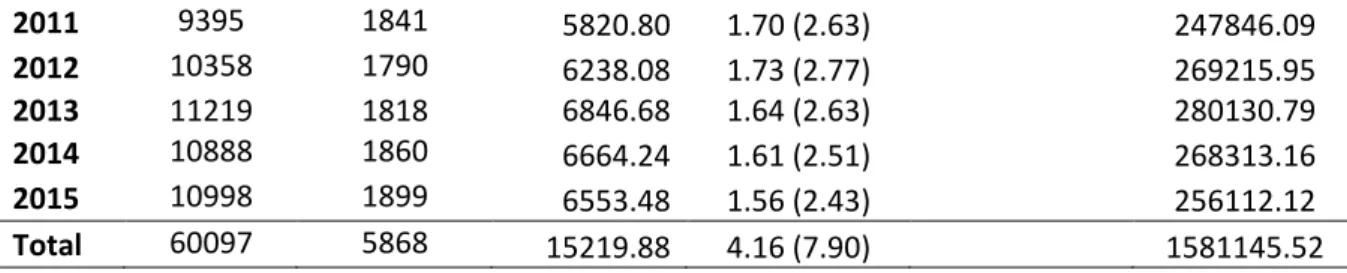
The database obtained from Marine Traffic contained data from 12447 different vessels (around 2000 different vessels per year over six years). After the pre-treatment, and after removing any anchoring zones partly covering harbours or land, 60097 anchoring impact areas were analysed for a total cumulated impact area of 79214.99 ha (median = 3964.33 m²). This corresponded to 5868 different vessels (around 1 800 per year) for 2065457 AIS positions (Table 1). During the study (2010-2015), the highest number of anchored vessels was observed between May and September with maximal values in July (12623) and August (12770) (Figure 2). Anchoring lasted for an average of 27.63 hours (median = 14.55 ±47.07) and was observed at an average of -20 m. Most of the anchored time was spent during the night (883530 hours compared with 779401 hours during the daytime). The annual cumulated anchoring durations were similar each year (Anova: F=0.73; P=0.60), in contrast to cumulated anchoring impact areas which varied by year (F=198.87; P<0.001) with the total highest impact area found in 2010. Each grid cell hosted an average of 1.15 anchored vessels per grid cell (20 x 20 m) per year (no significant variation between years; F=651.23, P<0.001) with a maximum of 26 vessels per cell observed in 2015. The interval between two anchorings within one grid cell varied from 0.04 h to 8886.71 h (370 days) with a mean interval of 1350.56 h (median =997.62 ±1284.42 h), i.e., 56 days.
Table 1. Anchoring data analysis per year. Areas were calculated using a 20 x 20 m grid cell. Year Number of anchored vessels Number of different vessels Cumulated anchoring impact area in ha Anchoring mean duration in hours (standard error) Cumulated anchoring duration in hours 2010 7239 1822 6893.44 1.51 (2.03) 259527.43
6 2011 9395 1841 5820.80 1.70 (2.63) 247846.09 2012 10358 1790 6238.08 1.73 (2.77) 269215.95 2013 11219 1818 6846.68 1.64 (2.63) 280130.79 2014 10888 1860 6664.24 1.61 (2.51) 268313.16 2015 10998 1899 6553.48 1.56 (2.43) 256112.12 Total 60097 5868 15219.88 4.16 (7.90) 1581145.52
Figure 2. Anchoring seasonality based on AIS data (all years from 2010 to 2015 were considered). Most of the anchoring density was located east of the mainland coastline (99 % of the total impact area) with four zones having 80.7 % of the total impact areas: Fos-sur-mer,
Cannes/Golfe-Juan/Antibes, Beaulieu / Villefranche-sur-mer and Saint-Tropez (Figure 3Erreur ! Source du renvoi introuvable.). 0 2000 4000 6000 8000 10000 12000 14000 Num ber of anchore d ves se ls
7 Figure 3. Anchoring pressure density (all the anchoring impact areas are overlaid) along the Eastern Mediterranean French coastline between 2010 and 2015. The four zoomed areas show the most impacted seabeds. The scale varies between 0 and 100 where 100 corresponds to the maximal number of overlaid areas.
Between 0 and -80 m, almost one third (29.49 %) of the seabed habitats were subjected to anchoring pressure between 2010 and 2015 (Table 2). The most impacted habitats (in terms of areas) were circalittoral soft bottom (6 022 ha), infralittoral soft bottom (4 488 ha) and P. oceanica seagrass (3 772 ha). Proportionally to its presence along the coastline, P. oceanica dead matte association was the most impacted habitat (11.13 %) followed by C. nodosa seagrass (5.27 %) and P. oceanica seagrass (4.52 %). In terms of duration, P. oceanica seagrass beds were also the most occupied habitats (36.40 hours of anchoring/ha/year) (Table 2).
8 Table 2. Anchoring pressure analysis of seabed habitats. Areas were calculated using a 20 x 20 m grid cell.
Marine habitats Total habitat area (ha) Area subjected to anchoring (ha) Percent of habitat impacted by anchoring (%) Anchoring duration during the 6-year study (hours) Anchoring duration / ha of impacted habitat / year (hours) Infralittoral soft bottom 117576.16 4487.84 3.82 669857 24.88 Circalittoral soft bottom 446530.61 6021.88 1.35 484191 13.40
Coralligenous reefs 4787.81 69.72 1.46 5910 14.13
Artificial habitats 279.25 0.64 0.23 43 11.20
P. oceanica seagrass 83534.30 3771.84 4.52 262010 11.58
P. oceanica dead matte
association 5980.48 665.68 11.13 145397 36.40 Photophilous algae association 15339.39 149.72 0.98 10453 11.64 Offshore rocks 858.62 2.72 0.32 201 12.32 infralittoral shingle association 207.33 0.84 0.41 29 5.75 C. nodosa seagrass 498.28 26.28 5.27 2942 18.66 Bathyal zone 121559.02 22.68 0.02 112 0.82 Total 797151.26 15219.84 29.49 1581145 160.77
A comparison with observation data allowed the estimation of the bias of the method (Figure 4). In total, 5572 vessels were observed by counting from the coast (Meinesz and Miranda, 2014) while 299 vessels were counted from AIS data at the same place and during the same period, i.e. a number 19 times lower. However, the number of large vessels (>50 m) observed was similar with the number of vessels counted from AIS data (Anova: F=0.34; P=0.56). The number of vessels estimated from AIS was also much lower than the number counted by aerial observation (Anova: F = 38.65; P<0.01).
9 Figure 4. Comparison between the number of anchored vessels estimated from AIS data and vessels counted from the coastline (Meinesz and Miranda, 2014) with a length estimation, and vessels counted from a plane (MEDOBS project, http://medtrix.fr). No length is given for vessels obtained from AIS data or from aerial observation. Data were recorded within the bay of Villefranche-sur-mer and the Cap Ferrat Natura 2000 area.
3. DISCUSSION
This paper presents, step by step, an effective methodology using AIS data to localise and quantify anchoring pressure in several ways (number of anchored vessels, anchoring impact areas, duration, intervals between anchoring) along a large coastline (1800 km). AIS produces good quality data for its cost; it allows an automatic pre-treatment and analysis of a large amount of quantitative and
accurate data to estimate anchoring positions and impact areas. Contrary to the analysis of satellite imagery, there is no risk of false positives (Pieralice et al., 2014). Based on the present results, there are several possibilities of use: to estimate anchoring pressure from a temporal viewpoint, i.e., time of day, season, year (anchoring was higher during the night and summer) or a spatial viewpoint (several concentration areas were localised to the east of the study zone), and/or in investigating seabed habitats by coupling the results with a seabed habitat map. Anchoring density and time intervals between anchor deployments may also be coupled with the biological resilience of the habitats to better estimate the impact of anchoring pressure. Another huge advantage of our method is that it allows identification of boats, and thus the owners (and captains), origin harbours and frequently used harbours. This is useful information for coastline management as it gives an answer to the question of “where and when to act?”. It also provides information for awareness campaigns aimed at changing habits. This type of result might also help influence stakeholders in balancing the economic value brought by boating with the environmental cost. The abundant literature devoted to these questions confirms the interest of managers of marine protected areas (MPA) and coastline managers (Giakoumi et al., 2015; La Manna et al., 2015; Venturini et al., 2016). However, there is a limitation to AIS, hindering its potential. AIS data only give access to around 1/20 of boat anchorings with a bias in favour of larger ones. These vessels represent a minority of the maritime transport and recreational vessels registered along this coastline (Direction générale des infrastructures, des transports et de la mer, 2015; Ministère de l’Ecologie, du Développement Durable et de l’Energie, 2013). For example in 2015, French Mediterranean coastline counted 404
0 50 100 150 200 250 300 350 Number of anc hored ve ss el s < 10m 10-24m 25-50m > 50m AIS Plane
10 854 registered pleasure (motor and sailing) boats, most of them (86 %) were shorter than 8 m
(Direction générale des infrastructures, des transports et de la mer, 2015). However, we envisage that use of AIS will increase and that increasing numbers of ships will be equipped with it in the future, since it provides useful information to vessel captains. In the absence of a global regulation requiring the use of AIS, the data will only be improved by the modernisation of vessels and the goodwill of captains and owners. Large vessels (here high standing pleasure boats and commercial vessels) represent the most important economic value but they also have the biggest anchors and the longest chains and are thus able to produce the greatest damage to seabed habitats. For example, a large (50 m) vessel anchored overnight on a coral reef caused rapid losses of coral and reef structural complexity, equal to the cumulative decline over 23 years observed at an adjacent site (Forrester et al., 2015). Another limit of this work is that it does not consider the type of anchor and the resulting potential difference to the impact on the seabed (Milazzo et al., 2004). However, the type of anchor and the location of small vessels not equipped with AIS could be provided in the future by smartphone applications like the free DONIA® and Anchor Watch® smartphone applications or others that are provided for a payment like Navionics®.
Finally, this present work provides important data for seabed habitat conservation. One-third of the coastal seabed (0 to -80 m) is used for anchoring by big vessels, with more than 80 % of these impact areas distributed among four small zones in the east. Three of these zones contain tourist activities while the last zone (Fos-sur-mer) contains commercial boats waiting to unload. Despite this localised intense “parking” use, no regulations or mooring equipment do exist within these areas. However, this is beginning to change with, for example, a lighted buoyed mooring area project near St Tropez (Commune de Ramatuelle, 2016) and the new prefectoral decree N°155/2016 that controls the mooring of vessels longer than 45 m in French inshore and territorial waters (Préfecture maritime de Méditerranée, 2016). The latter falls within three European Framework directives (Marine Strategy Framework Directive of 17 June 2008 (2008/56/EC), Water Framework Directive (2000/60/EC) and the “Habitats” directive (92/43/CEE)) aimed at preserving habitats and species of community interest, including P. oceanica. Our results show that P. oceanica seagrass beds are the most impacted habitat in terms of duration (36.40 hours of anchoring/ha/year) and also one of the three most impacted habitats in terms of area proportional to their seabed cover (4.52 %). Seagrass beds are, proportional to their presence, the most impacted habitat: around 10 % of impacted areas consisted of living seagrass beds and around 11 % consisted of dead seagrass beds (dead matte). The impact of anchoring on seagrass beds has already been highlighted by less accurate global analysis of aerial images (Florian Holon et al., 2015). This highly fragile habitat has been greatly studied for its sensitivity to anchoring pressure (Boudouresque et al., 2012; Francour et al., 1999; Milazzo et al., 2004; Montefalcone et al., 2008) and the consequences of anchors and anchoring chain systems during boat drift means dead matte lines and ‘furrows’ are visible underwater by sonar and aerial views (Abadie et al., 2016, 2015; Holon et al., 2015). Our study shows that a grid cell (400 m²)
receives an anchor deployment every 56 days on average and 370 consecutive days was the maximal period free from anchoring. These are minimal values as small vessels are largely underestimated and generally anchored at shallower depths than large vessels. This is insufficient to permit a habitat to recover, especially in the case of P. oceanica meadow (a protected habitat and plant) whose average horizontal progression is no more than 3-4 cm per year (Boudouresque et al., 2012). For example, meadows destroyed during the second world war are still not completely recolonised 80 years later (Holon et al., 2015). This sensitive habitat faces other stressors (e.g., climate change and pollution from waste waters) and how synergistic, antagonistic or additive the combined effects of these stressors are remains undetermined. In the meantime, it is important to improve human behaviours as this study shows that large boats still anchor within highly sensitive habitats, despite equipment that could help them to avoid these areas. The problem could be that captains either do not know which seabed habitat they occupy during the mooring and that seabed habitats are not similarly sensitive (and that some of them are even protected), or are uninterested in seabed habitat sensitivity (Balaguer et al., 2011; Lloret et al., 2008) because they do not risk anything if they damage
11 a protected habitat by using their anchor. Enhancing the broadcast of seabed habitat maps to sea users (see a first initiative through the free DONIA® application) and well-adjusted awareness campaigns could help to improve these points. Even if it is not their aim, AIS data may help to detect and identify, at the time or afterward, vessels that do not respect the law and damage protected habitats. These vessels could be targeted for education actions.
Acknowledgement:
This study was partly funded by the French Water Agency (Agence de l’eau Rhône-Méditerranée- Corse). The authors thank Gwenaelle Delaruelle (Andromède océanologie) for her help with data provided by the Medtrix platform especially for the habitats maps (DONIA expert data) and Cathy-Anna Valentini-Poirier (Agence de l’eau RMC) for her help with MEDOBS data. They also thank Marine Boursault (Andromède océanologie) who obtained the location of equipped mooring areas declared and controlled by prefectural decrees and Guilhem Marre (Andromède océanologie) who analysed the time interval data.
References
Abadie, A., Gobert, S., Bonacorsi, M., Lejeune, P., Pergent, G., Pergent-Martini, C., 2015. Marine space ecology and seagrasses. Does patch type matter in Posidonia oceanica seascapes? Ecological Indicators 57, 435–446. doi:10.1016/j.ecolind.2015.05.020
Abadie, A., Lejeune, P., Pergent, G., Gobert, S., 2016. From mechanical to chemical impact of anchoring in seagrasses: The premises of anthropogenic patch generation in Posidonia
oceanica meadows. Marine Pollution Bulletin 109, 61–71.
doi:10.1016/j.marpolbul.2016.06.022
Agostinelli, C., Lund, U., 2013. R package “circular”: Circular Statistics (version 0.4-7). URL project.org/projects/circular/ [WWW Document]. URL
https://r-forge.r-project.org/projects/circular/
Balaguer, P., Diedrich, A., Sardà, R., Fuster, M., Cañellas, B., Tintoré, J., 2011. Spatial analysis of recreational boating as a first key step for marine spatial planning in Mallorca (Balearic Islands, Spain. Ocean & Coastal Management 54, 241–249.
Ballesteros, E., 2006. Mediterranean coralligenous assemblages: a synthesis of present knowledge. Oceanography and Marine Biology: An Annual Review 44, 123–195.
Bonhomme, P., Bonhomme, D., Frachon, N., Boudouresque, C.-F., Borocco, S., Bricout, R., Schohn, T., Imbert, T., Ruitton, S., 2013. A method for assessing anchoring pressure. Presented at the 40th CIESM congress, Marseille.
Boudouresque, C.-F., Bernard, G., Bonhomme, P., Charbonnel, E., Diviacco, G., Meinesz, A., Pergent, G., Pergent-Martini, C., Ruitton, S., Tunesi, L., 2012. Protection and conservation of Posidonia
oceanica meadows. RAMOGE and RAC/SPA publisher, Tunis.
Cappato, A., 2011. Cruises and recreational boating in the Mediterranean. Plan bleu- UNEP/MAP regional activity centre, Nice Sophia Antipolis.
Coll, M., Piroddi, C., Albouy, C., Ben Rais Lasram, F., Cheung, W.W.L., Christensen, V., Karpouzi, V.S., Guilhaumon, F., Mouillot, D., Paleczny, M., Palomares, M.L., Steenbeek, J., Trujillo, P., Watson, R., Pauly, D., 2012. The Mediterranean Sea under siege: spatial overlap between marine biodiversity, cumulative threats and marine reserves: The Mediterranean Sea under siege. Global Ecology and Biogeography 21, 465–480. doi:10.1111/j.1466-8238.2011.00697.x Commune de Ramatuelle, 2016. Anchorage in the Pampelonne bay.
Costanza, R., D’Arge, R., De Groot, R., Farber, S., Grasso, M., Hannon, B., Limburg, K., Naeem, S., O’Neill, R.V., Paruelo, J., Raskin, R.G., Sutton, P., van Den Belt, M., 1997. The value of the world’s ecosystem services and natural capital. Nature 387, 253–260.
doi:http://dx.doi.org/10.1038/387253a0.
Davis, G.E., 1977. Anchor damage to a coral reef on the coast of Florida. Biological Conservation 11, 29–34.
12 Direction générale des infrastructures, des transports et de la mer, 2015. Le secteur économique de
la plaisance. Statistiques 2015 [WWW Document]. Ministère de l’Environnement, de l’Energie et de la Mer. URL
http://www.developpement-durable.gouv.fr/IMG/pdf/plaisqqc2015c.pdf (accessed 7.15.16).
European Boating Industry, 2010. European boating industry: facts and figures [WWW Document]. URL http://www.europeanboatingindustry.eu/facts-and-figures
Forrester, G.E., Flynn, R.L., Forrester, L.M., Jarecki, L.L., 2015. Episodic disturbance from boat anchoring is a major contributor to, but does not alter the trajectory of long-term coral reef decline. PloS one 10, e0144498.
Francour, P., Ganteaume, A., Poulain, M., 1999. Effects of boat anchoring in Posidonia oceanica seagrass beds in the Port-Cros National Park (north-western Mediterranean Sea). Aquatic Conservation: Marine and Freshwater Ecosystems 9, 391–400.
Giakoumi, S., Brown, C.J., Katsanevakis, S., Saunders, M.I., Possingham, H.P., 2015. Using threat maps for cost-effective prioritization of actions to conserve coastal habitats. Marine Policy 61, 95– 102. doi:10.1016/j.marpol.2015.07.004
Holon, F., 2015. Interactions entre écosystèmes marins et pressions anthropiques. Applications au suivi et à la gestion des eaux côtières de la mer Méditerranée. University of Montpellier, France.
Holon, F., Boissery, P., Guilbert, A., Freschet, E., Deter, J., 2015. The impact of 85 years of coastal development on shallow seagrass beds (Posidonia oceanica L. (Delile)) in South Eastern France: A slow but steady loss without recovery. Estuarine, Coastal and Shelf Science 165, 204–212. doi:10.1016/j.ecss.2015.05.017
Holon, F., Mouquet, N., Boissery, P., Bouchoucha, M., Delaruelle, G., Tribot, A.-S., Deter, J., 2015. Fine-Scale Cartography of Human Impacts along French Mediterranean Coasts: A Relevant Map for the Management of Marine Ecosystems. PLOS ONE 10, e0135473.
doi:10.1371/journal.pone.0135473
Hughes, T.P., Baird, A.H., Bellwood, D.R., Card, M., Connolly, S.R., Folke, C., Grosberg, R., Hoegh-Guldberg, O., Jackson, J.B.C., Kleypas, J., others, 2003. Climate change, human impacts, and the resilience of coral reefs. science 301, 929–933.
International Maritime Organization, 2016. AIS transponders [WWW Document]. International Maritime Organization. URL
http://www.imo.org/fr/OurWork/Safety/Navigation/Pages/AIS.aspx (accessed 10.7.16). Kininmonth, S., Lemm, S., Malone, C., Hatley, T., 2014. Spatial vulnerability assessment of anchor
damage within the Great Barrier Reef World Heritage Area, Australia. Ocean & Coastal Management 100, 20–31. doi:10.1016/j.ocecoaman.2014.07.003
La Manna, G., Donno, Y., Sarà, G., Ceccherelli, G., 2015. The detrimental consequences for seagrass of ineffective marine park management related to boat anchoring. Marine Pollution Bulletin 90, 160–166. doi:10.1016/j.marpolbul.2014.11.001
Lloret, J., Zaragoza, N., Caballero, D., Riera, V., 2008. Impacts of recreational boating on the marine environment of Cap de Creus (Mediterranean Sea). Ocean and Coastal Management 51, 749– 754.
Meinesz, A., Chancollon, O., Garcia, D., Markovic, L., 2010. Côtes méditerranéennes françaises, inventaire Observatoire de l’impact des aménagements construits sur la mer. Rapport final. Laboratoire ECOMERS – Université de Nice-Sophia Antipolis ECOMERS-UNSA publ., Nice. Meinesz, C., Miranda, J., 2014. Document d’objectifs du site Natura 2000 FR 9301996 « Cap Ferrat » -
Tome 0 - Etude de fréquentation au mouillage – période estivale 2014. Métropole Nice Côte d’Azur.
Milazzo, M., Badalamenti, F., Ceccherelli, G., Chemello, R., 2004. Boat anchoring on Posidonia
oceanica beds in a marine protected area (Italy, western Mediterranean): effect of anchor
types in different anchoring stages. Journal of Experimental Marine Biology and Ecology 299, 51–62. doi:10.1016/j.jembe.2003.09.003
13 Ministère de l’Ecologie, du Développement Durable et de l’Energie, 2013. Flotte de commerce sous
pavillon Français. Etat au 1er Janvier 2013 (Statistiques). Paris.
Montefalcone, M., Chiantore, M., Lanzone, A., Morri, C., Albertelli, G., Bianchi, C.N., 2008. BACI design reveals the decline of the seagrass Posidonia oceanica induced by anchoring. Marine Pollution Bulletin 56, 1637–1645.
Pieralice, F., Proietti, R., La Valle, P., Giorgi, G., Mazzolena, M., Taramelli, A., Nicoletti, L., 2014. An innovative methodological approach in the frame of Marine Strategy Framework Directive: A statistical model based on ship detection SAR data for monitoring programmes. Marine Environmental Research 102, 18–35. doi:10.1016/j.marenvres.2014.07.006
Préfecture maritime de Méditerranée, 2016. Arrêté préfectoral N°155/2016 réglementant le mouillage des navires dans les eaux intérieures et territoriales françaises de Méditerranée [WWW Document]. URL https://www.premar-mediterranee.gouv.fr/arretes.html (accessed 9.1.16).
Short, F.T., Wyllie-Echeverria, S., 1996. Natural and human-induced disturbance of seagrasses. Environmental Conservation 23, 17–27.
United Nations Conference on Trade and Development (UNCTAD), 2015. Review of maritim transport 2015. UNCTAD/RMT/2015, New York and Genova.
USCG boating, 2011. 2011 National recreational boating Survey.
Venturini, S., Massa, F., Castellano, M., Costa, S., Lavarello, I., Olivari, E., Povero, P., 2016.
Recreational Boating in Ligurian Marine Protected Areas (Italy): A Quantitative Evaluation for a Sustainable Management. Environmental Management 57, 163–175. doi:10.1007/s00267-015-0593-y
Walker, B., Gilliam, D.S., Dodge, R.E., Walczak, J., 2012. Dredging and shipping impacts on southeast Florida coral reefs. Presented at the 12th International Coral Reef Symposium, p. 5.
Waycott, M., Duarte, C.M., Carruthers, T.J., Orth, R.J., Dennison, W.C., Olyarnik, S., Calladine, A., Fourqueran, J.W., Heck, K.L., Hughes, A.R., others, 2009. Accelerating loss of seagrasses across the globe threatens coastal ecosystems. Proceedings of the National Academy of Sciences 106, 12377–12381.