HAL Id: hal-00452789
https://hal.archives-ouvertes.fr/hal-00452789
Submitted on 3 Feb 2010HAL is a multi-disciplinary open access archive for the deposit and dissemination of sci-entific research documents, whether they are pub-lished or not. The documents may come from teaching and research institutions in France or abroad, or from public or private research centers.
L’archive ouverte pluridisciplinaire HAL, est destinée au dépôt et à la diffusion de documents scientifiques de niveau recherche, publiés ou non, émanant des établissements d’enseignement et de recherche français ou étrangers, des laboratoires publics ou privés.
δ13C in Mytilus edulis shells: relation to salinity, DIC,
phytoplankton and metabolism
David Paul Gillikin, Anne Lorrain, S. Bouillon, F. Dehairs, Philippe Willenz
To cite this version:
David Paul Gillikin, Anne Lorrain, S. Bouillon, F. Dehairs, Philippe Willenz. δ13C in Mytilus edulis shells: relation to salinity, DIC, phytoplankton and metabolism. Organic Geochemistry, Elsevier, 2006, 37 (10), pp.1371-1382. �hal-00452789�
δ
13C in Mytilus edulis shells: relation to salinity, DIC, phytoplankton and
metabolism
DAVID PAUL GILLIKIN*
Department of Analytical and Environmental Chemistry, Vrije Universiteit Brussel, 1050 Brussels, Belgium. Tel.: +32-2-629-1265; fax: +32-2-629-3274; Present address: Department of Geological Sciences, The State University of New York at New Paltz, 75 South Manheim Boulevard, New Paltz, New York 12561, USA
10
20
30
E-mail addresses: david.gillikin@vub.ac.be, david@scientificproofreading.com; *Corresponding author.
ANNE LORRAIN
Section of Petrography-Mineralogy-Geochemistry, Royal Museum for Central Africa, 3080 Tervuren, Belgium. Present address: IRD, UR THETIS, Centre de Recherche Halieutique, 34203 Sète, France.
STEVEN BOUILLON
Department of Analytical and Environmental Chemistry, Vrije Universiteit Brussel, 1050 Brussels, Belgium
PHILIPPE WILLENZ
Department of Invertebrates, Royal Belgian Institute of Natural Sciences, B-1000 Brussels, Belgium
FRANK DEHAIRS
Department of Analytical and Environmental Chemistry, Vrije Universiteit Brussel, 1050 Brussels, Belgium
Abstract
Bivalve shells can potentially record the carbon isotopic signature of the dissolved inorganic carbon (δ13CDIC) in estuarine waters, thereby providing information about past estuarine
biogeochemical cycles. However, the fluid from which these animals calcify is a ‘pool’ of metabolic CO2 and external dissolved inorganic carbon (DIC). The incorporation of respired 13C
depleted carbon into the skeletons of aquatic invertebrates is well documented, and may affect the δ13C
DIC record of the skeleton. Typically, less than 10 % of the carbon in the skeleton is
metabolic in origin, although higher amounts have been reported. If this small offset is more or less constant, large biogeochemical gradients in estuaries may be recorded in the δ13C value of bivalve shells. In this study, it is assessed if the δ13C values of Mytilus edulis shells can be used as a proxy of δ13CDIC as well as provide an indication of salinity. First, the δ13C values of
respired CO2 (δ13CR) was considered using the δ13C values of soft tissues as a proxy for δ13CR.
Along the strong biogeochemical gradient of the Scheldt estuary (The Netherlands – Belgium), δ13CR was linearly related to δ13CDIC (r2 = 0.87), which in turn was linearly related to salinity (r2
= 0.94). The mussels were highly selective, assimilating most of their carbon from phytoplankton out of the total particulate organic carbon (POC) pool. However, on a seasonal basis, tissue δ13C varied differently than δ13CDIC and δ13CPOC, most likely due to lipid content of
the tissue. All shells contained less than 10 % metabolic C, but ranged from near zero to 10 %, thus excluding the use of δ13C in these shells as a robust δ13CDIC or salinity proxy. As an
example, an error in salinity of about five would have been made at one site. Nevertheless, large changes in δ13CDIC (>2 ‰) can be determined using M. edulis shell δ13C.
40
50
Keywords: biogenic carbonate, mollusk, proxy, estuary, carbon isotopes, bivalve, salinity,
1.
I
NTRODUCTIONThe stable carbon isotopic composition of dissolved inorganic carbon (δ13CDIC) in estuarine
waters is a valuable tool for tracing biogeochemical cycling of carbon (Mook and Tan, 1991; Hellings et al., 1999; Bouillon et al., 2003). Having past records of δ13CDIC would not only be
useful to determine past biogeochemical processing, but would also give insight into anthropogenic pollution (both atmospheric and riverine) (Hellings et al., 2001) and upwelling (Killingley and Berger, 1979). Bivalve shell geochemistry has long been known to reflect the environmental conditions under which the bivalve grew (Epstein et al., 1953; Mook and Vogel, 1968; Mook, 1971; Dettman et al., 2004). Originally, bivalve shell carbonate δ13C was believed to track δ13CDIC (Mook and Vogel, 1968; Killingley and Berger, 1979; Arthur et al., 1983).
However, more recently it has been proposed that the carbonate skeleton is synthesized from both DIC, as well as organically derived CO2 from internal respiration (Dillman and Ford, 1982;
Swart, 1983; Tanaka et al., 1986; McConnaughey et al. 1997; Furla et al. 2000; Lorrain et al., 2004; and others), which both affect the skeletal stable carbon isotopic signature (δ13CS). The
amount of respired carbon ending up in the skeleton is species specific, with most aquatic animals incorporating less than 10 % (or < 2 ‰ offset from δ13C
S equilibrium with δ13CDIC in
marine settings) (McConnaughey et al., 1997; Kennedy et al., 2001; Lorrain et al., 2004; Gillikin et al., 2005a), but may reach as high as 35 % (Gillikin, 2005). Therefore it is of interest to have a better understanding of what controls the δ13C value of respired CO2. As there has
been much work on the isotope geochemistry of Mytilus edulis shells (Epstein et al., 1953; Mook and Vogel, 1968; Mook, 1971; Tanaka et al., 1986; Vander Putten et al., 2000), this species is the ideal candidate for this study.
60
70
80
The δ13C value of respired CO2 (δ13CR) can be roughly estimated from the tissue δ13C value. At
the pH of bivalve body fluids (7 – 8; Crenshaw, 1972), more than 90 % of CO2 hydrates and
ionizes to produce HCO3-, which should be at most 1 ‰ enriched in 13C compared to the
respiring tissue (McConnaughey et al., 1997). Yet, considering other processes affecting the δ13CR, it has been estimated to be 0.5 ‰ heavier than the tissues on average, but this difference
can generally be ignored (McConnaughey et al., 1997). However, a recent study on a zooxanthellate scleractinian coral suggested that δ13CR might not always follow tissue δ13C
(Swart et al., 2005). The amount of respired CO2 in the skeleton can be approximated using the
90
100
110
120
M(δ13CR) + (1 – M) * δ13CDIC = δ13CS – εcl-b (1)
where M is the percent metabolic CO2 contribution and εcl-b is the enrichment factor between
calcite and bicarbonate (1.0 ± 0.2 ‰ in Romanek et al., 1992). Other factors may also play a role in determining the δ13C value of the internal DIC pool. For example, the enzyme carbonic anhydrase (CA), which catalyses the reaction of bicarbonate to CO2 to facilitate the diffusion of
DIC through membranes (Paneth and O’Leary, 1985), may add or remove carbon species from this pool. Activity of CA is known to change with salinity in some bivalves, but is tied to osmoregulation (Henry and Saintsing, 1983). Since M. edulis does not osmoregulate (Newell, 1989), salinity should not affect CA activity in these organisms. Nevertheless, CA activity itself has been shown to be inhibited by Cl- ions (Pocker and Tanaka, 1978). A reduction in CA activity could cause a reduction in environmental DIC entering the animal, resulting in a larger ratio of metabolic DIC and more negative δ13C in the calcifying fluid.
Considering that many bivalves incorporate only a small amount of respired CO2, their
skeletons should be able to trace large changes in δ13CDIC, as was found by Mook and Vogel
(1968) and Mook (1971) for M. edulis in the Scheldt estuary (The Netherlands). This is also true if the offset is constant as was found in a freshwater mussel (Kaandorp et al., 2003). Such shell data could then be useful for determining the δ13CDIC and the salinity where the animals grew.
Considering that shell δ13C values are not dependent on temperature (i.e., the
calcite-bicarbonate enrichment factor is independent of temperature between 10 and 40 ºC; Romanek et al., 1992), this would also provide a valuable addition to the interpretation of shell δ18O profiles, which are dependent on both temperature and salinity, or more precisely, the δ18O value of the water (see Gillikin et al., 2005a for more discussion). Unfortunately, unlike other biogenic carbonates, many minor elements (e.g., Sr, Mg) in bivalves cannot be used to obtain reliable paleo-environmental information (Stecher et al., 1996; Vander Putten et al., 2000; Gillikin et al., 2005b; Lorrain et al., 2006). Therefore, δ13CS may provide an alternative to estimate salinity and
thus allow a better estimation of the δ18O value of the water. To evaluate this potential proxy, the δ13C values of M. edulis shells and mantle tissues, DIC, and particulate organic carbon (POC) were measured across a salinity gradient and over one year in the Scheldt estuary.
2.
M
ATERIALS ANDM
ETHODSMussels (Mytilus edulis) were collected from the intertidal zone along the salinity gradient of the Scheldt estuary (Westerschelde) from Knokke (KN), Hoofdplaat (HF), Griete (GR) and Ossenisse (OS; the most upstream occurrence of wild Mytilus populations) (Fig. 1) on various dates (see Baeyens et al., 1998 for a general description of the Scheldt estuary). Mussel tissues were sampled on 17 March (n = 3), 3 May (n = 7), and 29 September 2002 (n = 13) from KN; on 17 March (n = 5), 3 May (n = 7), 28 July (n = 9), and 29 September 2002 (n = 16) from HF; and on 23 March 2002 from GR (n = 7) and OS (n = 12). One shell was sampled from KN on 20 February 2003 (shell KN1) and one on 29 September 2002 (shell KN1); from HF on 9 December 2002; from GR on 21 April 2003; and from OS on 9 December 2002 (shell OS1) and 21 April 2003 (shell OS2). It is well known that bivalve shell growth slows in colder weather (e.g., Gillikin et al., 2005a, b); therefore, even the shells sampled after the last water sampling date (Nov. 2002) will mostly correspond to the water sampling period. However, it should be kept in mind that water was sampled over the full year (monthly and bi-weekly in the spring), whereas shell growth probably is highest in spring. Mussels at HF and GR were transplanted from Wemmeldinge (WD; Fig. 1) (see Gillikin et al., 2006 for a more detailed description). 130
140
150
Mantle tissues were collected using a scalpel and were stored frozen (-20 ºC). After thawing, tissues were dried in an oven at 60 ºC for 24 h, homogenized with a mortar and pestle, and about 1 mg was placed into a silver cup. Two to three drops of 5 % HCl were added to decarbonate the sample and the cups were allowed to dry in an oven overnight, after which they were folded closed. Tissue δ13C was measured on an Element Analyzer (Flash 1112 EA ThermoFinnigan) coupled via a CONFLO III to a ThermoFinnigan DeltaplusXL isotope ratio mass spectrometer (IRMS). Using this same instrument and method, Verheyden et al. (2004) report a long term analytical precision for δ13C of 0.08 ‰ on 214 analyses of the IAEA-CH-6 standard (1σ).
Shells were sectioned along the axis of major growth and samples were drilled from the calcite layer along the growth-time axis every 300 µm using a Merchantek MicroMill and 300 µm drill bit. Although M. edulis has both calcite and aragonite shell layers, the aragonite layer is not suitable for time resolved sampling (see Vander Putten et al. 2000). Carbonate powders were reacted in a Kiel III coupled to a ThermoFinnigan DeltaplusXL dual inlet IRMS with a long-term
δ13C precision of 0.039 ‰ on the NBS-19 standard (δ13C = + 1.95 ‰, n = 292) and 0.068 ‰ on the NBS-18 standard (δ13C = - 5.04 ‰, n = 22). More details regarding the treatment of these shells can be found in Gillikin et al. (2006).
160
170
180
Near-shore water was sampled during high tide at least monthly from Nov. 2001 to Nov. 2002 for salinity, chlorophyll a concentrations (Chl a), δ13CDIC, δ13CPOC and suspended particulate
matter (SPM). Water temperature was monitored hourly at each site using a TidBit data logger (from November 2001 to May 2003) (Fig. 2). Salinity was measured in situ with a WTW multiline P4 multimeter. Chlorophyll a concentrations were determined by filtering 200 to 500 ml of seawater through Whatman GF-F filters in the field. Filters were wrapped in aluminum foil and placed in liquid nitrogen; three replicate filters per site were taken on each sampling date. In the laboratory, samples were transferred to a –85 ºC freezer until analysis at NIOO-CEME, Yerseke, NL, using reverse-phase HPLC (Gieskes et al., 1988)with a reproducibility of 2.7 % (or 0.3 µg/l; 1σ) for Chl a (based on an in-house standard, n = 7). The δ13CDIC was
determined by acidifying 5 ml of water in an 8 ml helium-flushed headspace vial, followed by overnight equilibration, and subsequently injecting 400 μl of the headspace into the carrier gas stream of the continuous flow EA-IRMS. Precision of δ13CDIC was better than 0.2 ‰ based on
replicate measurements; data were corrected using calibrated CO2 gas according to Miyajima et
al. (1995) (see Gillikin et al., 2005a and Gillikin, 2005). To approximate the δ13C value of phytoplankton, 20 ‰ was subtracted from the δ13C
DIC values (δ13CDIC–20; see Discussion). The
δ13CPOC was measured following Lorrain et al. (2003). Briefly, 200 to 500 ml of seawater was
filtered through Whatman GF-F filters, which were dried at 50 ºC, weighed, fumed in HCl vapors, wrapped in silver cups and analyzed on the EA-IRMS described above. Concentrations of SPM are based on the dry weights of these filters.
3.
R
ESULTSThe strong salinity gradient of the Schelde is obvious from the data presented in figure 3. There is a significant positive linear relationship between δ13CDIC and salinity, with δ13CDIC = Salinity
* 0.39 (± 0.03) – 13.71 (± 0.57) (r2 = 0.94, p < 0.0001, n = 63; for the salinity range of ~ 5 to 30) (Fig. 4).
There were strong linear relationships between mantle tissue and both δ13CPOC and δ13CDIC–20
for samples collected from all four sites in March 2002 (Fig. 5). The relationships are: Tissue δ13C = 0.99 (± 0.16) * δ13CDIC-20 + 4.89 (± 4.48) (r2 = 0.87, n = 27, p > 0.0001), and Tissue δ13C
= 1.97 (± 0.31) * δ13CPOC + 25.39 (± 7.87) (r2 = 0.87, n = 27, p > 0.0001). δ13CPOC and δ13CDIC
were also significantly correlated (δ13CPOC = 0.42 (± 0.09) * δ13CDIC – 21.0 (± 0.5); r2 = 0.61, n
= 59, p < 0.0001). The slope of the relationship between mantle tissue and δ13CDIC–20 was not
significantly different from one (p < 0.0001). SPM was generally high at all four sites (range = 13 to 550 mg/l, mean = 86 mg/l).
190
200
210
220
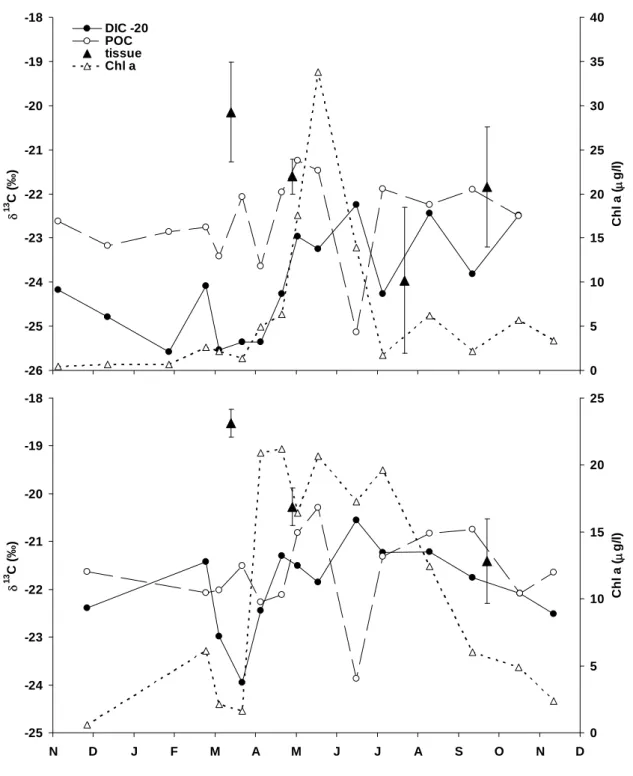
Mantle tissue δ13C varied considerably throughout the year at HF and KN, with a 2 to 3 ‰ decrease between March and September 2002 (Fig. 6). At both sites, mantle tissue was least negative in March, just before the phytoplankton bloom (as indicated by the Chl a data), but was more similar to the δ13C of potential food sources (i.e., δ13CDIC–20) in May, July and
September.
High resolution δ13CS data are provided in figure 7 and are discussed in more detail in Gillikin
et al. (2006). The average annual shell δ13C is compared with the average annual δ13CDIC at each
site in figure 8 along with the predicted equilibrium calcite based on the εcl-b from Romanek et
al. (1992). Average shell and DIC δ13C are presented in table 1 along with average salinity and metabolic C contribution to the shell. With the exception of the two shells from KN, shells were on average in equilibrium with δ13C
DIC (Fig. 8).
4.
D
ISCUSSIONMetabolic carbon sources
Although it is well established that the carbon isotope fractionation between phytoplankton and DIC is variable (Rau et al., 1992; Hinga et al., 1994; Boschker et al., 2005), a value between 18 and 22 ‰ is often used as an estimate (Cai et al., 1988; Hellings et al., 1999; Fry, 2002; Bouillon et al., 2004). Therefore, similar to Fry (2002), an average value of 20 ‰ is used in this study. From Fig. 5 it is clear that M. edulis is a highly selective feeder, as the slope between the expected δ13C of phytoplankton (i.e. δ13CDIC–20) and tissues is not significantly different from
one, whereas the slope between δ13C of tissues and δ13CPOC was far from one (slope = 2.0
±0.3). The suspended POC pool is a mixture of different sources of carbon, each with an often distinct δ13C value, such as phytoplankton, terrestrial carbon (in general, ~ -27 ‰ from C3 plants and ~ 14 ‰ from C4 plants; Mook and Tan, 1991), resuspended sediments (Scheldt: ~ -19 to -24 ‰; Middelburg and Nieuwenhuize, -1998; Herman et al., 2000), marine macro-algae detritus (Scheldt: green algae ~ -17 ‰, brown algae ~ -25 ‰; Gillikin unpublished data), microphytobenthos (Scheldt: ~ -15 ‰; Middelburg et al., 2000; Herman et al., 2000), and other components from which the mussels must select. As our samples were taken near the shore, there was probably a large amount of suspended sediments, which is indicated by the high SPM content. Particle selection can occur both at the gills (pre-ingestive) and in the gut (post-ingestive) (reviewed in Ward and Shumway, 2004), but using δ13C as a tracer deals only with assimilated carbon. Moreover, using the selectivity equation from Bouillon et al. (2004), 230
240
250
Selectivity = (Δδ13Ctissue – Δδ13CPOC / Δδ13CDIC – Δδ13CPOC) *100 [%] (2)
where Δ is the overall estuarine gradient in tissue, POC and DIC δ13C values (assumes that selectivity is similar at all stations, see Bouillon et al., 2004), suggests that the mussels are ~90 % selective, which further illustrates that they assimilate their carbon primarily from phytoplankton, which in turn obtains its carbon from the DIC pool. It is generally accepted that the δ13C value of an organism reflects the δ13C value of its diet, with little (∆δ13C = +1 ‰) or no
change (DeNiro and Epstein, 1978; Fry and Sherr, 1984). However, extreme values are not uncommon with some ∆δ13C values being greater than +3 ‰ (Post, 2002; McCutchan et al., 2003). Therefore, the intercept of the regression between tissue δ13C and phytoplankton δ13C (δ13CDIC-20) should be +1. Nevertheless, it should be kept in mind that the 20 ‰ fractionation
used in this paper is a rough estimate. The intercept of 4.89 ± 4.48 ‰ in our dataset (Fig. 5) can therefore be explained by an extreme fractionation factor between mussel tissue and phytoplankton, an error in the phytoplankton fractionation used, and/or by individual variation in tissue δ13C. Moreover, errors in this simplified model can arise from the mussels feeding on food items other than phytoplankton. Mussels have been shown to feed on dissolved organic carbon (DOC) (Roditi et al., 2000), their own and other bivalve larvae (Lehane and Davenport, 2004), zooplankton (Lehane and Davenport, 2002; Wong et al., 2003), and macroalgae detritus (Levinton et al., 2002); all with different δ13C values (see above). Nevertheless, as a first approximation, δ13CR values should roughly mirror δ13CDIC values, as has been noticed in other
significantly from the δ13C of tissues (both positive and negative deviations of up to 3 ‰), which they attributed to different compounds (e.g., lipids) being respired at various times of the year.
It is evident that the relationship between tissue δ13C and δ13CDIC found in March (Fig. 5) does
not necessarily hold true for the whole year (Fig. 6). This could be attributed to changing food sources, such as resuspended benthic algae, or variable fractionation between phytoplankton and DIC throughout the year. Indeed, Boschker et al. (2005) found that DIC – diatom fractionation varied from about 16 ‰ to 24 ‰ along this same estuary. Other factors such as temperature and phytoplankton growth rate can also influence the fractionation between phytoplankton and DIC (see Savoye et al., 2003). However, a more likely explanation is changing lipid levels in M. edulis tissues. In this species, the mantle contains much of the gonad (Morton, 1992); and in this region, M. edulis spawning peaks when temperatures exceed approximately 10 ºC (Hummel et al., 1989). At all four sites this occurs in mid-March (Fig. 2), approximately at the same time as the tissue samples were collected. As a result of spawning, the tissues would have a lower lipid content (see de Zwaan and Mathieu, 1992). Since lipids have a lighter δ13C signal than other biochemical components (Abelson and Hoering, 1961; Tieszen et al., 1983; Focken and Becker, 1998) and since the mantle exhibits a sharp drop in lipid content just after spawning (de Zwaan and Mathieu, 1992), the more positive tissue δ13C values observed for March can be explained. After the phytoplankton bloom, which begins in April or May, tissue lipid reserves would be restored, thus lowering the δ13C value. Indeed,
Lorrain et al. (2002) found that δ13C of scallop tissues were highest in spring when lipids were
low, and decreased as lipids accumulated toward late summer. In the shells, however, the spawning period is reflected by more negative δ13CS values (data not shown; see Gillikin et al.,
2006), although the δ13CDIC is generally becoming more positive (Fig. 6). This could be
explained by higher metabolic rates just after spawning, as energy lost during spawning is restored. Vander Putten et al. (2000) also described these patterns in δ13CS in M. edulis from the
Scheldt as being a result of increased respiration associated with periods of higher food availability.
260
270
280
Shell carbon isotopic signature
There are several hypotheses that try to explain disequilibrium isotopic fractionation (or vital effects) in biological carbonates. The two leading hypothesis are the “kinetic” model
(McConnaughey, 1989a, b) and the “carbonate” model (Adkins et al., 2003), which each lead to disequilibrium of both δ13C and δ18O (reviewed in Shanahan et al., 2005). As bivalves are known to precipitate in oxygen isotopic equilibrium (Epstein et al., 1953; Chauvaud et al., 2005), these effects do not seem to be acting on bivalve carbonates.
290
300
310
320
In order to compare the δ13CDIC with shell δ13C, the shell data must be assigned calendar dates.
Typically, the δ18O signal in the shell can be used to date the samples, based on the marked winter-summer temperature contrast (e.g., Klein et al, 1996; Gillikin et al., 2005a); however, this was difficult with these samples due to the large salinity influence (more precisely, the δ18O of the water) on the δ18O signal in shells from upstream sites (data presented in Gillikin et al., 2006). The δ18O signal from the KN shells had a clear periodicity indicating that a full year was sampled. Shells from HF and GR were stained with calcein (Oct 01; see Gillikin et al., 2006) and cover a full year, but growth seems reduced. Shells from OS were each sampled along 2 cm of growth (~15-35 mm from umbo), so should be at least one year of growth. Therefore, the average annual shell δ13C was compared with the average annual δ13CDIC at each site (Fig. 8).
Despite the variability in tissue δ13C throughout the year, the mean shell values closely match equilibrium values (δ13CDIC + 1‰; Romanek et al., 1992) for three of the four sites (Fig. 8). The
differences between measured and predicted values vary between sites (Table 1), with salinity apparently having little to do with disequilibrium as would be expected if the enzyme CA was responsible for changing the δ13C value of the internal DIC pool (see Introduction).
Nevertheless, all shells generally fall within the 10 % metabolic C incorporation suggested to be typical for aquatic marine invertebrates by McConnaughey et al. (1997) (Table 1).
Although δ13CR does not seem to largely affect the δ13CS (~< 10 % incorporation of metabolic
CO2 into the shell), the variability in the percent incorporated is enough to preclude its use as a
robust δ13CDIC proxy, and hence a salinity proxy. For example, if the δ13CS values of the
seaward KN shells were used to predict δ13CDIC and salinity, one would conclude that this shell
came from a site similar to HF (Fig. 8), even though the difference in salinity between these sites is typically around five. From Figure 8, it may seem that mussel shells from the same environment could be used to determine δ13CDIC, but another study has shown that Mercenaria
mercenaria shells collected from similar environments had very different metabolic
contributions to their shells (Gillikin, 2005), suggesting this might not generally be the case. The reason why the KN shells were farther from equilibrium than the others could be linked to
higher metabolic rates caused by the stronger wave action at this site, which increases water flow and thus food availability. Moderate wave action has been shown to increase growth rates and condition values in Mytilus (Steffani and Branch, 2003), which would lead to higher metabolic rates. There are also other possibilities which can increase metabolic rate, such as epibiont cover (e.g., barnacles (Buschbaum and Saier, 2001) which are more abundant at the KN site), exposure to predators (Frandsen and Dolmer, 2002), and pollution (Wang et al., 2005).
330
340
350
An alternative explanation for the higher metabolic C incorporation in shells at the KN site may be the differences in the ambient CO2/O2 ratios. McConnaughey et al. (1997) describe a simple
respiratory gas exchange model, where the inward flux of environmental CO2 dilutes the CO2
produced internally by respiration (see also Shanahan et al., 2005). In this model, the ambient CO2/O2 ratios and blood O2/ambient O2 ratios control the amount of respired CO2 in the tissues
and precipitating carbonates of the bivalve. With higher ambient CO2/O2 ratios there is more
flushing of CO2 produced internally by respiration. The Scheldt estuary is known to have
particularly high pCO2 values (Frankignoulle et al. 1998). The pCO2 and pO2 data collected in
the Scheldt estuary in July 2000 by Frankignoulle and Borges (2002) indeed show that the upstream sites have higher ambient CO2/O2 ratios (ranging from 0.11 at HF to 0.22 at OS) as
compared to a site with salinity similar to the KN site (~0.06). However, if this were the main factor controlling the amount of metabolic C incorporation into the shells, then a steady increase would be expected from low salinity (OS) to high salinity (KN), which was not observed in our data (Table 1).
The difference between the results presented here and those from earlier studies for the same species and estuary (i.e., Mook and Vogel, 1968; Mook, 1971), who state that δ13CS is a good
proxy of δ13CDIC, can be explained by three main considerations. First, these earlier authors
analysed mixtures of aragonite and calcite from the shells, which differ greatly in equilibrium δ13C values with HCO3- (i.e., +1 ‰ for calcite and + 2.7 ‰ for aragonite; Romanek et al.,
1992). Second, they roasted their samples and found significant differences between roasted and non-roasted δ-values, while Vander Putten et al. (2000) found no difference in calcite due to roasting samples from this same species, indicating a possible isotopic alteration in these earlier studies. Finally, these earlier studies did not consider metabolic effects, and perhaps did not sample populations with markedly different metabolic rates.
In conclusion, although δ13CR values can closely follow δ13CDIC values, and although the
percentage of metabolic C incorporated into the shells of M. edulis is low, the variability in metabolic C incorporation is too high to allow confident δ13CDIC and salinity determinations
based on δ13CS. The data presented here could not be used to differentiate between sites with a
salinity difference of five, which in terms of δ18O paleothermometry would correspond to about 4 ºC at these sites (Gillikin, 2005). Thus, δ13CS is not a robust proxy of environmental
conditions in M. edulis calcite, but may be useful for assessing metabolic differences between different populations, and can nevertheless be used as an indicator of large δ13CDIC (and salinity)
differences. It remains possible that samples from within the estuary proper, or samples from the same site, may have similar metabolic contributions to the shell δ13C and therefore could provide a better indication of changes in δ13CDIC through time; however, more samples from the
same site are needed to test this hypothesis. 360
370
Acknowledgements
We are much indebted to V. Mubiana for assistance with mussel collection and setting up the field experiment. A. Van de Maele and M. Korntheuer both assisted with keeping the Kiel III operational. Constructive criticism, which greatly improved this manuscript, was given by T. McConnaughey, M.D. Delafontaine, M.E. Böttcher (guest editor), and A. Verheyden. S.B. is funded by a postdoctoral mandate of the FWO-Flanders. Funding was provided by the Belgian Federal Science Policy Office, Brussels, Belgium (CALMARS, contract: EV/03/04B) and the ESF Paleosalt project funded by the FWO-Flanders (contract: G.0642.05).
380
390
References
Abelson, P.H., Hoering, T.C., 1961. Carbon isotope fractionation in the formation of amino acids by photosynthetic organisms. Proceedings of the National Academy of Sciences 47, 623-632.
Adkins, J.F., Boyle, E.A., Curry, W.B., Lutringer, A., 2003. Stable isotopes in deep-sea corals and a new mechanism for "vital effects". Geochimica et Cosmochimica Acta 67, 1129-1143.
Arthur, M.A., Williams, D.F., Jones, D.S., 1983. Seasonal temperature-salinity changes and thermocline development in the Mid-Atlantic Bight as recorded by the isotopic composition of bivalves. Geology 11, 655–659.
Baeyens, W., van Eck, B., Lambert, C., Wollast, R., Goeyens, L., 1998. General description of the Scheldt estuary. Hydrobiologia 366, 1-14.
Boschker, H.T.S., Kromkamp, J.C., Middelburg, J.J., 2005. Biomarker and carbon isotopic constraints on bacterial and algal community structure and functioning in a turbid, tidal estuary. Limnology and Oceanography 50, 70–80.
Bouillon, S., Frankignoulle, M., Dehairs, F., Velimirov, B., Eiler, A., Abril, G., Etcheber, H., Borges, A.V., 2003. Inorganic and organic carbon biogeochemistry in the Gautami Godavari estuary (Andhra
Pradesh, India) during pre-monsoon: The local impact of extensive mangrove forests. Global Biogeochemical Cycles 17, 1114, doi: 10.1029/2002GB002026.
400 410 420 430 440 450
Bouillon, S., Koedam, N., Baeyens, W., Satyanarayana, B., Dehairs, F., 2004. Selectivity of subtidal benthic invertebrate communities for local microalgal production in an estuarine mangrove ecosystem during the post-monsoon period. Journal of Sea Research 51, 133-144.
Buschbaum, C., Saier, B., 2001. Growth of the mussel Mytilus edulis L. in the Wadden Sea affected by tidal emergence and barnacle epibionts. Journal of Sea Research 45, 27-36.
Cai, D.L., Tan, F.C., Edmond, J.M., 1988. Sources and transport of particulate organic carbon in the Amazon River and estuary. Estuarine, Coastal and Shelf Science 26, 1-14.
Chauvaud, L., Lorrain, A., Dunbar, R.B., Paulet, Y.-M., Thouzeau, G., Jean, F., Guarini, J.-M., Mucciarone, D., 2005. The shell of the Great Scallop Pecten maximus as a high frequency archive of paleoenvironmental change. Geochemistry, Geophysics, Geosystems 6, Q08001, doi:10.1029/2004GC000890.
Crenshaw, M.A., 1972. Inorganic composition of molluscan extrapallial fluid. Biological Bulletin 143, 506-512.
de Zwaan, A., Mathieu, M., 1992. Cellular biochemistry and endochrinology. In: Gosling, E. (Ed.), The mussel Mytilus: Ecology, Physiology, Genetics and Culture. Developments in Aquaculture and Fisheries Science. Vol. 25, Elsevier, pp. 223-307.
DeNiro, M., Epstein, S., 1978. Influence of diet on the distribution of carbon isotopes in animals. Geochimica et Cosmochimica Acta 42, 495-506.
Dettman, D.L., Flessa, K.W., Roopnarine, P.D., Schöne, B.R., Goodwin, D.H., 2004. The use of oxygen isotope variation in shells of estuarine mollusks as a quantitative record of seasonal and annual Colorado River discharge. Geochimica et Cosmochimica Acta 68, 1253-1263.
Dillaman, R.M., Ford, S.E., 1982. Measurement of calcium-carbonate deposition in mollusks by controlled etching of radioactively labeled shells. Marine Biology 66, 133-143.
Epstein, S., Buchsbaum, R., Lowenstam, H.A., Urey, H.C., 1953. Revised carbonate - water isotopic temperature scale. Bulletin of the Geological Society of America 64, 1315-1326.
Focken, U., Becker, K., 1998. Metabolic fractionation of stable carbon isotopes: implications of different proximate compositions for studies of the aquatic food webs using δ13C data. Oecologia 115,
337-343.
Frandsen, R.P., Dolmer, P., 2002. Effects of substrate type on growth and mortality of blue mussels (Mytilus edulis) exposed to the predator Carcinus maenas. Marine Biology 141, 253-262.
Frankignoulle, M., Abril, G., Borges, A.V., Bourge, I., Canon, C., Delille, B., Libert, E. Théate, J.-M., 1998. Carbon dioxide emission from European estuaries. Science 282, 434-436.
Frankignoulle, M., Borges, A.V., 2001. Direct and indirect pCO2 measurements in a wide range of pCO2
and salinity values (the Scheldt estuary). Aquatic Geochemistry 7, 267-273.
Fry, B., 2002. Conservative mixing of stable isotopes across estuarine salinity gradients: A conceptual framework for monitoring watershed influences on downstream fisheries production. Estuaries 25, 264-271.
Fry, B., Sherr, E.B., 1984. 13C measurements as indicators of carbon flow in marine and freshwater ecosystems. Contribution to Marine Science 27, 13– 47.
Furla, P., Galgani, I., Durand, I., Allemand, D., 2000. Sources and mechanisms of inorganic carbon transport for coral calcification and photosynthesis. Journal of Experimental Biology 203, 3445– 3457.
Gieskes, W.W.C., Kraay, G.W., Nontji, A., Setiapennana, D., Sutomo, 1988. Monsoonal alternation of a mixed and layered structure in the phytoplankton of the euphotic zone of the Banda Sea (Indonesia), a mathematical analysis of algal pigment fingerprints. Netherlands Journal of Sea Research 22, 123-137.
Gillikin, D.P., 2005. Geochemistry of Marine Bivalve Shells: the potential for paleoenvironmental reconstruction. Ph.D. thesis. Vrije Universiteit Brussel, Belgium, 258 p.
Gillikin, D.P., De Ridder, F., Ulens, H., Elskens, M., Keppens, E., Baeyens, W., Dehairs, F., 2005a. Assessing the reproducibility and reliability of estuarine bivalve shells (Saxidomus giganteus) for sea surface temperature reconstruction: implications for paleoclimate studies. Palaeogeography
Gillikin, D.P., Dehairs, F., Lorrain, A., Steenmans, D., Baeyens, W., André, L., 2006. Barium uptake into the shells of the common mussel (Mytilus edulis) and the potential for estuarine paleo-chemistry reconstruction. Geochemica et Cosmochimica Acta 70: 395-407.
Gillikin, D.P., Lorrain, A., Navez, J., Taylor, J.W., André, L., Keppens, E., Baeyens, W., Dehairs, F., 2005. Strong biological controls on Sr/Ca ratios in aragonitic marine bivalve shells. Geochemistry, Geophysics, Geosystems 6, Q05009, doi:10.1029/2004GC000874.
Hellings, L., Dehairs, F., Tackx, M., Keppens, E., Baeyens, W., 1999. Origin and fate of organic carbon in the freshwater part of the Scheldt Estuary as traced by stable carbon isotopic composition.
Biogeochemistry 47, 167-186. 460 470 480 490 500
Hellings, L., Dehairs, F., Van Damme, S., Baeyens, W., 2001. Dissolved inorganic carbon in a highly polluted estuary (the Scheldt). Limnology and Oceanography 46, 1406-1414.
Henry, R.P., Saintsing, D.G., 1983. Carbonic-anhydrase activity and ion regulation in 3 species of osmoregulating bivalve mollusks. Physiological Zoology 56, 274-280.
Herman, P.M.J., Middelburg, J.J., Widdows, J., Lucas, C.H., Heip, C.H.R., 2000. Stable isotopes as trophic tracers: combining field sampling and manipulative labeling of food resources for macrobenthos. Marine Ecology Progress Series 204, 79-92.
Hinga, K.R., Arthur, M.A., Pilson, M.E.Q., Whitaker, D., 1994. Carbon isotope fractionation by marine phytoplankton in culture: the effects of CO2 concentration, pH, temperature, and species. Global
Biogeochemical Cycles 8, 91-102.
Hummel, H., Fortuin, A.W., Bogaards, R.H., Wolf, L., de Meijboom, A., 1989. Changes in Mytilus edulis in relation to short-term disturbances of the tide. In: Klekowski, R., Styczynska-Jurewicz, E., Falkowski, L. (Eds.), Proc. 21st European Marine Biological Symposium, Warsaw, Ossolineum, pp. 77– 89.
Kaandorp, R.J.G., Vonhof, H.B., Del Busto, C., Wesselingh, F.P., Ganssen, G.M., Marmol, A.E., Pittman, L.R., van Hinte, J.E., 2003. Seasonal stable isotope variations of the modern Amazonian freshwater bivalve Anodontites trapesialis. Palaeogeography Palaeoclimatology Palaeoecology 194, 339-354.
Kennedy, H., Richardson, C.A., Duarte, C.M., Kennedy, D.P., 2001. Oxygen and carbon stable isotopic profiles of the fan mussel, Pinna nobilis, and reconstruction of sea surface temperatures in the Mediterranean. Marine Biology 139, 1115-1124.
Killingley, J.S., Berger, W.H., 1979. Stable isotopes in a mollusc shell: Detection of upwelling events. Science 205, 186-188.
Klein, R.T., Lohmann, K.C., Thayer, C.W., 1996. Bivalve skeletons record sea-surface temperature and δ18O via Mg/Ca and 18O/16O ratios. Geology 2,: 415-418.
Lehane, C., Davenport J., 2002. Ingestion of mesozooplankton by three species of bivalve; Mytilus edulis, Cerastoderma edule and Aequipecten opercularis. Journal of the Marine Biological Association of the United Kingdom 82, 615-619.
Lehane, C., Davenport, J., 2004. Ingestion of bivalve larvae by Mytilus edulis: experimental and field demonstrations of larviphagy in farmed blue mussels. Marine Biology 145, 101-107.
Levinton, J.S., Ward, J.E., Shumway, S.E., 2002. Feeding responses of the bivalves Crassostrea gigas and Mytilus trossulus to chemical composition of fresh and aged kelp detritus. Marine Biology 141, 367-376.
Lorrain, A., Gillikin, D.P., Paulet, Y.-M., Chauvaud, L., Le Mercier, A., Navez, J., André, L., 2005. Strong kinetic effects on Sr/Ca ratios in the calcitic bivalve Pecten maximus. Geology 33, 965-968. Lorrain, A., Paulet, Y.-M., Chauvaud, L., Dunbar, R., Mucciarone, D., Fontugne, M., 2004. δ13C
variation in scallop shells: Increasing metabolic carbon contribution with body size? Geochimica et Cosmochimica Acta 68, 3509-3519.
Lorrain, A., Paulet, Y.-M., Chauvaud, L., Savoye, N., Donval, A., Saout, C., 2002. Differential delta C-13 and delta N-15 signatures among scallop tissues: implications for ecology and physiology. Journal of Experimental Marine Biology and Ecology 275, 47-61.
Lorrain, A., Savoye, N., Chauvaud, L., Paulet, Y.-M., Naulet, N., 2003. Decarbonation and preservation method for the analysis of organic C and N contents and stable isotope ratios of low-carbonated suspended particulate material. Analytica Chimica Acta 491, 125-133.
McConnaughey, T.A., 1989a. 13C and 18O isotope disequilibria in biological carbonates. 1. Patterns.
McConnaughey, T.A., 1989b. 13C and 18O isotopic disequilibrium in biological carbonates: 2. In vitro simulation of kinetic isotope effects. Geochimica et Cosmochimica Acta 53, 163-171.
McConnaughey, T.A., Burdett, J., Whelan, J.F., Paull, C.K., 1997. Carbon isotopes in biological carbonates: respiration and photosynthesis. Geochimica et Cosmochimica Acta 61, 611-622. 510 520 530 540 550 560
McCutchan, J.H., Lewis, W.M., Kendall, C., McGrath, C.C., 2003. Variation in trophic shift for stable isotope ratios of carbon, nitrogen, and sulfur. Oikos 102, 378-390.
Middelburg, J.J., Barranguet, C., Boschker, H.T.S., Herman, P.M.J., Moens, T., Heip, C.H.R., 2000. The fate of intertidal microphytobenthos carbon: An in situ C-13-labeling study. Limnology and
Oceanography 45, 1224-1234.
Middelburg, J.J., Nieuwenhuize, J., 1998. Carbon and nitrogen stable isotopes in suspended matter and sediments from the Schelde Estuary. Marine Chemistry 60, 217-225.
Miyajima, T., Yamada, Y., Hanba, Y.T., Yoshii, K., Koitabashi, T., Wada, E., 1995. Determining the stable-isotope ratio of total dissolved inorganic carbon in lake water by GC/C/IRMS. Limnology and Oceanography 40, 994-1000.
Mook, W.G., 1971. Paleotemperatures and chlorinities from stable carbon and oxygen isotopes in shell carbonate. Palaeogeography Palaeoclimatology Palaeoecology 9, 245-263.
Mook, W.G., Tan, F.C., 1991. Stable carbon isotopes in rivers and estuaries. In: Degens, E.T., Kempe, S., Richey, J.E. (Eds.), Biogeochemistry of Major World Rivers. John Wiley and Sons Ltd, pp. 245-264.
Mook, W.G., Vogel, J.C., 1968. Isotopic equilibrium between shells and their environment. Science 159, 874-875.
Morton, B., 1992. The evolution and success of the heteromyarian form in the Mytiloida. In: Gosling, E., (Ed.), The mussel Mytilus: Ecology, Physiology, Genetics and Culture. Developments in Aquaculture and Fisheries Science. Vol. 25, Elsevier, pp. 21-52
Newell, R.I.E., 1989. Species profiles: life histories and environmental requirements of coastal fishes and invertebrates (North - Mid-Atlantic). Blue Mussel. U.S. Fisheries & Wildlife Service, Biological Report 82(11.102). U.S. Army Corps of Engineers, TR EL-82-4, pp. 25. Available at:
http://www.nwrc.usgs.gov/wdb/pub/0169.pdf
Paneth, P., O’Leary, M.H., 1985. Carbon isotope effect on dehydration of bicarbonate ion catalyzed by carbonic-anhydrase. Biochemistry 24, 5143-5147.
Pocker, Y., Tanaka, N., 1978. Inhibition of carbonic-anhydrase by anions in carbon dioxide- bicarbonate system. Science 199, 907-909.
Post, D.M., 2002. Using stable isotopes to estimate trophic position: models, methods, and assumptions. Ecology 83, 703-718.
Rau, G.H., Takahashi, T., Des Marais, D.J., Repeta, K.J., Martin, J.H., 1992. The relationship between δ13C of organic matter and [CO2(aq)] in ocean surface water: data from a JGOFS site in the northeast
Atlantic Ocean and a model. Geochimica et Cosmochimica Acta 56, 1413-1419.
Roditi, H.A., Fisher, N.S., Sanudo-Wilhelmy, S.A., 2000. Uptake of dissolved organic carbon and trace elements by zebra mussels. Nature 407, 78-80.
Romanek, C.S., Grossman, E.L., Morse, J.W., 1992. Carbon isotopic fractionation in synthetic aragonite and calcite: Effects of temperature and precipitation rate. Geochimica et Cosmochimica Acta 56, 419-430.
Savoye, N., Aminot, A., Treguer, P., Fontugne, M., Naulet, N., Kerouel, R., 2003. Dynamics of particulate organic matter δ15N and δ13C during spring phytoplankton blooms in a macrotidal
ecosystem (Bay of Seine, France). Marine Ecology-Progress Series 255, 27-41.
Shanahan, T.M., Pigati, J.S., Dettman, D.L., Quade, J., 2005. Isotopic variability in the aragonite shells of freshwater gastropods living in springs with nearly constant temperature and isotopic
composition. Geochimica et Cosmochimica Acta 69, 3949-3966.
Stecher, H.A., Krantz, D.E., Lord, C.J., Luther, G.W., Bock, K.W., 1996. Profiles of strontium and barium in Mercenaria mercenaria and Spisula solidissima shells. Geochimica et Cosmochimica Acta 60, 3445-3456.
Steffani, C.N., Branch, G.M., 2003. Growth rate, condition, and shell shape of Mytilus galloprovincialis: responses to wave exposure. Marine Ecology-Progress Series 246, 197-209.
Swart, P.K., 1983. Carbon and oxygen isotope fractionation in Scleractinian corals: A review. Earth-Science Reviews 19, 51-80.
Swart, P.K., Szmant, A., Porter, J.W., Dodge, R.E., Tougas, J.I., Southam, J.R., 2005. The isotopic composition of respired carbon dioxide in scleractinian corals: Implications for cycling of organic carbon in corals. Geochimica et Cosmochimica Acta 69, 1495-1509.
Tanaka, N., Monaghan, M.C., Rye, D.M., 1986. Contribution of metabolic carbon to mollusk and barnacle shell carbonate. Nature 320, 520-523.
Tieszen, L.L., Boutton, T.W., Tesdahl, K.G., Slade, N.A., 1983. Fractionation and turn-over of stable carbon isotopes in animal tissues: implications for δ13C analysis of diet. Oecologia 57, 32-37.
Vander Putten, E., Dehairs, F., Keppens, E., Baeyens, W., 2000. High resolution distribution of trace elements in the calcite shell layer of modern Mytilus edulis: Environmental and biological controls. Geochimica et Cosmochimica Acta 64, 997-1011.
570
580
Verheyden, A., Helle, G., Schleser, G.H., Dehairs, F., Beeckman, H., Koedam, N., 2004. Annual cyclicity in high-resolution stable carbon and oxygen isotope ratios in the wood of the mangrove tree Rhizophora mucronata. Plant, Cell and Environment 27, 1525-1536.
Wang, S., Hong, H., Wang, X., 2005. Bioenergetic responses in green lipped mussels (Perna viridis) as indicators of pollution stress in Xiamen coastal waters, China. Marine Pollution Bulletin 51, 738-743. Ward, J.E., Shumway, S.E., 2004. Separating the grain from the chaff: particle selection in suspension-
and deposit-feeding bivalves. Journal of Experimental Marine Biology and Ecology 300, 83-130. Wong, W.H., Levinton, J.S., Twining, B.S., Fisher, N.S., Kelaher, B.P., Alt, A.K., 2003. Assimilation of
carbon from a rotifer by the mussels Mytilus edulis and Perna viridis: a potential food-web link. Marine Ecology-Progress Series 253, 175-182.
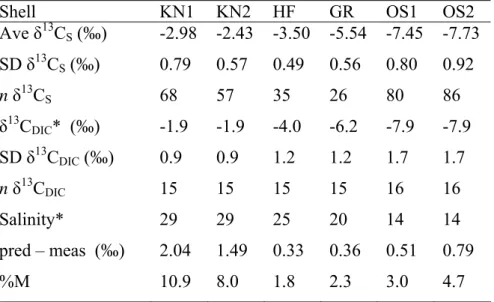
Table 1. Average shell and water δ13C data, predicted minus
measured δ13CS (pred – meas, in ‰) and percent metabolic C
incorporation (%M) in M. edulis shells at each site. %M was calculated using average data and the equation of McConnaughey et al. (1997, see text).
590
Shell KN1 KN2 HF GR OS1 OS2
Ave δ13CS(‰) -2.98 -2.43 -3.50 -5.54 -7.45 -7.73 SD δ13CS(‰) 0.79 0.57 0.49 0.56 0.80 0.92 n δ13CS 68 57 35 26 80 86 δ13CDIC* (‰) -1.9 -1.9 -4.0 -6.2 -7.9 -7.9 SD δ13CDIC(‰) 0.9 0.9 1.2 1.2 1.7 1.7 n δ13CDIC 15 15 15 15 16 16 Salinity* 29 29 25 20 14 14 pred – meas (‰) 2.04 1.49 0.33 0.36 0.51 0.79 %M 10.9 8.0 1.8 2.3 3.0 4.7
Figure Captions
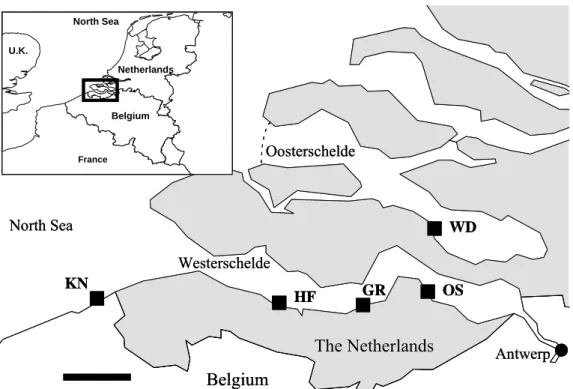
Figure 1. Map of the Westerschelde estuary (referred to as the Scheldt estuary in the text). The four study sites are indicated Knokke (KN), Hooftplaat (HF), Griete (GR) and Ossenisse (OS). Scale bar = 10 km. Wemmeldinge (WD) is also shown.
600
610
620
Figure 2. Water temperature recorded hourly using Onset TidBit dataloggers at all four sites. The weekly running average is shown. The loggers failed at GR and HF for about a month as is indicated on the graph.
Figure 3. Salinity at the four Schelde sites measured over one year (Nov. 2001 - Nov. 2002).
Figure 4. δ13CDIC versus salinity from samples taken over one year at the four sites along the Scheldt
estuary (r2 = 0.94, p < 0.0001).
Figure 5. Linear regressions between mantle tissue δ13C and both δ13CPOC (open symbols) and δ13CDIC– 20
(solid symbols) (in ‰) from mussels collected at all four sites in March 2002. n = 27 for each.
Figure 6. Temporal variations in mantle tissue δ13C, δ13CPOC, δ13CDIC–20 (in ‰), and chlorophyll a for
Hooftplaat (A) and Knokke (B) for the period November 2001 to November 2002. Error bars represent standard deviations.
Figure 7. High resolution δ13C shell data from the six shells plotted versus distance from the umbo (growth direction is from left to right). See figure 1 for site codes.
Figure 8. Mean δ13Cs and δ13CDIC (in ‰) averaged over the full year for the four sites (noted above data
points, see Fig. 1 for description of site codes). High-resolution profiles can be found in Gillikin et al. (2006). Also plotted are the expected shell values based on the fractionation factor between δ13C
DIC and calcite (+1.0 ‰; Romanek et al., 1992). Error bars represent
630
Figure 1. Map of the Westerschelde estuary (referred to as the Scheldt estuary in the text). The four study sites are indicated Knokke (KN), Hooftplaat (HF), Griete (GR) and Ossenisse (OS). Scale bar = 10 km. Wemmeldinge (WD) is also shown.
Antwerp Oosterschelde North Sea Westerschelde France Netherlands Belgium North Sea U.K. WD Belgium OS GR HF KN The Netherlands North Sea Antwerp Oosterschelde North Sea Westerschelde France Netherlands Belgium North Sea U.K. WD Belgium OS GR HF KN The Netherlands North Sea
0 5 10 15 20 25 O N D J F M A M J J A S O N D J F M A M J Date T emp er at u re ( ºC ) Logger failure
Figure 2. Water temperature recorded hourly using Onset TidBit dataloggers at all four sites. The weekly running average is shown from Oct. 2001 to May 2003. The loggers failed at GR and HF for about a month as is indicated on the graph.
0
5
10
15
20
25
30
35
O
N
D
J
F
M
A M
J
J
A
S
O
N
D
Month
S
a
lin
ity
KN
HF
GR
OS
Figure 3. Salinity at the four Schelde sites measured over one year (Nov. 2001 - Nov. 2002).-14
-12
-10
-8
-6
-4
-2
0
2
7
12
17
22
27
32
Salinity
δ
13C
DI C(‰)
Figure 4. δ13CDIC versus salinity from samples taken over one year at the four sites along the Scheldt
-28 -27 -26 -25 -24 -23 -22 -21 -20 -19 -18 -17 -32 -31 -30 -29 -28 -27 -26 -25 -24 -23 -22 -21 δ13
CPOC and δ13CDIC-20 (‰ )
Ti ssue δ 13 C ( ‰ ) DIC-20 POC
650 Figure 5. Linear regressions between mantle tissue δ13C and both δ13CPOC (open symbols) and δ13CDIC– 20
(solid symbols) (in ‰) from mussels collected at all four sites in March 2002. n = 27 for each.
-26 -25 -24 -23 -22 -21 -20 -19 -18 δ 13 C ( ‰ ) 0 5 10 15 20 25 30 35 40 Chl a ( μ g/ l) DIC -20 POC tissue Chl a -25 -24 -23 -22 -21 -20 -19 -18 N D J F M A M J J A S O N D δ 13 C ( ‰ ) 0 5 10 15 20 25 Chl a (μ g /l)
Figure 6. Temporal variations in mantle tissue δ13C, δ13CPOC, δ13CDIC–20 (in ‰), and chlorophyll a for
Hooftplaat (A) and Knokke (B) for the period November 2001 to November 2002. Error bars represent standard deviations.
-12 -10 -8 -6 -4 -2 0 10 15 20 25 30 35 40 45 50 KN1 KN2 HF GR OS1 OS2 δ 13 C ( ‰ ) mm from umbo 660
Figure 7. High resolution δ13C shell data from the six shells plotted versus distance from the umbo (growth direction is from left to right). See figure 1 for site codes.
-10 -9 -8 -7 -6 -5 -4 -3 -2 -1 0 -12 -10 -8 -6 -4 -2 0 δ13 CDIC (‰ ) δ 13 C sh el ls (‰ ) shells equilibrium shells measured OS GR HF KN
Figure 8. Mean δ13Cs and δ13CDIC (in ‰) averaged over the full year for the four sites (noted above data
points, see Fig. 1 for description of site codes). High-resolution profiles can be found in Gillikin et al. (2006). Also plotted are the expected shell values based on the fractionation factor between δ13C
DIC and
calcite (+1.0 ‰; Romanek et al., 1992). Error bars represent standard deviations. 670