HAL Id: hal-01605986
https://hal.archives-ouvertes.fr/hal-01605986
Submitted on 27 May 2021
HAL is a multi-disciplinary open access
archive for the deposit and dissemination of
sci-entific research documents, whether they are
pub-lished or not. The documents may come from
teaching and research institutions in France or
abroad, or from public or private research centers.
L’archive ouverte pluridisciplinaire HAL, est
destinée au dépôt et à la diffusion de documents
scientifiques de niveau recherche, publiés ou non,
émanant des établissements d’enseignement et de
recherche français ou étrangers, des laboratoires
publics ou privés.
Distributed under a Creative Commons Attribution| 4.0 International License
barcoding and integrative taxonomy
Perrine Cruaud, Jean Yves Rasplus, Lillian Rodriguez, Astrid Cruaud
To cite this version:
Perrine Cruaud, Jean Yves Rasplus, Lillian Rodriguez, Astrid Cruaud. High-throughput sequencing
of multiple amplicons for barcoding and integrative taxonomy. Scientific Reports, Nature Publishing
Group, 2017, 7, pp.41948. �10.1038/srep41948�. �hal-01605986�
High-throughput sequencing of
multiple amplicons for barcoding
and integrative taxonomy
Perrine Cruaud
1, Jean-Yves Rasplus
1, Lillian Jennifer Rodriguez
1,2& Astrid Cruaud
1 Until now, the potential of NGS for the construction of barcode libraries or integrative taxonomy has been seldom realised. Here, we amplified (two-step PCR) and simultaneously sequenced (MiSeq) multiple markers from hundreds of fig wasp specimens. We also developed a workflow for quality control of the data. Illumina and Sanger sequences accumulated in the past years were compared. Interestingly, primers and PCR conditions used for the Sanger approach did not require optimisation to construct the MiSeq library. After quality controls, 87% of the species (76% of the specimens) had a valid MiSeq sequence for each marker. Importantly, major clusters did not always correspond to the targeted loci. Nine specimens exhibited two divergent sequences (up to 10%). In 95% of the species, MiSeq and Sanger sequences obtained from the same sampling were similar. For the remaining 5%, species were paraphyletic or the sequences clustered into divergent groups on the Sanger + MiSeq trees (>7%). These problematic cases may represent coding NUMTS or heteroplasms. Our results illustrate that Illumina approaches are not artefact-free and confirm that Sanger databases can contain non-target genes. This highlights the importance of quality controls, working with taxonomists and using multiple markers for DNA-taxonomy or species diversity assessment.While next-generation sequencing (NGS) is commonly used to analyse bulk environmental samples (metabar-coding)1–3, Sanger sequencing remains the standard approach in generating DNA barcode libraries4. This is
unfortunate as the cost-effective acquisition of barcode sequences from hundreds of specimens identified to spe-cies by expert taxonomists could accelerate the construction of accurate reference libraries and increase their completeness2,5.
As it generates up to 25 million paired-end reads (2 * 300 bp), the Illumina MiSeq platform makes possible the sequencing of several hundreds of individuals on a set of informative barcodes. This allows for the increase not only in the number of species but also in the number of specimens included in reference databases, which is cru-cial, as a better coverage of the geographical range of the species and a better characterisation of the intraspecific variability lead to more accurate identification6,7.
Two-step polymerase chain reactions (PCR) are convenient methods to generate amplicon libraries for Illumina sequencing8–14. In the first PCR reaction the targeted DNA region is amplified using specific primers
flanked by tails (Fig. 1). These tails allow for a second PCR reaction to add Illumina adaptor sequences and indexes to multiplex samples11. Theoretically, two-step PCR approaches provide an opportunity to build on
exist-ing experience and tools (e.g. primers and PCR conditions), which make them very attractive.
Combining two-step PCR approaches and high-throughput sequencing may contribute to circum-vent some of the main pitfalls of barcoding revealed by many studies15. Indeed, heteroplasms16,17; NUMTS
(NUclearMiTochondrial DNA segments)18, endosymbionts19, parasitoids20 or contaminants may be sometimes
preferentially amplified by the primer pair used and are frequently sequenced using Sanger methods. Using NGS, these non-target loci may be simultaneously amplified with the targeted COI, sequenced within the sequencing depth and better identified by post sequencing analyses2. Furthermore, combining two-step PCR and MiSeq
sequencing may also help to increase the number of genes sequenced for barcoding. Indeed to circumvent the main pitfalls associated with the use of a single, mitochondrial gene, it has been acknowledged that an increase in the number of genes analysed is desired, though most studies still rely on COI only15. This increase is even more
recommended when it comes to DNA-based species delimitation21–23 or phylogeography. However, the addition 1INRA, UMR1062 CBGP, F-34988 Montferrier-sur-Lez, France. 2Institute of Biology, University of the Philippines
Diliman, Quezon City, Philippines. Correspondence and requests for materials should be addressed to A.C. (email: [email protected])
received: 21 July 2016 accepted: 03 January 2017 Published: 06 February 2017
OPEN
of loci often comes at the expense of sampling24. By combining multiplexing techniques with high-throughput
sequencing, researchers may no longer need to choose between more samples or more characters. Finally, adding one or a few nuclear genes aside the standard mitochondrial fragment (COI) may facilitate the identification of mtDNA introgression25.
Recently, genome skimming, the low-coverage shotgun sequencing of total genomic DNA26 has been
pro-posed as a next generation barcoding tool27. However, a switch to databases including the complete genome
sequence of each organism on Earth is still unrealistic due to unaffordable costs. Furthermore high consumable costs, increased demands on data storage, analytical issues, as well as potential difficulties in obtaining material transfer agreements27, challenge the implementation of this method. In any case, identification of random
scaf-folds is not possible with current databases. Thus, when genome skimming was used to capture the genomic diversity of bulk arthropod samples28, ca 70% of the recovered scaffolds could not be identified to species with
existing databases. Therefore, there should be a gradual and step-wise implementation of genome skimming. In this light, taking advantage of current databases seems more realistic, especially to make use of the huge effort undertaken over the past 15 years in compiling millions of COI sequences for hundreds of thousands spe-cies (e.g. the International Barcode of Life project iBOL). Finally, in many groups of living organisms, COI or a couple of genetic markers provide an accurate identification, even if problems do exist in some groups29–31.
Here, we want to go a step further than Shokralla et al.2,4, who were the first to show the potential of NGS
technology in generating COI barcode sequences from over a thousand of arthropod specimens from multiple taxa. We propose to test the feasibility and reliability of high-throughput sequencing of multiple amplicons for barcoding and integrative taxonomy.
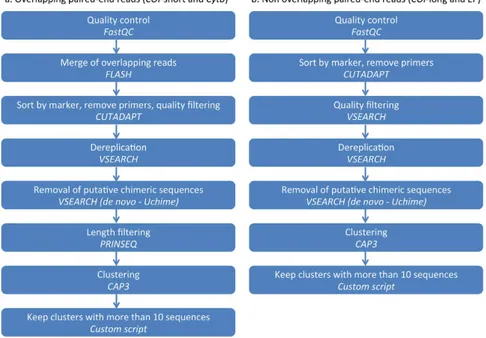
To do so, we focused on a group of chalcid wasps (Hymenoptera, Agaonidae, Ceratosolen) for which we have accumulated Sanger sequences on two mitochondrial [COI and cytochrome b (Cytb)], and one nuclear markers [elongation factor-1a (EF1a)], over the past 20 years and on which we have a strong taxonomic expertise that is essential to detect mismatches between morphological and molecular identification. Using a two-step PCR approach (Fig. 1) and Illumina MiSeq sequencing, we amplified and sequenced the same three markers (Table 1) on 115 species of Ceratosolen (369 specimens). We processed raw data using a custom workflow including quality control steps (Figs 2 and 3) and compared our results to the Sanger data set.
The first objective of this study was to test the feasibility of a two-step PCR approach on our target group and using our usual primers. Then, we wanted to determine the best strategy to analyse MiSeq raw data from multiple amplicons for reference database construction, DNA-based identification and integrative taxonomy. Indeed, with the thousands of sequences per sample produced by the MiSeq platform, sequence correction is not a burden anymore, but other issues may appear that need to be considered. On the one hand, thank to sequencing depth, chances of actually getting sequences of the target locus are higher compared to Sanger sequencing. On the other hand, non-target loci (i.e. pseudogenes, heteroplasmic sequences) are also sequenced and target DNA region must be sorted out from the rest of the sequences. More specifically, one may wonder whether the cluster that contains the largest proportion of reads always corresponds to the targeted loci. Two studies suggested it might be so in most cases2,4, but other analyses are required. Finally, at some point, Sanger and Illumina sequences will
both be used in reference databases, for integrative taxonomy, or for DNA-based identification of specimens. Consequently, identifying potential issues during data reconciliation was the third objective of this study.
Results
MiSeq library construction and sequencing.
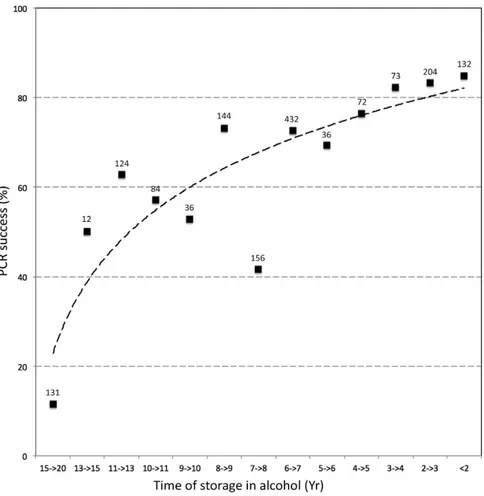
Amplification success for each gene region (bands on the gel at the expected size after the first PCR step) is summarized in Tables 2 and 3. The success of PCR was higher for the mitochondrial genes. A PCR amplification product was observed for 80.9% of the species for COI-long, 86.1% for COI-short, 85.2% for Cytb, and 77.4% for EF. As might be expected, we found a negative correla-tion between amplificacorrela-tion success and time elapsed since specimen colleccorrela-tion (Fig. 4). Interestingly, the overall amplification success between Sanger and MiSeq data sets were similar, though longer primers were used in the two-step PCR approach. DNA extraction seemed to have failed for 47 specimens (no PCR amplification product visible on gel, DNA concentrations below the detection limit of ethidium bromide). Analyses of the per-sequence quality scores showed that the sequencing quality of respectively 40,1% and 25.9% of the forward and reverse reads reached Q30. We observed increased error rates towards the end of the reads (especially reverse reads). As a consequence, the paired reads did not overlap for EF, though the sequenced product (563 bp) fall into the range of the MiSeq Reagent Kits v3. A total of 18,688,278 Illumina paired-end reads were obtained with an average number of raw reads per sample of 38,913 (range = 673–158,278).Quality control of clusters of reads.
The number of clusters of reads varied among samples and genes (Tables 2 and 3). More clusters were obtained when paired-end reads did not overlap, probably because of the increased error rates towards the end of the reads. After completion of our workflow (Figs 2 and 3; Table 4), about 76% of the specimens had a sequence for the three-targeted genes and at least one sequence was retained for 94.8% (COI), 82.6% (Cytb) and 84.3% (EF) of the species. Sequencing what appeared as negative PCR ampli-fications on agarose gel allowed saving up to 11 species for EF, 9 for COI and 3 for Cytb. On the other hand, noGene region COI Cytb EF
Primer pair LCO1490puc-HCO2198puc UEA3-HCO2198 CB1-CB2 F2-557F-F2-1118R “COI-long” “COI-short”
Primer position
Amplicon size (nt) 658 409 433 518
MiSeq sequenced product (nt)* 709 460 485 563
Read overlap? no yes yes no
Table 1. DNA regions targeted for amplification. (*Sequenced product = forward primer + amplicon + reverse
primer).
sequence were obtained for about 6.6% (Cytb), 5.1% (COI) and 3.7% (EF) of the samples for which an amplicon was visible on the gel (Table 4).
Translation to amino acids showed that 57.2% (COI-long, forward reads), 8.9% (COI-long, reverse reads), 76.3% (COI-short), 93.9% (Cytb), 89.0% (EF, forward reads), 15.5% (EF, reverse reads) of the major clusters obtained from positive PCR were coding (Tables 2 and 3). Among clusters obtained from positive PCR and that passed the translation step, 100% of the COI-short, Cytb, EF clusters as well as 89.7% (COI-long, forward reads) and 84.6% (COI-long, reverse reads) clusters blasted with Agaonidae sequences on NCBI. Non-homolog sequences mostly belong to symbionts (Wolbachia) or parasites (nematodes). Finally, among clusters obtained from positive PCR products and that passed the translation step, an average of 2.6% only had a consensus sequence identical to another species of Ceratosolen and might represent contamination or conversion of indexes. Therefore, the cluster that contained the largest proportion of reads did not necessarily represent a valid sequence.
After completion of the workflow, only 15 COI sequences (7 species) presented internal gaps after the merging of COI-long and COI-short sequences. Sanger sequences were available in all cases. The position of these sequences in the tree topology was correct (Fig. S1). A few specimens (2.4%) were represented by two consensus sequences in the final MiSeq data set: one specimen for COI, for which sequences of COI-long and
COI-short were different (JRAS03502_0153, Fig. S1) and eight specimens for Cytb, for which the major and
the second major clusters had different consensus sequences (JRAS02196_0155, 56; JRAS01683_0151, 55, 56; JRAS02370_0151, 55, 56; Fig. S2). Phylogenetic inference revealed that one of the copies was (almost) identical to Sanger sequences while the other clustered apart with an average pairwise sequence divergence ranging from 7.3% to 10.3% (Figs 4, S1, S2, S4, Table 4). These cases are problematic as no objective criteria allow the removal of one of the sequences from the final data set. Lastly, when combining Sanger and MiSeq datasets, 9 species formed paraphyletic assemblages or clustered into two divergent (> 7%) groups of sequences: 3 on the COI tree (Fig. S1), 4 on the Cytb tree (Fig. 5, S2), 2 on both COI and Cytb trees, Table 4). Although two copies of EF have been reported in Hymenoptera32, no problematic case was detected on the tree obtained from the analysis of the
EF data set (Fig. S3, Table 4).
Discussion
In this study, we illustrate that a two-step PCR approach followed by Illumina sequencing can be used for integra-tive taxonomy or for increasing the number of animal or plant species and specimens in barcode databases. When nuclear genes are included in the set of target markers, this method can allow accurate identification of specimens within species complexes where mitochondrial markers may be misleading (because of intrinsic problems such as introgression6,7). Interestingly, primers and PCR conditions used to generate Sanger data sets did not need
opti-misation to be used for MiSeq library preparation. Moreover, this approach does not require costly investments in laboratory equipment and supplies. Provided that adapters/index and primers are compatible (e.g. no hairpin structure), researchers can keep on working with markers they have previously selected for informativeness33 to
resolve shallower phylogenetic relationships within their target group.
Increased error rates towards the end of the reads (especially reverse reads) have made the bioinformatic pro-cessing of data less convenient with a necessary switch to algorithms that allow clustering of sequences with dif-ferent length. Nevertheless, processing remains feasible and fast with available programs (48 hours were required on 8-cores of a 16-cores Linux, 2.9 GHz, 64GB RAM computer to process raw data). This increase in error rate could be due to technical problems of the Illumina MiSeq sequencing technology with accumulation of phasing and pre-phasing events throughout the sequencing process. Indeed, during sequencing, reads extend by one base per cycle. At each cycle, some reads may become out of phase. For example, when the 3′ terminators are not com-pletely removed, reads may fall a base behind (phasing). When the synthesis is too fast (e.g. inadequate flushing of the flow cell) reads may run a base ahead (pre-phasing). The number of phased or pre-phased reads increases with sequencing, which generate noise and can result in higher error rates towards the end of the reads34. However,
progress is being made and work associated with resolving this issue is continuing. It would thus be reasonable to think that in the next couple of years read length will increase and amplicons of longer size could be sequenced.
The impact of missing data on phylogenetic inference is also widely discussed, but it is often more a question of a taxa having too few informative characters rather than too many missing data35. In our case, when sequences
had internal gaps due to non-overlapping reads 1 and 2, the number of informative characters was sufficient (the placement of sequences with gaps was always correct). The use of mini-barcodes has been shown to be powerful enough to characterize metazoan diversity36,37. However, to increase identification success, having only complete
COI sequences in reference databases seems more appropriate. In that sense, until read length is sufficient enough
to allow sequencing of fragments over 600 bp, using two overlapping fragments such as the FC and BR fragments developed by Shokralla et al.2 (large spectrum of taxa), our COI-long/COI-short fragments (for fig wasps), or
overlapping fragments that are easier to amplify in the target group, would be more appropriate for the construc-tion of reference databases.
Our results suggest that it may be helpful to sequence PCR products with no visible bands on the gel (poten-tially negative PCR). Indeed, we obtained sequences that passed our quality control steps for 86 specimens for which no amplification product was detected on the gel. When using Sanger method, sequencing what seemed to be negative PCR products was discouraged because of sequencing cost. This aspect now becomes afforda-ble with NGS methods. From a practical point of view, pooling positive and negative PCR products can lead to low concentration of the library (< 2 nM before denaturation, which is the minimum concentration recom-mended by the Illumina protocol). Here we obtained 0.24 nM but used Tris-HCL to neutralize the increased
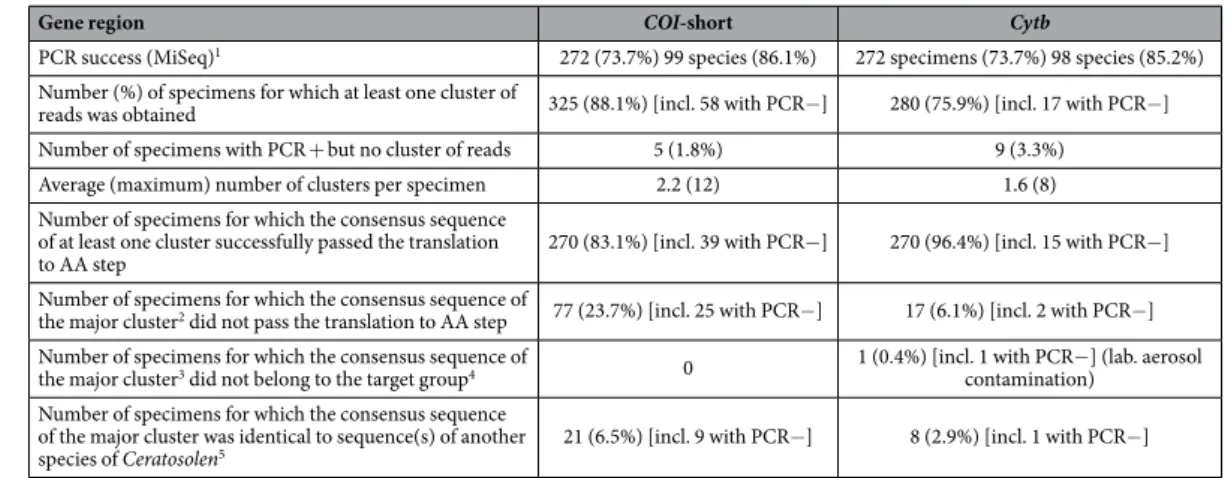
Gene region COI-short Cytb
PCR success (MiSeq)1 272 (73.7%) 99 species (86.1%) 272 specimens (73.7%) 98 species (85.2%)
Number (%) of specimens for which at least one cluster of
reads was obtained 325 (88.1%) [incl. 58 with PCR−] 280 (75.9%) [incl. 17 with PCR−] Number of specimens with PCR + but no cluster of reads 5 (1.8%) 9 (3.3%)
Average (maximum) number of clusters per specimen 2.2 (12) 1.6 (8) Number of specimens for which the consensus sequence
of at least one cluster successfully passed the translation
to AA step 270 (83.1%) [incl. 39 with PCR−] 270 (96.4%) [incl. 15 with PCR−] Number of specimens for which the consensus sequence of
the major cluster2 did not pass the translation to AA step 77 (23.7%) [incl. 25 with PCR−] 17 (6.1%) [incl. 2 with PCR−]
Number of specimens for which the consensus sequence of
the major cluster3 did not belong to the target group4 0 1 (0.4%) [incl. 1 with PCR−] (lab. aerosol contamination)
Number of specimens for which the consensus sequence of the major cluster was identical to sequence(s) of another
species of Ceratosolen5 21 (6.5%) [incl. 9 with PCR−] 8 (2.9%) [incl. 1 with PCR−] Table 2. Sequencing results of the MiSeq data set. (Regions for which paired-end reads did overlap). 1As
revealed by a visual inspection of the gel after the first PCR step. 2The cluster that contains the largest proportion
of reads/sequences is called the “major cluster”. 3At this stage of the process, “major cluster” stands for the
cluster that contains the largest proportion of reads/sequences AND whose consensus sequence successfully passed the translation to amino acids step. 4as revealed by NCBI-BLAST (e.g. symbionts, parasites, or laboratory
aerosol contamination). 5as revealed by visual inspection of trees. In this case, sequences belong to the target
group (Ceratosolen) but are identical to sequences from another species (100% BP). May be due to cross-contamination during library preparation or conversion of indexes due to mixed clusters on the flow cell (clonal clusters derived from more than one template molecule), but also to mtDNAintrogression (which is undetectable without taxonomic knowledge of the group or comparison with nuDNA data sets).
NaOH concentration during the library denaturation step before loading libraries onto the reagent cartridge for Illumina MiSeq sequencing, as suggested in the NextSeq protocol of Illumina. Neutralization should also work for other MiSeq libraries provided than PCR success is not too low (here the average PCR success was 70%). As for the classical PCR approach, the negative correlation observed between amplification success and time elapsed since specimen collection argues in favour of rapid DNA extraction after fieldwork instead of long-term storage of specimens in EtOH.
In this study, we amplified three genomic regions on 369 samples but other experimental design may be used to better fit with researcher needs (more markers with less samples or more samples with less markers). The up to 25 million paired-end reads generated by the MiSeq platform indeed open up many possibilities. That says, sequencing depth allocated to each marker should be large enough to allow sequencing of the target region. Indeed, sequencing depth of NGS methods statistically alleviates the effect of base calling errors but also increases chances of getting non-target loci (e.g. pseudogenes, non-homologous locus). Our study shows that quality con-trol steps are required to make sure the sequences included in the data sets are accurate. Indeed, clusters that contained the largest proportion of reads can contain frame shift mutations and/or stop codons or belong to non-target organisms (e.g. symbionts or parasites). Amplification of sequences from symbionts or parasites occurred almost exclusively when we used primers derived from the universal Folmer’ primers to amplify COI (LCO1490, HCO219838) (up to 25.9% of the clusters obtained from positive PCR products and that passed the
translation step). This shows that caution must be taken when using COI for a metabarcoding approach to assess species diversity.
The power of this approach coupled with its simplicity makes it attractive, but good practice designed to detect issues with Sanger sequences are still relevant. At least a translation to amino acids and a comparison to existing database (e.g. through BLAST) should be performed before sequence validation. While it has been underlined that pseudogenes, heteroplasmic sequences or sequences from symbionts or parasites may be obtained4,
con-tamination during library preparation is less discussed. Indeed, concon-tamination is difficult to detect and requires taxonomic knowledge and sequencing of both mtDNA and nuDNA markers to be distinguished from mtDNA introgression. Our results confirm that several markers should be sequenced for species diversity assessment to avoid underestimation of the number of species.
While it may be possible to identify cross-contamination or amplification of non-coding copies (e.g. nuclear mitochondrial pseudogenes, NUMTS), sorting out paralogs in which no stop codon or frameshift mutation is detected may be difficult. In this study, we found nine specimens for which we were not able to select just one from the two copies that passed our quality control steps. These specimens were thus represented by two sequences in the final MiSeq data set. Origin of these sequences is difficult to assess. PCR or sequencing mistakes cannot be ruled out and use of replicate sequencing may reduce the noise in data processing39 but NUMTS or heteroplasms
can also explain such pattern as NUMTS have already been identified in fig wasps40. Differentiating heteroplasmic
sequences from sequences of recent pseudogenisation is tricky and rely mostly on mitochondrial enrichment experiments41. When compared to the total number of samples for which we managed to select only one cluster:
306 (COI), 261 (Cytb), 273 (EF) this result may appear negligible but this pattern could be problematic for groups in which coding NUMTS are frequent (e.g. grasshoppers18 or longhorn beetles42). With Sanger data sets,
unrecog-nized co-amplification of heteroplasmic sequences or nuclear mitochondrial pseudogenes (NUMTS) have been frequently interpreted as the presence of cryptic species – especially in absence of taxonomic expertise - and have contributed to overestimating the number of unique species18.
Gene region
COI-long EF
Forward reads Reverse reads Forward reads Reverse reads
PCR success (MiSeq)1 244 specimens (66.1%) 93 species (80.9%) 244 specimens (66.1%) 89 species
(77.4%) Number (%) of specimens for which at least one
cluster of reads was obtained 273 (74.0%) [incl. 36 with PCR−] 305 (82.7%) [incl. 72 with PCR−] 300 (81.3%) [incl. 61 with PCR−] 330 (89.4%) [incl. 93 with PCR−] Number of specimens with PCR+ but no cluster
of reads 7 (2.9%) 11 (4.5%) 5 (2.0%) 7 (2.9%)
Average (maximum) number of clusters per
specimen 3,0 (17) 3,5 (12) 3,7 (17) 4,3 (23)
Number of specimens for which the consensus sequence of at least one cluster successfully
passed the translation to AA step 218 (79.9%) [incl. 18 with PCR−]
199 (65.2%) [incl. 25 with
PCR−] 291 (97.0%) [incl. 50 with PCR−] 227 (68.8%) [incl. 27 with PCR−] Number of specimens for which the consensus
sequence of the major cluster2 did not pass the
translation to AA step 116 (42.5%) [incl. 25 with PCR−]
278 (91.1%) [incl. 63 with
PCR−] 33 (11.0%) [incl. 20 with PCR−] 279 (84.5%) [incl. 86 with PCR−] Number of specimens for which the consensus
sequence of the major cluster3 did not belong to
the target group4
28 (10.3%) [incl. 4 with PCR−] (27 nematodes, 1 lab. aerosol contamination)
47 (15.4%) [incl. 2 with PCR−] (41 Wolbachia, 6
nematodes) 0 0
Number of specimens for which the consensus sequence of the major cluster was identical to
sequence(s) of another species of Ceratosolen5 6 (2.2%) [incl 2 with PCR−] 1 (0.3%) [incl 0 with PCR−]
11 (3.7%) [incl. 4
with PCR−] 6 (1.8%) [incl. 2 with PCR−]
Table 3. Sequencing results of the MiSeq data set. (Regions for which paired-end reads did not overlap). See
On the final trees (Sanger + Miseq sequences), 4.3% (COI) and 5.2% (Cytb) of the species for which at least one consensus sequence passed quality control were paraphyletic or clustered into two divergent groups of sequences (> 7%). In some cases, for Cytb, such pattern could be explained by the fact that two primer pairs were used to generate the Sanger data set, while only one pair was used for the MiSeq part. However the same pattern was observed when the same pair was used for the Sanger and the MiSeq data set. All these cases are difficult to explain (PCR/sequencing errors, NUMTS, heteroplasmic sequences?). They showed that filtering methods to select sequence clusters may influence the results and could lead to an overestimation of species diversity. Therefore, these results are a reminder of how important it is to take a close look at the data, work in close relation with expert taxonomists and consider more than one marker for DNA-taxonomy or species diversity assessment.
To conclude, two-step PCR approaches should contribute to accelerating the global effort of improving the state of completeness and accuracy of present reference databases. This will be facilitated by the ease of switching from multigenic, Sanger-based methods to NGS methods, as presented here. We advocate capitalizing on the
Figure 4. Success rate of amplification as a factor of time since storage of specimens in alcohol.
Gene region COI Cytb EF
Sanger Number of specimens with a valid sequence 195 264 203
MiSeq
Number (%) of specimens/species with at least
one consensus sequence 306 (82.9%) [incl. 27 with PCR−]/109 (94.8%)
261 (70.7%) [incl. 13 with PCR−]/95
(82.6%)
273 (74.0%) [incl. 45 with PCR−]/97 (84.3%) Number of specimens/species with PCR+ but
no sequence 141/22 18/4 9/3
Number of specimens/species with PCR− but
at least one consensus sequence 273/94 14/3 45/11 Number of specimens with two valid sequences 1 (0.3%) 8 (3.1%) 0 Number of problematic species (See text for
discussion) 3 (2.6%) 2 (1.7%) 4 (3.5%) 0
Table 4. Final results obtained on the combined data set (Sanger + MiSeq), after completion of the workflow. 1At least one of the two PCR reactions (COI-short or COI-long) was positive. 2At least one of the
two PCR reactions was positive for at least one specimen. 3The two PCR reactions were negative. 4The two PCR
huge investments made to construct barcode databases (BOLD) and in practice be conservative and pragmatic in maintaining the genes and the methods mastered by scientists, while shifting to next generation sequencing.
Methods
Study group.
We used the fig wasp genus Ceratosolen (Hymenoptera: Chalcidoidea: Agaonidae) as a test case because it is a relatively diverse genus of insects (encompassing an estimate of 230 species worldwide, of which only 71 are described). This genus pollinates Ficus species of the subgenus Sycomorus (158 described species worldwide) and is thoroughly studied by researchers working on figs. The genome of one species of Ceratosolen has been recently sequenced43. Furthermore, in the last 20 years, we have developed a multigenic barcodingdatabase using Sanger sequencing that encompass an unprecedented sampling of species. We have previously sequenced these specimens on COI, Cytb and EF1α.
Sampling.
One-hundred twelve species of Ceratosolen were included in the data set, of which about half (n = 62) are undescribed. Three species were taken as outgroups: two in the genus Kradibia (sister group of the genus Ceratosolen44) and one in the genus Tetrapus. All material were collected alive from 1996 to 2015, fixed in75% ethanol and identified morphologically by JYR.
Sanger. DNA from two to three specimens per species was extracted over the past 20 years.
MiSeq. On average, DNA from three specimens per species was extracted. A total of 369 individual specimens
were included in the library.
DNA extraction.
DNA was isolated using the Qiagen DNeasy®
96 Blood and Tissue Kit (Qiagen, Germany) according to manufacturer’s protocols. Individual specimens were incubated overnight at 56 °C in the lysis buffer before performing the next extraction steps. In the end, DNA was recovered in a total of 100 μ L of AE buffer (two elution steps of 50 μ L AE buffer each).With very few exceptions, sequences were obtained from the non-destructive extraction of a single wasp specimen (corpse kept as voucher). When destructive extraction was used, vouchers were selected among speci-mens sampled from the same tree and the same fig after careful identification by JYR. Destructive extraction was performed for the Miseq library. Vouchers are deposited at CBGP, Montferrier-sur-Lez, France.
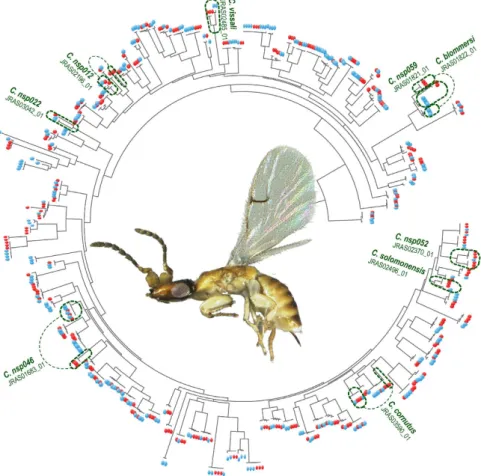
Figure 5. RAxML tree for the Cytb data set (MiSeq + Sanger) (BP: 1000 replicates). Red (resp. blue) circles
represent sequences produced by Sanger (resp. MiSeq) sequencing. Dotted lines show problematic cases as discussed in text (see also Fig. S2).
Sanger data set.
Two mitochondrial protein-coding genes [the 5′ end of the cytochrome c oxidase subunit I (COI) “barcode fragment” and part of the cytochrome b (Cytb)] and one nuclear protein-coding gene [elongation factor-1a (EF1a)] were included in the study. Amplification and sequencing protocols followed Cruaud et al.45 forCytb and COI and Cruaud et al.46 for EF1a. The two strands for each overlapping fragment were assembled using
Geneious v6.1.647. All sequences that we obtained for the target species were included in the data set. Sequences
were aligned using MAFFT v7.22248 (L-INSI option). Alignments were translated to amino acids using Geneious
v6.1.6 to detect frameshift mutations and premature stop codons. Phylogenetic trees were inferred for each gene using RAxML v8.2.449. Given that α and the proportion of invariable sites cannot be optimized independently
from each other50 and following Stamatakis’ personal recommendations (RAxML manual), a GTR + Γ model
was applied to each gene region. We used a discrete gamma approximation51 with four categories. GTRCAT
approximation of models was used for ML boostrapping52 (1000 replicates). Resulting trees were visualised and
annotated using TreeGraph 253. Following visual inspections of trees, contaminations (100% identical sequences
for samples belonging to different species between which hybridization is not possible) were removed from the data set.
Illumina MiSeq library preparation.
Our library preparation approach involved two PCR steps with dif-ferent primer pairs, as suggested in the Illumina protocol for 16S Metagenomic Sequencing Library Preparation. The first PCR step is performed to amplify the targeted DNA region. In this step, the primer pairs used contain a standard Illumina sequencing primer, a 0 to 3 bp “heterogeneity spacer” (as suggested in Fadrosh et al.54) andthe gene-specific primer (Fig. 1). The second PCR step is performed in order to multiplex individual specimens on the same Illumina MiSeq flowcell and to add necessary Illumina adapters. In this second step, primer pairs used contain the appropriate Illumina adapter allowing amplicons to bind to the flow cell, a 8-nt index sequence (as described in Kozich et al.55) and the Illumina sequencing primer sequence. We used negative controls (DNA
extraction and PCR) on each plate from the beginning to the end of sequencing.
First PCR step. Each reaction contained 3 μ L DNA template, 5 μ L QIAGEN Multiplex PCR Master Mix (Qiagen,
Germany) (including Taq polymerase, dNTPs and MgCl2), 0.5 μ M forward primer, 0.5 μ M reverse primer and 1 μ L molecular biology grade water in a total volume of 10 μ L. PCR conditions were 95 °C for 15 min; 35 cycles of 94 °C for 30 sec, 51 °C for 90 sec and 72 °C for 60 sec; and a final extension at 72 °C for 10 min. All amplifica-tions were completed on an Eppendorf Master cycle rep gradient S thermocycler (Eppendorf, Germany). The same primers as for the Sanger data set were used. Two primer pairs for COI: LCO1490puc + HCO2198puc45
(“COI-long”, Table 1) and UEA356 + HCO219857 (“COI-short”); one pair for Cytb: CB1 + CB258 and one pair for
EF1a: F2-557F + F2-1118R59. Thus, four amplicons were generated per specimens. Amplicons were visualized on
1% agarose gels stained after electrophoresis using ethidium bromide to quantify PCR success.
Second PCR step. During this step, amplicons were dual indexed with multiple identifiers (MIDs). Each pair of
indices (i5 and i7) was unique to a PCR well, with the aim of assigning each sequence to a sample. PCR conditions were 95 °C for 15 min; 10 cycles of 95 °C for 40 sec, 55 °C for 45 sec and 72 °C for 60 sec; and a final extension at 72 °C for 10 min.
Positive and negative PCR amplifications were pooled in equal volumes into tubes (1 tube per primer pair) and the resulting mixtures were subjected to gel electrophoresis on a 1.25% low-melting agarose gels. The bands corresponding to the PCR products were excised from the gel and purified with a PCR clean-up and gel extrac-tion kit (Macherey-Nagel, Germany). Purified DNA was recovered in a total of 40 μ L of NE buffer and quality and quantity of PCR fragments were determined by running 1 μ L of each sample on a Agilent Bioanalyzer 2100 using the DNA 1000 LabChip kit (Agilent Technologies, USA). Each library (one per primer pair) was then quantified with the Kapa library Quantification kits (KapaBiosystems, USA). The four librairies were then pooled equimol-arly (0.06 nM of each gene region). The low concentration of the resulting library (0.24 nM) led to a high concen-tration of NaOH in the final solution after dilution with HT1 during the denaturation step, before the libraries were loaded onto the MiSeq flowcell. We therefore introduced 200 mM Tris-HCl pH7 to ensure that NaOH will be correctly hydrolyzed in the final solution. PhiX control library (Illumina) was combined with the amplicon library (expected at 5%) to artificially increase the genetic diversity and the library was paired-end sequenced on a MiSeq flowcell using a V3 MiSeq sequencing kit. Image analysis, base calling and data quality assessment were performed on the MiSeq instrument.
Analyses of the MiSeq data set. Step 1, from read filtering to clustering.
Quality control checks were performed on raw sequence data with FastQC v.0.11.260 (Fig. 2). Overlapping paired-end reads werereas-sembled using FLASH v.1.2.1161 with default settings and extended maximum overlap length (300). When
paired-end reads did not overlap (COI-long and EF1a, Table 1), forward and reverse reads were analysed sep-arately. CUTADAPT v.1.2.162 with default settings was used to sort paired reads by gene region and remove
primers. COI-long and EF1a forward and reverse reads were quality trimmed (reads were truncated at the first position having quality score < 21) using VSEARCH v.1.8.1 (available at https://github.com/torognes/vsearch). After removing primers and quality filtering, fastq files were converted to fasta files and sequences less than 150 bp in length were filtered out using VSEARCH. Remaining sequences were dereplicated and putative chi-meric sequences were removed using VSEARCH. Cytb and COI-short sequences were then trimmed by length using PRINSEQ v.0.20.463 (minimum length = 400 bp; maximum length = 550 bp). Illumina sequences were
then clustered using SWARM v.2.1.664 and CAP365 with default settings. Finally, clusters containing less than 10
leaded to an overestimation of the number of clusters by SWARM for COI-long and EF1a forward and reverse reads. Therefore only the results obtained with CAP3 were subsequently analysed.
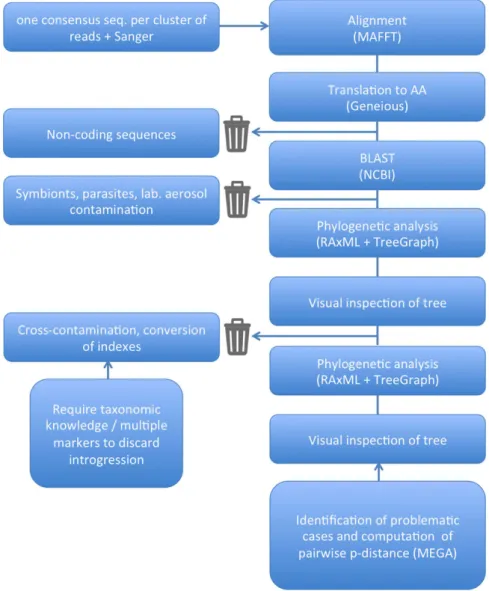
Analyses of the MiSeq data set. Step 2, quality control of clusters of reads.
For each gene region, the consensus sequence of each cluster was aligned with the corresponding Sanger data set using MAFFT v7.222 (default parameter) (Fig. 3). When paired-end reads did not overlap (COI-long and EF1a), clusters of reads 1 and clusters of reads 2 were analysed separately. At this step of the process, 6 data sets were assembled:COI Sanger + COI-short MiSeq, COI Sanger + COI-long MiSeq reads 1, COI Sanger + COI-long MiSeq reads 2, Cytb Sanger + Cytb MiSeq, EF Sanger + EF reads 1 MiSeq, EF Sanger + EF reads 2 MiSeq. Alignments were translated to amino acids using Geneiousv6.1.6 to detect frameshift mutations and premature stop codons. Non-coding sequences were removed from the data set. NCBI-BLAST was used to identify sequences that did not belong to the target group. Phylogenetic trees were then inferred for each gene region using RAxML. Resulting trees were visualised and annotated using TreeGraph 253. Visual inspection of trees was carried out to identifycontamina-tions, which were subsequently removed from the data sets. Reads 1 and 2 for COI and EF were then merged into a single data set (gaps were inserted between the non overlapping reads). Finally, COI-long and COI-short data sets were merged using Geneious v6.1.6. When COI-long and COI-short sequences were exactly identical in their overlapping part, they were merged to get the longest possible COI sequence. When differences were observed, they were not merged and both sequences were kept in the final data set. MEGA766 was used to calculate average
divergence (p-distance) between sequence groups for problematic cases. Final data sets are available from figshare (https://dx.doi.org/10.6084/m9.figshare.4555492).
References
1. Taberlet, P., Coissac, E., Pompanon, F., Brochmann, C. & Willerslev, E. Towards next-generation biodiversity assessment using DNA metabarcoding. Molecular Ecology 21, 2045–2050 (2012).
2. Shokralla, S. et al. Massively parallel multiplex DNA sequencing for specimen identification using an IlluminaMiSeq platform.
Scientific reports 5, 9687 (2015).
3. Ji, Y. Q. et al. Reliable, verifiable and efficient monitoring of biodiversity via metabarcoding. Ecology Letters 16, 1245–1257 (2013). 4. Shokralla, S. et al. Next-generation DNA barcoding: using next-generation sequencing to enhance and accelerate DNA barcode
capture from single specimens. Molecular Ecology Resources 14, 892–901 (2014).
5. Meier, R., Wong, W., Srivathsan, A. & Foo, M. $1 DNA barcodes for reconstructing complex phenomes and finding rare species in specimen-rich samples. Cladistics 32, 100–110 (2015).
6. Bergsten, J. et al. The Effect of Geographical Scale of Sampling on DNA Barcoding. Systematic Biology 61, 851–869 (2012). 7. Meyer, C. P. & Paulay, G. DNA barcoding: Error rates based on comprehensive sampling. Plos Biology 3, 2229–2238 (2005). 8. Berry, D., Ben Mahfoudh, K., Wagner, M. & Loy, A. Barcoded primers used in multiplex ampliconpyrosequencing bias amplification.
Applied and Environmental Microbiology 77, 7846–7849 (2011).
9. Herbold, C. W. et al. A flexible and economical barcoding approach for highly multiplexed amplicon sequencing of diverse target genes. Frontiers in Microbiology 6, 731 (2015).
10. Levy, S. F. et al. Quantitative evolutionary dynamics using high-resolution lineage tracking. Nature 519, 181–186 (2015). 11. Seitz, V. et al. A new method to prevent carry-over contaminations in two-step PCR NGS library preparations. Nucleic Acids
Research 43 (2015).
12. Fahner, N. A., Shokralla, S., Baird, D. J. & Hajibabaei, M. Large-scale monitoring of plants through environmental DNA metabarcoding of soil: recovery, resolution, and annotation of four DNA markers. PLoS ONE 11, e0157505 (2016).
13. Gibson, J. F. et al. Large-scale biomonitoring of remote and threatened ecosystems via high-throughput sequencing. PLoS ONE 10, e0138432 (2015).
14. McClenaghan, B., Gibson, J. F., Shokralla, S. & Hajibabaei, M. Discrimination of grasshopper (Orthoptera: Acrididae) diet and niche overlap using next-generation sequencing of gut contents. Ecology and Evolution 5, 3046–3055 (2015).
15. Frezal, L. & Leblois, R. Four years of DNA barcoding: Current advances and prospects. Infection Genetics and Evolution 8, 727–736 (2008).
16. Berthier, K., Chapuis, M.-P., Moosavi, S. M., Tohidi-Esfahani, D. & Sword, G. A. Nuclear insertions and heteroplasmy of mitochondrial DNA as two sources of intra-individual genomic variation in grasshoppers. Systematic Entomology 36, 285–299 (2011).
17. Vollmer, N. L., Viricel, A., Wilcox, L., Moore, M. K. & Rosel, P. E. The occurrence of mtDNAheteroplasmy in multiple cetacean species. Current Genetics 57, 115–131 (2011).
18. Song, H., Buhay, J. E., Whiting, M. F. & Crandall, K. A. Many species in one: DNA barcoding overestimates the number of species when nuclear mitochondrial pseudogenes are coamplified. Proceedings of the National Academy of Sciences of the United States of
America 105, 13486–13491 (2008).
19. Smith, M. A. et al. Wolbachia and DNA Barcoding Insects: Patterns, Potential, and Problems. PLoS ONE 7 (2012).
20. Hrcek, J. A. N., Miller, S. E., Quicke, D. L. J. & Smith, M. A. Molecular detection of trophic links in a complex insect host-parasitoid food web. Molecular Ecology Resources 11, 786–794 (2011).
21. Vogler, A. P. & Monaghan, M. T. Recent advances in DNA taxonomy. Journal of Zoological Systematics and Evolutionary Research 45, 1–10 (2006).
22. Dupuis, J. R., Roe, A. D. & Sperling, F. A. H. Multi-locus species delimitation in closely related animals and fungi: one marker is not enough. Molecular Ecology 21, 4422–4436 (2012).
23. Leaché, A. D. & Fujita, M. K. Bayesian species delimitation in West African forest geckos (Hemidactylusfasciatus). Proceedings of the
Royal Society B-Biological Sciences 277, 3071–3077 (2010).
24. Carstens, B. C., Pelletier, T. A., Reid, N. M. & Satler, J. D. How to fail at species delimitation. Molecular Ecology 22, 4369–4383 (2013). 25. Whitworth, T. L., Dawson, R. D., Magalon, H. & Baudry, E. DNA barcoding cannot reliably identify species of the blowfly genus
Protocalliphora (Diptera: Calliphoridae). Proceedings of the Royal Society B-Biological Sciences 274, 1731–1739 (2007).
26. Straub, S. C. K. et al. Navigating the tip of the genomic iceberg: Next-generation sequencing for plant systematics. American Journal
of Botany 99, 349–364 (2012).
27. Coissac, E., Hollingsworth, P. M., Lavergne, S. & Taberlet, P. From barcodes to genomes: extending the concept of DNA barcoding. Molecular Ecology (in press).
28. Linard, B., Crampton-Platt, A., Gillett, C., Timmermans, M. & Vogler, A. P. Metagenome Skimming of Insect Specimen Pools: Potential for Comparative Genomics. Genome Biology and Evolution 7, 1474–1489 (2015).
29. Hebert, P. D. N., DeWaard, J. R. & Landry, J. F. DNA barcodes for 1/1000 of the animal kingdom. Biology letters (2009).
30. Virgilio, M., Backeljau, T., Nevado, B. & De Meyer, M. Comparative performances of DNA barcoding across insect orders. BMC
31. Meier, R., Shiyang, K., Vaidya, G. & Ng, P. DNA Barcoding and taxonomy in Diptera: A tale of high intraspecific variability and low identification success. Systematic Biology 55, 715–728 (2006).
32. Danforth, B. N. & Ji, S. Elongation factor-1 a occurs as two copies in bees: implication for phylogenetic analysis of EF-1 a in insects.
Molecular Biology and Evolution 15, 225–235 (1998).
33. Townsend, J. P. Profiling phylogenetic informativeness. Systematic Biology 56, 222–231 (2007).
34. Schirmer, M. et al. Insight into biases and sequencing errors for amplicon sequencing with the IlluminaMiSeq platform. Nucleic
Acids Research 43 (2015).
35. Wiens, J. J. Missing data, incomplete taxa, and phylogenetic accuracy. Systematic Biology 52, 528–538 (2003).
36. Leray, M. et al. A new versatile primer set targeting a short fragment of the mitochondrial COI region for metabarcoding metazoan diversity: application for characterizing coral reef fish gut contents. Frontiers in Zoology 10, 34 (2013).
37. Meusnier, I. et al. A universal DNA mini-barcode for biodiversity analysis. Bmc Genomics 9 (2008).
38. Folmer, O., Black, M., Hoeh, W. R., Lutz, R. & Vrijenhoek, R. DNA primers for amplification of mitochondrial cytochrome c oxidase subunit I from diverse metazoan invertebrates. Molecular Marine Biology and Biotechnology 3, 294–299 (1994).
39. Robasky, K., Lewis, N. E. & Church, G. M. The role of replicates for error mitigation in next-generation sequencing. Nature Reviews
Genetics 15, 56–62 (2014).
40. Chen, Y., Liu, M., Compton, S. G. & Chen, X.-Y. Distribution of nuclear mitochondrial pseudogenes in three pollinator fig wasps associated with Ficuspumila. ActaOecologica 57, 142–149 (2014).
41. Magnacca, K. N. & Brown, M. J. F. Mitochondrial heteroplasmy and DNA barcoding in Hawaiian Hylaeus (Nesoprosopis) bees (Hymenoptera: Colletidae). BMC Evolutionary Biology 10, 174 (2010).
42. Koutroumpa, F. A., Lieutier, F. & Roux-Morabito, G. Incorporation of mitochondrial fragments in the nuclear genome (Numts) of the longhorned beetle Monochamusgalloprovincialis (Coleoptera, Cerambycidae). Journal of Zoological Systematics and
Evolutionary Research 47, 141–148 (2009).
43. Xiao, J. H. et al. Obligate mutualism within a host drives the extreme specialization of a fig wasp genome. Genome Biology 14, R141 (2013). 44. Cruaud, A. et al. An extreme case of plant-insect co-diversification: figs and fig-pollinating wasps. Systematic Biology 61, 1029–1047 (2012). 45. Cruaud, A. et al. Laying the foundations for a new classification of Agaonidae (Hymenoptera: Chalcidoidea), a multilocus
phylogenetic approach. Cladistics 26, 359–387 (2010).
46. Cruaud, A. et al. Out-of-Australia and back again: the worldwide historical biogeography of non-pollinating fig wasps (Hymenoptera: Sycophaginae). Journal of Biogeography 38, 209–225 (2011).
47. Drummond, A. J. et al. Geneious v6.1.6, Available from http://www.geneious.com. (Biomatters Inc, San Francisco, CA, USA, 2010). 48. Katoh, K. & Standley, D. M. MAFFT multiple sequence alignment software version 7: improvements in performance and usability.
Molecular Biology and Evolution 30, 772–780 (2013).
49. Stamatakis, A. RAxML version 8: a tool for phylogenetic analysis and post-analysis of large phylogenies. Bioinformatics 30, 1312–1313 (2014).
50. Gu, X. Maximum likelihood estimation of the heterogeneity of substitution rate among nucleotide sites. Molecular Biology and
Evolution 12, 546–557 (1995).
51. Yang, Z. Maximum likelihood phylogenetic estimation from DNA sequences with variable rates over sites: approximate methods.
Journal of Molecular Evolution 39, 306–314 (1994).
52. Stamatakis, A. Phylogenetic models of rate heterogeneity: A High Performance Computing Perspective. International Parallel and Distributed Processing Symposium (IPDPS 2006), Rhodes Island, Greece, 8 pp (2006).
53. Stöver, B. C. & Müller, K. F. TreeGraph 2: Combining and visualizingevidence from different phylogenetic analyses. BMC
Bioinformatics 11, 7 (2010).
54. Fadrosh, D. W. et al. An improved dual-indexing approach for multiplexed 16S rRNA gene sequencing on the IlluminaMiSeq platform. Microbiome 2, 1 (2014).
55. Kozich, J. J., Westcott, S. L., Baxter, N. T., Highlander, S. K. & Schloss, P. D. Development of a dual-index sequencing strategy and curation pipeline for analyzingamplicon sequence data on the MiSeqIllumina sequencing platform. Applied and environmental
microbiology 79, 5112–5120 (2013).
56. Zhang, D.-X. & Hewitt, G. M. Assessment of the universality and utility of a set of conserved mitochondrial primers in insects. Insect
Molecular Biology 6, 143–150 (1996).
57. Hebert, P. D. N., Cywinska, A., Shelley, L. B. & deWaard, J. R. Biological identifications through DNA barcodes. Proceedings of the
Royal Society of London B 270, 313–321 (2003).
58. Jermiin, L. S. & Crozier, R. H. The cytochrome b region in the mitochondrial DNA of the ant Tetraponerarufoniger. Sequence divergence in Hymenoptera may be associate with nucleotide contents. Journal of Molecular Evolution 38, 282–294 (1994). 59. Brady, S. G., Schultz, T. R., Fisher, B. L. & Ward, P. S. Evaluating alternative hypotheses for the early evolution and diversification of
ants. Proceedings of the National Academy of Sciences of the United States of America 103, 18172–18177 (2006).
60. Andrews, S. FastQC - A Quality Control application for FastQ files. Available from http://www.bioinformatics.babraham.ac.uk/ projects/fastqc/ (2010).
61. Magoc, T. & Salzberg, S. L. FLASH: fast length adjustment of short reads to improve genome assemblies. Bioinformatics 27, 2957–2963 (2011).
62. Martin, M. Cutadapt removes adapter sequences from high-throughput sequencing reads. EMBnet. journal 17, 10–12 (2011). 63. Schmieder, R. & Edwards, R. Quality control and preprocessing of metagenomic datasets. Bioinformatics 27, 863–864 (2011). 64. Mahe, F., Rognes, T., Quince, C., de Vargas, C. & Dunthorn, M. Swarm v2: highly-scalable and high-resolution amplicon clustering.
Peerj 3 (2015).
65. Huang, X. & Madan, A. CAP3: A DNA sequence assembly program. Genome Research 9, 868–877 (1999).
66. Kumar, S., Stecher, G. & Tamura, K. MEGA7: Molecular Evolutionary Genetics Analysis version 7.0 for bigger datasets. Molecular
Biology and Evolution msw054 (2016).
Acknowledgements
We thank Maxime Galan (INRA, CBGP, France) and Adrien Vigneron (Newcastle University, UK) for technical advises; Laure Benoit (CIRAD, CBGP, France) and Guenaëlle Genson (INRA, CBGP, France) for their help with lab work; Hélène Vignes (CIRAD, GPTR, France) for sequencing of the library as well as Alexandre Dehne-Garcia (INRA, CBGP, France) for his help with the CBGP HPC computational platform on which analyses were performed. We thank Anthony Bain (Taipei University), Yang Da-Rong, Zuodong Wei and Peng Yan-Qiong (Xishuangbanna Botanical Garden, China), Rhett Harrison (CTFS, Malaysia), Rong Chien Lin (University Taipei, Taiwan), Emmanuelle Jousselin, Carole Kerdelhué (CBGP Montpellier, France), Marc Pignal (MNHN Paris, France), Etienne Randrianjohany (CNRE, Madagascar), Simon van Noort (Iziko Museums of South Africa), Rosichon Ubaidillah (LIPI Bogor, Indonesia) for providing samples and two anonymous reviewers for their comments on this manuscript. This work was supported by the network Bibliothèque du Vivant funded by the CNRS, the Muséum National d’Histoire Naturelle and the Institut National de la Recherche Agronomique.
Author Contributions
J.Y.R. and A.C. designed the study. J.Y.R., L.J.R. and A.C. collected the samples. P.C. performed laboratory work and designed the custom workflow. P.C., J.Y.R. and A.C. analysed the data. P.C., J.Y.R., L.J.R. and A.C. wrote the manuscript.
Additional Information
Supplementary information accompanies this paper at http://www.nature.com/srep Competing financial interests: The authors declare no competing financial interests.
How to cite this article: Cruaud, P. et al. High-throughput sequencing of multiple amplicons for barcoding and
integrative taxonomy. Sci. Rep. 7, 41948; doi: 10.1038/srep41948 (2017).
Publisher's note: Springer Nature remains neutral with regard to jurisdictional claims in published maps and
institutional affiliations.
This work is licensed under a Creative Commons Attribution 4.0 International License. The images or other third party material in this article are included in the article’s Creative Commons license, unless indicated otherwise in the credit line; if the material is not included under the Creative Commons license, users will need to obtain permission from the license holder to reproduce the material. To view a copy of this license, visit http://creativecommons.org/licenses/by/4.0/