HAL Id: hal-01923755
https://hal.umontpellier.fr/hal-01923755
Submitted on 2 Jun 2021
HAL is a multi-disciplinary open access
archive for the deposit and dissemination of
sci-entific research documents, whether they are
pub-lished or not. The documents may come from
teaching and research institutions in France or
abroad, or from public or private research centers.
L’archive ouverte pluridisciplinaire HAL, est
destinée au dépôt et à la diffusion de documents
scientifiques de niveau recherche, publiés ou non,
émanant des établissements d’enseignement et de
recherche français ou étrangers, des laboratoires
publics ou privés.
Distributed under a Creative Commons Attribution| 4.0 International License
Georgina Rivera-Ingraham, Iara Rocchetta, Ulf Bickmeyer, Stefanie Meyer,
Doris Abele
To cite this version:
Georgina Rivera-Ingraham, Iara Rocchetta, Ulf Bickmeyer, Stefanie Meyer, Doris Abele. Spatial
com-partmentalization of free radical formation and mitochondrial heterogeneity in bivalve gills revealed
by live-imaging techniques. Frontiers in Zoology, BioMed Central, 2016, 13, pp.4.
�10.1186/s12983-016-0137-1�. �hal-01923755�
R E S E A R C H
Open Access
Spatial compartmentalization of free radical
formation and mitochondrial heterogeneity
in bivalve gills revealed by live-imaging
techniques
Georgina A. Rivera-Ingraham
2, Iara Rocchetta
3, Ulf Bickmeyer
1, Stefanie Meyer
1and Doris Abele
1*Abstract
Background: Reactive oxygen (ROS) and nitrogen (RNS) species are produced during normal unstressed metabolic activity in aerobic tissues. Most analytical work uses tissue homogenates, and lacks spatial information on the tissue specific sites of actual ROS formation. Live-imaging techniques (LIT) utilize target-specific fluorescent dyes to visualize biochemical processes at cellular level.
Results: Together with oxidative stress measurements, here we report application of LIT to bivalve gills for ex-vivo analysis of gill physiology and mapping of ROS and RNS formation in the living tissue. Our results indicate that a) mitochondria located in the basal parts of the epithelial cells close to the blood vessels are hyperpolarized with
highΔψm, whereas b) the peripheral mitochondria close to the cilia have low (depolarized) Δψm. These
mitochondria are densely packed (mitotracker Deep Red 633 staining), have acidic pH (Ageladine-A) and collocate with high formation of nitric oxide (DAF-2DA staining). NO formation is also observed in the endothelial cells
surrounding the filament blood sinus. ROS (namely H2O2, HOO•and ONOO−radicals, assessed through C-H2DFFDA
staining) are mainly formed within the blood sinus of the filaments and are likely to be produced by hemocytes as defense against invading pathogens. On the ventral bend of the gills, subepithelial mucus glands contain large
mucous vacuoles showing higher fluorescence intensities for O2•-than the rest of the tissue. Whether this O2
•-production is instrumental to mucus formation or serves antimicrobial protection of the gill surface is unknown. Cells of the ventral bends contain the superoxide forming mucocytes and show significantly higher protein carbonyl formation than the rest of the gill tissue.
Conclusions: In summary, ROS and RNS formation is highly compartmentalized in bivalve gills under unstressed conditions. The main mechanisms are the differentiation of mitochondria membrane potential and basal ROS formation in inner and outer filament layers, as well as potentially antimicrobial ROS formation in the central blood vessel. Our results provide new insight into this subject and highlight the fact that studying ROS formation in tissue homogenates may not be adequate to understand the underlying mechanism in complex tissues.
Keywords: Bivalve, Gill, Live-imaging, Fluorescence, Mitochondria, ROS, RNS
* Correspondence:Doris.Abele@awi.de
1Alfred-Wegener-Institut Helmholtz-Zentrum für Polar- und Meeresforschung,
Department of Biosciences, Am Handelshafen 12, 27570 Bremerhaven, Germany
Full list of author information is available at the end of the article
© 2016 Rivera-Ingraham et al. Open Access This article is distributed under the terms of the Creative Commons Attribution 4.0 International License (http://creativecommons.org/licenses/by/4.0/), which permits unrestricted use, distribution, and reproduction in any medium, provided you give appropriate credit to the original author(s) and the source, provide a link to the Creative Commons license, and indicate if changes were made. The Creative Commons Public Domain Dedication waiver (http://creativecommons.org/publicdomain/zero/1.0/) applies to the data made available in this article, unless otherwise stated.
Reactive oxygen and nitrogen species (ROS: H2O2, O2˙−,
OH˙, HO2˙; RNS: NO˙, ONOO−) are by-products of
cellular respiration in the mitochondria and of cellular detoxification mechanisms in the ER system. Both, ROS and RNS are strong redox agents, known to produce secondary radicals and oxidize cellular macromolecules such as membrane lipids, proteins, as well as nucleic acids (RNA and DNA). Both types of radicals are there-fore considered as being cytotoxic and major drivers of cellular death and damage. The same radical species are also involved in cellular signaling including apoptotic death signals and further play an active role in processes such as muscle contraction [1], host-defense reactions (reviewed by [2–5]), and induction of mucus production via initiation of transcription factor cascades [6].
Under unstressed conditions ROS and RNS are pro-duced in very low quantities, and bulk formation of ROS is usually measured in mitochondrial isolates [7, 8], cell preparations [9, 10], or even in tissue homogenates (e.g. [11, 12]). In vitro analysis of mitochondrial preparations or submitochondrial particles yields information on ROS forming mechanisms, albeit under non-physiological conditions, i.e. using artificial media, too high pO2, and
too high respiratory substrate concentrations. On the other hand, using tissue homogenates or cell prepara-tions, the ROS forming mechanisms and the subcellular structures of the ROS forming organelles (mitochondria, ER, vacuoles) remain unknown. The high reactivity of ROS and RNS implicates, however, that species specific lifetime and diffusion pathways inside cells and tissues are short. Thus, in living tissues steady state ROS con-centrations are highly compartmentalized, and the distri-bution patterns of different ROS and RNS across sub-cellular structures can be the clue to their biochemical role and function. This compartmentalization can now be visualized using ROS/RNS sensitive probes, mole-cules which emit fluorescence upon reaction with the active species and after excitation at a distinct wave-length. Fluorescent probes enable minimal invasive de-tection of very small ROS/RNS quantities in living cells and tissues and facilitate the understanding of the dynam-ics and function of ROS production. For example, this type of studies may also help by providing input on the amount of ROS/RNS (in a qualitative manner) and thus setting the bases for further studies aiming to distinguish signaling or biosynthetic functions from toxic overproduc-tion of ROS/RNS during an acute stress response.
In the past decades, live-imaging techniques have emerged as key tools for non-invasive studies of a wide variety of physiological parameters in- and ex-vivo in tis-sues and organs. In the field of oxidative stress, live-imaging techniques have been used to detect transient states of high ROS formation, and their use has
enormously contributed to the understanding of small scale and high resolution spatial ROS dynamics in mam-malian tissues (e.g. [13, 14]), while far less is known about marine invertebrate tissues.
Gills of marine and freshwater bivalves are multi-functional organs. They are the main respiratory tis-sues but, at the same time, filtering organs which collect food particles from the water column and transport them towards the mouth. Gill morphology and ultrastructure have been extensively studied, in-cluding the mechanisms underlying ciliary motility and beat frequency (e.g. [15–17]). The gills are also sensory organs for oxygen and salinity changes [18] and the first barrier against natural impacts (pathogens and natural toxins) or anthropogenic pollution. Most of the environmental stressors acting on marine animals pro-duce oxidative stress and damage signals in the gills so that these organs are often targeted in environmental im-pact studies.
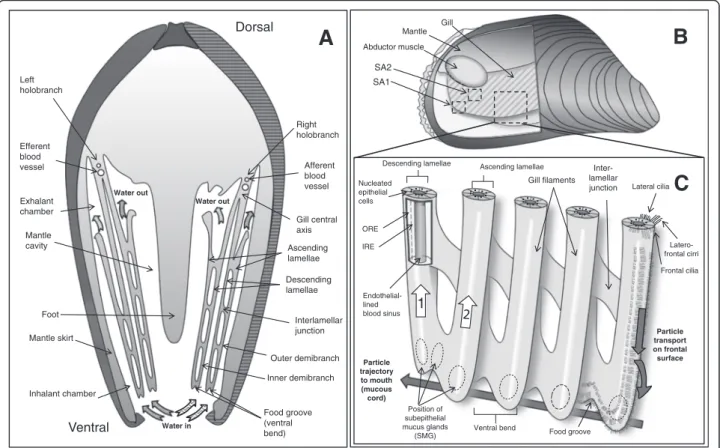
The family Mytilidae has homorhabdic filibranch gills [19], one of the structurally most simple gill types, and has become a model organism for particle capture and transport (e.g. [20–23]). Briefly, homorhabdic (i.e. all filaments are of the same size) filibranch gills consist of long filaments, folded in a W-shape. Each gill (or holobranch) consists of two demibranchs (Fig. 1a) which join at a central axis. Each demibranch consists of two lamellae: descending lamellae face each other and drop from the central axis into the mantle cavity where they bend upwards to form the ascending lamellae. Lamellae are composed of numerous gill filaments joined through ciliary interlamellar junctions (Fig. 1a, b, c). The ventral bend of each demibranch forms a food groove, a longitudinal-oriented structure in which the food particle-mucus slurry is propelled towards the mouth by ventrally-directed water currents generated by ciliary beating (Fig. 1c). Gill filaments are densely packed with mucus forming mucocyte cells (around 13 to 33 per 100μm) [21]. The dorsal part of the ventral bends con-tains a large number of subepithelial mucus glands (SMGs) [as described by 21] (Fig. 1c) which release mucus into the food groove to retain the collected food particles and transport them towards the labial palps and the mouth.
Here, we present a first spatially resolved analysis of ROS and RNS formation in different regions of the gill filaments of the common blue mussel Mytilus edulis, using multiphoton and confocal laser micros-copy. We relate small scale patterns of ROS forma-tion in unstressed bivalve gills to the regions of highest mitochondrial density and to the spatial pat-tern in mitochondrial activity state (membrane poten-tial, Δψm). Non-invasive fluorescence imaging was applied to map different ROS/RNS in unstressed,
intact sections of bivalve gill filaments to understand the dynamics and compartmentalization of basal ROS production in a complex tissue. Our aim was to bet-ter understand the multiple roles that ROS may have in gill physiology as deduced from their site of pro-duction, especially with respect to ciliary beat activity, blood vessel constriction, and antimicrobial protection of this multi-functional organ. Another interest was to investigate possible ROS involvement in mucus production within the SMGs.
Results
Gill micro-morphology and location of nuclei
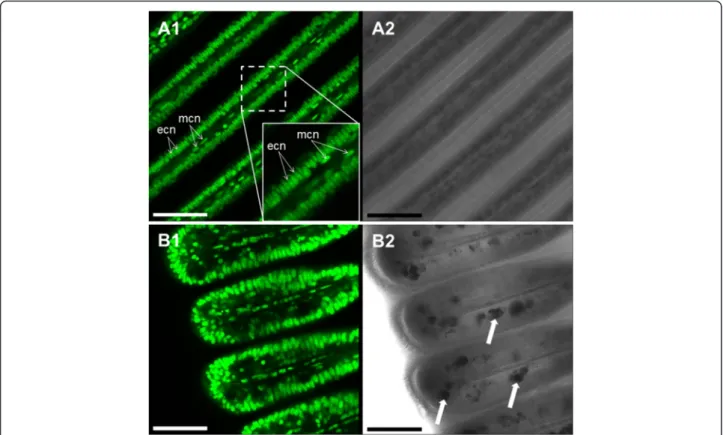
Staining with Syto-13 evidenced that the longitudinal sections of the gill filaments are composed of a 1-cell thick ciliated epithelial layer around a muscle cell coated blood sinus (Fig. 2). While the ciliated epithelial cells have large oval nuclei (18.9 ± 0.4μm2) aligned as a palis-ade (see Fig. 2a1 insert), the long and thin endothelial (muscle) cells around the blood sinus are characterized by their elongated nuclei (Fig. 2).
SMGs located in the ventral bends of the gill filaments contain numerous large and irregular mucous-filled vac-uoles with an average diameter of 57.6 ± 4.5 μm2. Vacu-oles were more frequent in the filament sections adjacent to the mouth of each mussel.
Mitochondrial density and membrane potentials
Staining with MTK Deep Red 633 (Fig. 3a) indicated the highest densities of mitochondria in the periphery of the gill filamental cells, directly beneath the cilia basal bodies (Fig. 3b). Statistical analysis revealed significant differences between the outer and the inner region of the epithelial cell longitudinal section, with the pat-tern of intensity: outer region > inner region > blood sinus (K = 28.45; p < 0.001). Vacuoles located within the SMGs were in no case stained by MTK Deep Red 633 (Fig. 3c).
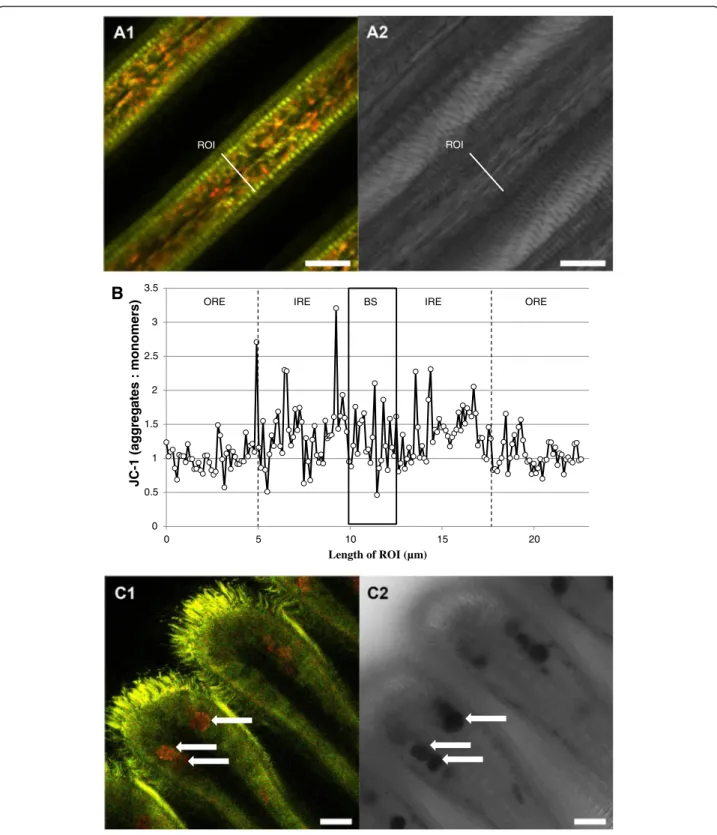
JC-1 staining demonstrated two groups of mitochon-dria within the epithelial cells, clearly distinguishable according to membrane potential (Δψm), and presum-ably involved in distinct physiological processes. The
Food groove (ventral bend) Foot Interlamellar junction Ascending lamellae Descending lamellae Mantle cavity Mantle skirt Outer demibranch Inner demibranch Gill central axis Dorsal Ventral Exhalant chamber Inhalant chamber Left holobranch Water in Water out Water out Efferent blood vessel
A
Right holobranch Afferent blood vessel Abductor muscle Gill MantleB
SA1 SA2 Endothelial-lined blood sinus Ascending lamellae Descending lamellaeVentral bend Food groove
Gill filaments Position of subepithelial mucus glands (SMG) Inter-lamellar junction
C
Particle trajectory to mouth (mucous cord) Lateral cilia Latero-frontal cirri Frontal cilia .... .... ... ... ... ... Nucleated epithelial cells ORE IRE Particle transport on frontal surface 1Fig. 1 Schematic representations of the gill morphology of M. edulis. a: cross section (posterior view) of M. edulis. b: lateral view of a dissected M. edulis from the right side. Part of the right valve and mantle has been removed to reveal the right holobranch. c: detail view of the outer demibranch. SA1 and SA2 correspond to the different areas of the gill which were statistically compared in the study (ventral bend, and rest, respectively). ORE and IRE correspond to areas of the filament epithelial cells which were statistically compared in the study (outer regions and inner region, respectively). White arrow (1) indicates the direction of a slight augmentation in the number of mucocytes containing acid dominant mucopolysaccharids. White arrow (2) indicates the direction of a slight augmentation in the number of mucocytes containing neutral dominant mucopolysaccharids. For a detailed description on the histological distribution of SMGs, refer to [21]
outermost mitochondria directly below the cilia had the lowest (relatively depolarized)Δψm (JC-1 predominating in the green monomeric form indicating more active electron transport), whereas the rest of mitochondria had significantly higher membrane potential over the inner mitochondrial membrane (Fig. 4a). Statistical analyses confirmed significant differences of Δψm (ag-gregate: monomeric (outer region) 0.98 ± 0.02), (aggrega-te:monomeric (inner region) 1.20 ± 0.05) (K = 12.38; p < 0.001, Fig. 4b). Presence of both groups of mitochondria was confirmed by time laps experiments using JC-10 (Fig. 5). JC-1 and JC-10 staining both revealed depolarization of the mitochondrial membrane potential (green staining), following application of FCCP (Fig. 5a). This confirms the proper functioning of both dyes in Mytilus gill mitochondria. Further functional measure-ments (time laps) were performed using JC-10 and injecting ADP (end concentration 5 mM) directly into the microscopic chamber containing the gill filaments in measuring buffer. This application of ADP induced a short 2 min hyperpolarization in all experiments followed by depolarization (N = 6) of the membrane potential, indicating phosphorylation of ADP that caused the reduction of Δψm (Fig. 5b). The time laps
experiments using JC-10 thus support a dynamic change of mitochondrial membrane potential in re-sponse to ADP availability to the gill cells. On the contrary, addition of ATP had no reproducible effect, presumable because any amount of ATP transported into the cells was directly consumed for ciliary beat activity.
In spite of being regarded as “mitochondria-specific”, JC-1 also strongly stained the mucus-containing vacu-oles located within the SMGs. The aggregated form of JC-1 predominated in the SMGs (red fluorescence), and this may be indicating a high electrochemical potential across the membrane of the mucus filled vacuoles (Fig. 4c). However, to our knowledge this is the first re-port of JC-1 staining such structures.
ROS/RNS distribution
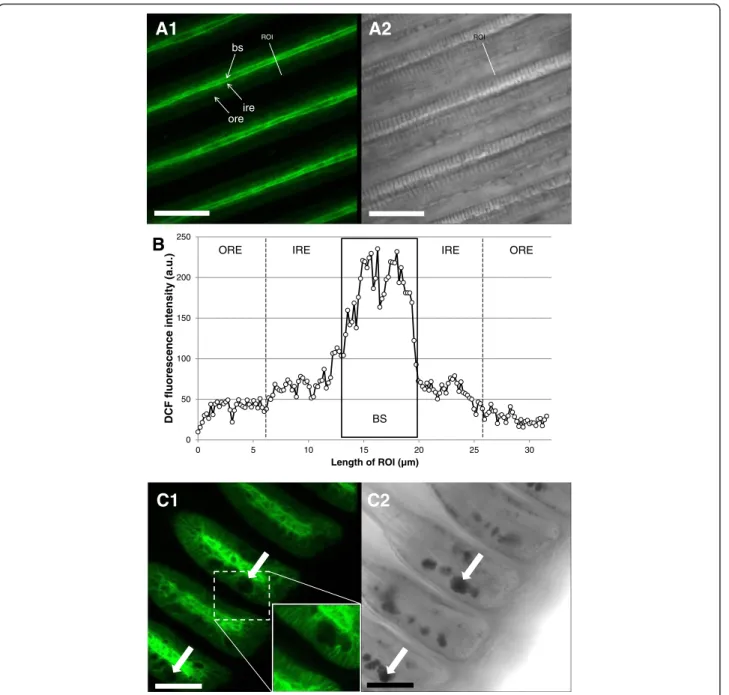
The distribution of maximal ROS and RNS formation differed greatly between different filament regions. We observed the maximum DCF fluorescence (C-H2DFFDA
staining, ROS/RNS sensitive) within the blood sinus of the gill filaments (Fig. 6a), 1.8 fold higher (166.89 ± 7.41 a.u.) than the fluorescence recorded within the ciliated epithelial cells of the filament (47.00 ±
Fig. 2 Representative Syto-13 staining in M. edulis gills (a1, b1) and corresponding transmission images (a2, b2). a: gill filaments with a capture showing a detailed view of nuclei structures. Filaments are composed of 1-layer epithelial cells with oval nuclei (ecn) perpendicular to the filament longitudinal axis. Note the muscle cells in the innermost areas of the filament with elongated nuclei (mcn) oriented parallel to the central blood sinus. b: Syto-13 staining of the ventral bend area of the gill with mucus-filled vacuoles (arrows). Scale bars = 50μm
1.66 a.u.) (K = 92.86; p < 0.001) (Fig. 6b). Within these epithelial cells, significantly higher DCF fluorescence was registered in the innermost areas around the blood sinus (F = 216.28; p < 0.001). Mucus-filled vacu-oles within SMGs were in no case stained by C-H2DFFDA (Fig. 6c).
Contrary to the results obtained with C-H2DFFDA
staining, the highest O2•- concentrations (DHE staining)
were observed within the epithelial cells (Fig. 7a). The 2-OH-E+:DHE fluorescence ratio in the epithelial cells of the filament (37.46 ± 3.34) was 2.4 fold higher than in the blood sinus (15.46 ± 2.02) (K = 55.47; p < 0.001) (Fig. 7b). Within epithelial cells, superoxide formation was higher in the outermost areas of the cells, as 2-OH-E+:DHE fluorescence ratio was significantly higher than in areas adjacent to the blood sinus (F = 6.906; p = 0.01). 0 50 100 150 200 250 300 0 5 10 15 20 25 30 MTK Deep Red 6 33 Intensity (a.u.) Length of ROI (µm)
B
ROIORE IRE IRE ORE
A1
A2
C1
C2
BS bs ore ireFig. 3 Representative Mitotracker Deep Red 633 staining of M. edulis gills. a1: overview of filamental structure (fluorescence image), a2: transmission image of the same area. b: fluorescence intensity profile across an average filament. Black box marks the limits of the blood sinus. Outer and inner region of epithelial cells were defined for statistical purposes as described in the method section. c1: view of ventral bend stained with MT Deep Red 633, c2: corresponding transmission image. Arrows mark mucus-filled vacuoles in SMGs. Bs = blood sinus, ore = outer region of the epithelial cells, ire = inner region of epithelial cells, ROI = region of interest. Scale bar = 25μm
0 0.5 1 1.5 2 2.5 3 3.5 0 5 10 15 20 JC-1 (aggr e g a te s : monomer s ) Length of ROI (µm)
B
ROI ROIORE IRE BS IRE ORE
Fig. 4 Representative JC-1 staining of gill filament visualizing areas with different mitochondrial membrane potential (Δψm). a1: overview of filament structure, a2: corresponding transmission image. b: fluorescence intensity ratio (aggregate/red: monomer/green) across a filament transect. Black box delimits the blood sinus. Outer and inner region of epithelial cells were defined for statistical purposes as described in the method section. c1: general view of the ventral bend, c2: corresponding transmission image. Arrows mark the mucus-filled vacuoles within the SMGs. ROI = region of interest. Scale bar = 20μm
This staining also provided specific patterns in the ventral bend areas, where SMG vacuoles were inten-sively stained by DHE indicating higher concentra-tion of superoxide to be present than in the other areas of the ventral bend cells (Fig. 7c). However, in neither of the cases (filaments or ventral bend areas)
DHE staining provided structurally-resolved fluores-cence patterns.
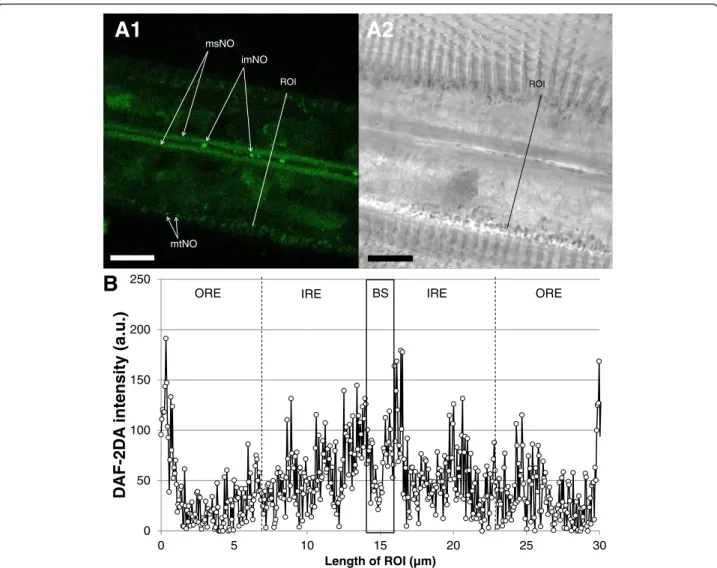
DAF-2T fluorescence provides information regarding NO formation, which concentrated mainly in two re-gions of the gills filaments (Fig. 8a, b). Major DAF-2T fluorescence in the gills was recorded in the longitudinal
0min 2 min 4 min
6 min 8 min 10 min
2.5 2.0 1.5 1.0 0.5 0 2 4 6 8 10 Time (min) JC-10 aggr eg a te: monomer *** JC-10 aggr eg a te: monomer 3 2 1 0 5’ FCCP control
A1
B1
B2
5’ FCCP contr o lA2
+ ADP 5mMFig. 5 JC-1 / JC-10 control experiments. Effect of FCCP (a) (*** p < 0.001 (t-test) and ADP (b) (**p < 0.005, one way ANOVA) on JC-1 / JC-10 staining. Subfigures 1 show the average registered values while subfigures 2 show representative images of the experiments
cellular structures (muscle cells) surrounding the blood vessels and in the region of the blood vessel proximal mitochondria. DAF fluorescence in the peripheral region of densely packed cilia-associated mitochondria was less intense. Finally, small and likely circulating particles (<1 μm) within the blood vessels were strongly stained by DAF-2T. No significant DAF-2T fluorescence was re-corded within the SMG vacuoles in the ventral bends of the gill filaments.
pH measurements
Ageladine-a pH-sensitive staining resolves a pH range from 4 to 8 [24] and evidenced that the areas of the gills with the lowest, i.e. most acidic, pH values were the areas of the cilia-associated mitochondria (Fig. 9a). Some mucus vacu-oles had low pH values (Fig. 9b), but in most of the glands the pH did not differ from the rest of the tissue (presum-ably between 7.5 and 8). No other conspicuous differences in pH were observed in the gill filament structure.
0 50 100 150 200 250 0 5 10 15 20 25 30 DCF fluores ce nce intensity ( a.u .) Length of ROI (µm)
B
ROI ROIC2
C1
A1
A2
ORE IRE IRE ORE
bs
ore ire
BS
Fig. 6 Representative DCF fluorescence patterns in M. edulis gills (ROS/RNS formation). a1: overview of filamental structure, a2: corresponding transmission image. b: DCF fluorescence intensity profile across a gill filament. Black box indicates the limits of blood sinus. Outer and inner region of epithelial cells were defined for statistical purposes as described in the method section. c1: view of the ventral bends with subepithelial mucus glands containing mucus vacuoles (white arrows) and corresponding transmission image (c2). Bs = blood sinus, ore = outer region of epithelial cells, ire = inner region of epithelial cells, ROI = region of interest. Scale bars = 50μm
Antioxidant defense and oxidative damage
Our analyses of antioxidant enzyme activities revealed differences between the outer ventral bend region and the rest of the gills: the ventral bends had signifi-cantly lower CAT activities than the rest of the gill tissue (F = 12.28; p < 0.05) (Fig. 10a), but no differ-ences were observed in SOD activities (F = 0.004; p = n.s.) (Fig. 10b). Protein carbonyl (PC) content was higher in ventral bends (F = 16.53; p < 0.01), indicating that these areas are subject to higher oxidative stress than the rest of the gill tissue (Fig. 10c).
Discussion
To our knowledge this study provides the first record of the mitochondrial spatial distribution and the basal pro-duction patterns of different ROS/RNS in bivalve gill tissues.
Epithelial cells show differential mitochondrial populations based on membrane potential
Mitochondria are unequally distributed within the cili-ated epithelial cells of the bivalve Mytilus edulis. They are mainly located in the peripheral region of gill
B
0 20 40 60 80 100 120 140 160 180 200 0 5 10 15 20 25 30 2 -OH-E +: DHE intensity ratio Length of ROI (µm) ROI ROI ROIC1
C2
C3
ORE IRE IRE ORE
bs ore ire
BS
Fig. 7 Representative 2-OH-E+fluorescence patterns (O2•-formation) in M. edulis gills. a: Overview of gill filaments, a1: blue-range fluorescence
image (400–440 nm), a2: red-range fluorescence image (620–660 nm), a3: corresponding transmission image. b: fluorescence intensity profile across a filament. Black box indicates limits of blood sinus. Outer and inner region of epithelial cells were defined for statistical purposes as described in the method section. c: View of the ventral bend with subepithelial mucus glands containing mucus vacuoles (white arrows). c1: blue-range fluorescence image (400–440 nm), c2: red-range fluorescence image (620–660 nm), c3: corresponding transmission image. Bs = blood sinus, ore = outer region of epithelial cells, ire = inner region of epithelial cells, mc = mucocyte, ROI = region of interest. Scale bar = 25μm
epithelia cells, above the big basal nucleus and close to the cilia basal bodies, as confirmed by Syto-13 and MTK Deep Red 633 combined staining (Fig. 11). Across spe-cies and tissues, ciliated epithelia are commonly associ-ated to basal layers of densely packed mitochondria (e.g. [25–27]), and the epithelial cells of Mytilus gills are a good example for this (e.g. [28, 29]). Kasuya & Miyoshi [30] found these mitochondria to be specifically abun-dant in the apical areas of well-developed ciliary rootlets of the Mytilus gills, and we also observed mitochondrial staining in ciliary rootlets. With JC-1 staining, the per-ipheral mitochondria appeared mostly green (more monomeric JC-1) indicating low membrane potential and active phosphorylation, presumably generating the ATP for ciliary beating.
To the contrary, many mitochondria in the central parts of the gills around the blood vessels were stained
red (more aggregate with JC-1/10, indicative of hyperpo-larized electrochemical membrane potential and reduced phosphorylation). Application of ADP at high concentra-tion (5 mM) caused a short transient membrane depolarization as aggregate was lost from the mitochon-drial matrix, and complete green staining was achieved when applying the uncoupler FCCP. Likewise FCCP ab-rogated transmembrane potential in mitochondria of isolated rat cardiac myocytes which led to a massive de-crease of the aggregate (red) and a smaller inde-crease of the monomer (green) JC-1/10 form in the uncoupled de-energized vertebrate mitochondria [31]. The increase of the green monomer, respectively the reduction of red aggregates, during prolonged experimental durations (>15 min) could be due to i) preferred bleaching of the red aggregate form or ii) wash-out of JC10 which was absent in the measuring buffer.
0 50 100 150 200 250 0 5 10 15 20 25 30
DAF-2DA
intensity
(a.u.)
Length of ROI (µm)A1
A2
B
ROIORE IRE IRE ORE
ROI
mtNO msNO
imNO
BS
Fig. 8 Representative DAF-2DA staining of M. edulis gill filaments (NO formation). a1: fluorescence (DAF-2T) image of filamental section, a2 corresponding transmission image. b: fluorescence intensity profile across an average filament. Black box indicates the blood sinus inner area. imNO = immunocyte-associated NO formation, msNO = muscle cell-associated NO formation, mtNO = mitochondria-associated NO formation, Scale bar = 10μm
Mitochondrial populations with distinct Δψm were previously observed in different commercial cell cultures by Smiley et al. [32] and by Collins et al. [33], working with JC-1. Reers et al. [34] remarked that in the majority of cells so far investigated, mitochondria often have
vari-able Δψm, frequently combining charged and
non-charged mitochondria within cells [35].
Presence of idling mitochondria with high Δψm indi-cating low O2 consumption and low phosphorylation
rates may be of advantage in respiratory epithelia. The-oretically, by limiting oxygen consumption in the gill epithelial cells, the “down-tuned” mitochondria around the blood vessel facilitate oxygen transport towards the hemolymph, thus serving the needs of the organism. Skulachev [35] proposed that a similar mechanism is in-volved for muscle fiber oxygen gradients in the periph-ery of capillary blood vessels in the sarcolemma. On the other hand, in the region containing the more highly polarized (red stained) mitochondria, we additionally re-corded indications of NO formation (DAF-2DA stain-ing). There are numerous literature reports of reversible depolarization of Δψm by NO (see review by [36]), which is also known to be a potent and reversible inhibi-tor of mitochondrial respiration in vertebrate cells. Such inhibition occurs in a variety of ways, but is mainly due
to NO reversibly binding to the oxygen binding site of cytochrome oxidase, the terminal complex of the re-spiratory chain.
Muscle-associated NO formation and NO forming cells in the hemolymph
The blood sinus is surrounded by longitudinal endothelial muscle cells with elongated nuclei as observed with Syto-13 staining (Fig. 2). In all analyzed samples, the highest DAF-2T fluorescence intensities were recorded within these longitudinal muscle cells (Fig. 8) or in their immedi-ate vicinity (see above). We hypothesize that the presence of NO in the muscle cells is involved in muscle contrac-tion/relaxation, causing a change in blood sinus diameter and regulating hemolymph flow in response to variable oxygen availability: wider blood vessels allowing for enhanced flow under hypoxic conditions. In vertebrates, NO mediates the activity of smooth (e.g. [37]) skeletal (e.g. [38, 39]) and cardiac muscles (e.g. [40]). Furthermore, NO has been reported to regulate hemolymph pressure in squid, Sepia officinalis, by acting as a vasodilator [41], and further experimental work is needed to investigate this putative function of NO in M. edulis gills.
We also observed significant NO concentrations within the blood sinus in most samples, linked to the
Fig. 9 a1: representative ageladine-a pH staining of filament section, a2: corresponding transmission image. b1: representative ageladine-a pH staining of the ventral bend, b2: transmission image. pH varied among SMG mucus vesicles between acidic (grey arrow) and less acidic vesicles (white arrow). Scale bar = 20μm
presence of small vesicles (<1 μm) in the hemolymph (molluscan blood). This could be related to the anti-microbial defense system (review by [42]) of immuno-cytes which also produce NO directed against invading pathogens. NO has a cytotoxic effect which leads to bac-terial clumping. NO formation by hemocyte cells has been reported from several bivalve species (see review by [43]), including M. edulis (e.g. [44]).
ROS formation in the hemolymph is accompanied by enhanced catalase (CAT) defense
C-H2DFFDA staining also highlighted the intense ROS/
RNS formation ongoing within the blood sinuses of gill filaments (Fig. 6). The same was observed in the context of our previous studies [45], where DCF fluorescence in
hypoxically-incubated gills was 3.8-fold lower than in normoxically-treated gills, an indirect support that DCF fluorescence indeed measures ROS formation. The hemolymph of bivalves has previously been reported to contain significant amounts of H2O2. The bivalve
Astarte borealis has an average hemolymph concentra-tion of 10 μM H2O2 [46], which was measured by an
alternative method using the fluorescence indicator sco-poletin in a peroxidase catalyzed assay. This bivalve con-tains a giant composed and extracellular hemoglobin molecule, and the authors found evidence that H2O2
forms as a consequence of this hemoglobin autoxidizing to met-hemoglobin when exposing the bivalve to hyp-oxic treatment. In non-hemoglobin containing species the most plausible role of hemolymphatic H2O2is,
how-ever, its well-known antimicrobial property. Hemocytes are known to be the main source of antimicrobial ROS formation in oxidative burst reactions reported for sev-eral bivalves (e.g. [47–50]) including M. edulis [51, 52]. However, we cannot discard the possibility that H2O2
could also be formed within the epithelial cells, through the activity of superoxide dismutase (SOD), and diffuses into the blood sinuses where we measured it. Neverthe-less, oxidative damage to the epithelial and endothelial cells composing the gill filaments can be expected to re-sult from these oxidative burst reactions. Our rere-sults suggest that ciliated epithelial cells contain a high CAT activity (as shown in Fig. 10a) which helps to prevent protein oxidation (Fig. 10c) and mitigates the oxidative stress effect that is associated to these oxidative burst re-actions. A note of caution should, however, accompany our results and conclusions regarding the use of C-H2DFFDA (e.g. see review by [53]).
Mucus-containing vacuoles are characterized by high
O2•- formation: a double edge sword?
The mucus-containing vacuoles located within the SMGs (as observed in Fig. 2) appear to generate O2
•-radicals (Fig. 7), and our confocal analysis suggests superoxide to be the predominant radical in this cellular compartment. These superoxide anions may be secreted together with the mucus and have several functions. Gill tissues are not only respiratory epithelia, but also serve particle uptake through the secretion of mucus. How-ever, a filtering tissue covered by mucus may additionally create a suitable habitat for microorganisms, which may have adverse effects for the respiratory surface. Super-oxide anion is a relatively weak oxidant, but nevertheless has direct antimicrobial properties and may also be con-verted to the more persistent H2O2. Thus, producing a
mucus with high concentrations of O2•- could have a
protective effect against the colonization of the gill sur-face by microbial tuffs. High concentrations of O2•-have
previously been detected in gill mucus of freshwater
Fig. 10 Antioxidant defense and oxidative damage measured in ventral bends and longitudinal sections of gill filaments as a) CAT activity, b) SOD activity and c) PC content. Values are expressed as mean ± SEM. * p < 0.05
catfish [54]. Superoxide rich mucus is also used in many different cell types as a defense against pathogens. In fact, it is hypothesized that the properties of O2•- as
mi-crobial killer is, at least in part, the basis for the function of phagocytic vacuoles, which are loaded with O2
•-resulting from burst activity of the NADPH oxidase (reviewed by [55]). Another good example is provided in the conjunctival tissue of the rabbit eye, which has been observed to secrete significant quantities of O2•-into the
mucus by granulocytes and another non-cellular ROS-generating oxidase system to protect the tissue from infections [56]. Yet another example are mammalian gastric mucosa cells, which are also known to produce O2•- to regulate the defense response against bacterial
growth [57]. But unlike the central areas of the gills, the ventral bends where these SMGs are located do not ap-pear to counteract this superoxide production through enhanced SOD or CAT activities. In fact, SOD activity was similar to the rest of the tissue (Fig. 10b), which ex-plains the higher oxidative damage (measured as PC content) in the ventral bends (Fig. 10c). Therefore, and unlike the rest of the gill filaments, cells located within the ventral bend areas of the gills are paying the price for the antibacterial protection and are subject to higher degrees of oxidative stress, leading to more active apop-totic turnover in bivalve gills compared to mantle or muscular tissue [58].
Conclusions
We used non-invasive fluorescence imaging to demon-strate that gill filament epithelial cells are composed of two spatially segregated groups of mitochondria which differ in ΔΨm. We also mapped different ROS/RNS in different sections of bivalve gill filaments to understand the dynamics and compartmentalization of basal ROS production in intact and unstressed tissue. Interpretation of these spatial ROS/RNS patterns can be used to specify
the functional role of these radical species within the gill structures. Released with the mucus, M. edulis may be using the antibacterial power of O2•- to avoid the
devel-opment of a biofilm on the gill surface and oxidize engulfed food particles. The high DCF fluorescence present in the hemolymph indicates defense against in-vading pathogens in the gill blood vessels. The free rad-ical NO may have multiple functions with respect to cellular homeostasis in gill tissue. NO is produced in the internal region of the epithelial cells and may provide an additional mechanism for the polarized membrane potential in the mitochondria surrounding the blood vessels. Furthermore, the presence of significant NO concentrations around and within blood vessels sug-gest its involvement in muscle contraction and thus hemolymph pressure regulation, which may be of key importance when dealing with the low environmental oxygen concentrations that these bivalves can face in their benthic habitat. Finally, the presence of NO within the blood vessel may add to pathogen defense exerted by circulating immunocyte cells.
Methods
Animal collection and maintenance
Blue mussels M. edulis were collected at Sylt Island (Germany) (N 055° 01′ 323 E 008° 26′ 430) in December 2012. No permissions were required to conduct this task and it did not involve any protected species. Ani-mals were transported to the Alfred-Wegener-Institut Helmholtz-Zentrum für Polar- und Meeresforschung (AWI) where they were maintained in aquaria at a constant temperature of 10 °C, 33 ‰ salinity and >99 % air saturation. Animals were cleaned from epibiotic growth and allowed to adapt to the aquarium conditions for 3 weeks in order to avoid any possible interference of the stress caused by the transport with the experimental results. Mussels were fed with live phytoplankton (Fa.
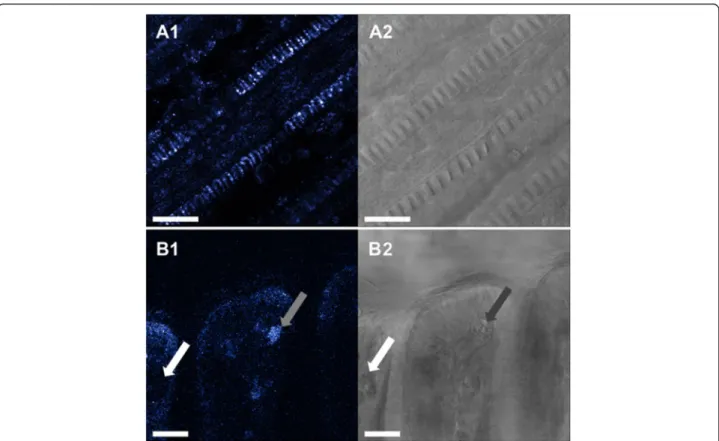
Fig. 11 Representative Syto-13 (nuclei specific, green fluorescence) and Mitotracker Deep Red 633 (mitochondria specific, red fluorescence) combined staining. a.: General (a1) and detailed view (a2) of M. edulis central gill filament section. b.: General (b1) and detailed view (b2) of the ventral bend. ecn = epithelial-cell nuclei, mcn = muscle-cell nuclei. White arrows highlight the presence of mucus-filled vacuoles
Plankton Farm, Sycamore, USA) once per week, and 48 h were allowed between feeding and the start of the analysis to avoid possible interference of nutrition-induced in-crease in metabolic rates. Water circulation in the aquaria was stopped for four hours to allow filter feeding. Water quality was weekly assessed using Nanocolor® Tube Tests (Macherey-Nagel GmbH & Co. KG, Germany) for ammo-nium and nitrate. Water in the aquaria was changed when values exceeded 0.4 mg/l and 0.2 mg/l of ammonium and nitrate, respectively.
Fluorometric analyses
Several physiological parameters and free radical forma-tion were assessed by live-imaging techniques, applying specific dyes and ex-vivo visualization using a Leica TCS SP5II confocal microscope (Leica Microsystems CMS GmbH, Wetzlar, Germany) equipped with a multiphoton laser (MaiTai-DeepSee, Spectra-Physics, Newport Corp.).
For each mussel analyzed, three freshly excised demi-branch pieces (Fig. 1) were transferred to sterile medium composed of seawater filtered over a 0.2 μm Whatman filter and supplemented with 15 mM Na-HEPES (NH-FSW) and 0.5 mM glucose. These ex-vivo tissue samples were incubated with different dyes, the chemical reac-tion mechanisms, concentrareac-tions and condireac-tions of visualization are summarized in Table 1. In order to con-firm staining patterns, between three and five animals were independently stained with each dye (see Table 1). Another three animals were used as controls to adjust the threshold for fluorophore staining and suppress the autofluorescence of the samples under the analytical conditions for each of the dyes. The formation of super-oxide anion (O2•-) was assessed by incubating samples in
a NH-FSW medium supplemented with 10 μM DHE
(Dihydroethidium, Molecular Probes D-23107, 0.5 mM stock solution in DMSO) whereas a number of other Table 1 Analysis conditions for each of the dyes used during the study
Excitation Emission
Dye Mechanism of function N Conc.
(μM) Incub. time (min) λ 1 (nm) λ 2 (nm) PMT1 (nm) PMT2 (nm) Calculation Ageladine-A (in DMSO) Probe which exists as a nearly uncharged
monomer under pH of 8.1–8.6. After crossing cellular membranes, becomes charged in the cytosol and acidic compartments of cells.
3 30 90 MP 760 - 420-500 - Average
intensity
C-H2DFFDA (in Ethanol) Non-fluorescent molecule which is
converted to a green-fluorescent form (DCF) when the acetate groups are removed by intracellular esterases and oxidation occurs in the cell.
3 20 30 488 - 510-550 - Average
Intensity
DAF-2DA (in DMSO) DAF-2 is formed by intracellular hydrolization of its ester bonds by esterases. It remains essentially non-fluorescent until it reacts with nitrosonium cation (forming the fluorescent DAF-2 T) and such fluorescence increases in a NO-dependent manner.
5 20 30 488 - 505-525 - Average
Intensity
Dihydroethidium (DHE) (in DMSO)
Regularly shows a blue emission when excited with a 355 nm laser. When oxidized to 2-dihydroxiethidium (2-OH-E+)
by the presence of O2−, it intercalates with
the DNA and shows a red emission when excited with an argon laser.
5 10 30 MP 710 488 400–440 620–660 Ratio PMT2/ PMT1
JC-1 and JC-10 (in DMSO) Green fluorescent probe which exists as a monomer at lowΔψm. With highΔψm
values, JC-1 and JC-10 aggregates and shows a red fluorescence.
3 10 60 488 488 500–550 560–600 Ratio PMT1/
PMT2
Lysotracker Red DND-99 (in DMSO)
Cell permeable fluorophore, which through protonation, concentrates on the membranes of spherical acidic organelles.
3 0.07 5 577 - 580–620 - Average
intensity MitoTracker Deep Red 633
(in DMSO)
Molecule which becomes evidently fluorescent once accumulates in the lipid environment of the mitochondria.
4 1 60 633 - 640–680 - Average
intensity Syto-13 (in DMSO) Dye which upon binding to nucleic acid
exhibits a green fluorescence.
3 10 60 488 - 500–520 - Average
Intensity All MP analyses conducted with 2% pulsing laser power of around 2 W
ROS species, e.g. H2O2, HOO• and ONOO− but not
O2•-, were assessed using 20μM C-H2DFFDA (Molecular
Probes C-13293, 2 mM stock solution in Ethanol) in NH-FSW. Both stainings lasted 30 min. Both of these dyes were previously tested and successfully used in a previous study by Rivera-Ingraham et al. [45], in which the effect of anoxia and anoxia-reoxygenation on ROS production was tested in M. edulis gill tissues. In these experiments the fluorescence was suppressed in anoxia and massively in-creased over normoxic control during reoxygenation, indi-cating the expected ROS burst (see Fig. 3 of Rivera-Ingraham et al. [45]). Nitric oxide (NO) formation was visualized through DAF-2DA staining for 30 min (Sigma D224, 5 mM in DMSO) using a final concentration of 20μM in NH-FSW.
Gill tissues were additionally stained with SYTO-13 (Molecular Probes S7575, 5 mM in DMSO) and Mitotracker (MTK) Deep Red 633 (Molecular Probes M-22426, 1 mM stock solution in DMSO) in order to locate the nuclei and observe the variations in mito-chondrial density, respectively. Staining with the pH-sensitive dye ageladine-a [59] (Marnas Biochemicals GmbH) allowed observations of pH gradients along filaments. JC-1 (Molecular Probes D-23107 in DMSO) or JC-10 (Enzo Life Sciences ENZ-52305, 1 mM stock solution in DMSO) staining were used to observe the
differences in mitochondrial membrane potential
(Δψm) along the filaments of M. edulis gills. During the course of the experiments we changed from using JC-1 to JC-10 because of its better solubility in aque-ous media. The validity of JC-1 staining, or of the de-rivative JC-10, for the detection of changes of Δψm has previously been documented for invertebrate models (e.g. [60]), including bivalve cells (e.g. [61, 62]). In order to prove the validity of the JC-1 or JC-10 signals in Mytilus edulis cells, we performed time series measure-ments using gill pieces stained with JC-10 to which we added 5 mM ADP to activated mitochondrial energetic coupling, expected to result in reducedΔψm.
Dyes were used individually for quantification and analysis to avoid possible interference among them. When possible, and only for further verification of the results, samples were stained with a combination of dyes, e.g., double staining was performed using Syto-13 and MTK Deep Red 633. In order to avoid photo-bleaching, a short period (<5 s) of lower reso-lution (512 × 512 pixel) live scanning was applied for focal adjustments and afterwards only one single scan (1024 × 1024 pixel) was run for each individual sample. Image analysis and fluorescence quantification was carried out as detailed in Rivera-Ingraham et al. [45] and with some modifications: briefly, a minimum of 5 pictures were taken across the surface of the dissected tissue. For each of the pictures taken, a total of 5 transects (or regions of
interest, ROI) were plotted perpendicularly to the longitu-dinal axis of the gill filament and on the areas of the high-est fluorescence intensity. Fluorescence intensity across the length of ROIs was quantified using Leica LAS AF Lite software (Leica Microsystems CMS GmbH 2011).
Enzymatic antioxidant activity and oxidative damage For a total of 9 specimens, gill tissues were dissected and the ventral bends were separated from the rest of the tissue. Both gill sections were weighed and stored at −80 °C until further analysis. All samples were ho-mogenized in a 30 mM KPi-120 mM KCl buffer (pH 7.4) supplemented with a cocktail of protease in-hibitors: phenylmethylsulfonyl fluoride (PMSF) (20 mg/ml in isopropanol), leupeptin (0.01 g/ml), pepstatin A (0.9 mg/ml in 90/10 ethanol/acetic acid) and aprotinin (0.01 g/ml). CAT activity was determined as the decom-position of a 0.3 M H2O2 solution (modified after [63])
and SOD activity was measured using the cytochrome oxi-dase assay after Livingstone et al. [64]. Oxidative damage was assessed as PC content using the OxiSelect Protein Carbonyl ELISA Kit (Cell Biolabs Inc., San Diego, CA) ac-cording to the manufacturer’s instructions. All values were related to protein content measured by the method origin-ally described by Bradford [65].
Statistical analyses
Two gill areas were compared in the study (Fig. 1): the ventral bend area (SA1) and the filamental part of the gill (SA2). For filaments, and only in the fluorometric testings, two different regions were independently ana-lyzed: the epithelial cells and the blood sinus. For further fluorometric analyses, epithelial cells were subdivided in two equally sized regions at higher image resolution (outer and inner regions, in all cases excluding the blood sinus). All data are expressed as mean ± s.e.m. All data sets were tested for normality and homocedasticity through a Kolmogorov-Smirnov and Levene’s Tests, respectively. When data complied with both of these assumptions, ANOVA tests were conducted. Other-wise, a Kruskal-Wallis test was carried out. Statistical analyses were performed using SPSS 15.0 (SPSS Inc., Chicago, IL, USA).
Abbreviations
CAT:catalase; MTK: mitotracker; NH-FSW: Na-HEPES-supplemented filtered seawater; NO: nitric oxide; PC: protein carbonyls; pO2: Oxygen partial pressure;
RNS: reactive nitrogen species; ROS: reactive oxygen species; SMG: subepithelial mucus gland; SOD: superoxide dismutase;ΔΨm: mitochondrial membrane potential.
Competing interests
The authors declare having no competing interests. Authors’ contributions
GAR-I: experimental design, analyses, data analyses, manuscript preparation; IR: experimental design, analyses, data analyses; UB: analyses, manuscript
All authors read and approved the final manuscript. Acknowledgements
The authors would like to specially thank Prof. Peter Beninger (University of Nantes, France) for his help in the identification of the subepithelial mucus glands. Thanks also go to Birgit Hussel (AWI, Sylt) for collecting the mussels used in the present study and the anonymous referees for their useful comments on the original manuscript. This study was partially funded by a postdoctoral grant of Fundación Ramón Areces (Spain) to G. Rivera-Ingraham and by the Georg Forster Stipend of the Humboldt Foundation (Germany) awarded to I. Rocchetta.
Author details
1
Alfred-Wegener-Institut Helmholtz-Zentrum für Polar- und Meeresforschung, Department of Biosciences, Am Handelshafen 12, 27570 Bremerhaven, Germany.2Present address: UMR 9190 MARBEC, Groupe fonctionnel AEO,
Bat. 24. CC092, Université de Montpellier, Place Eugène Bataillon, 34095 Montpellier, France.3Present address: Laboratorio de Ecotoxicología Acuática, INIBIOMA, Consejo Nacional de Investigaciones Científicas y Técnicas (CONICET-COMAHUE), CEAN, Junín de los Andes, Neuquén, Argentina.
Received: 14 December 2015 Accepted: 25 January 2016
References
1. Reid MB. Redox modulation of skeletal muscle contraction: what we know and what we don’t. J Appl Physiol. 2001;90(2):724–31.
2. Dröge W. Free radicals in the physiological control of cell function. Physiol Rev. 2002;82(1):47–95.
3. Turrens JF. Mitochondrial formation of reactive oxygen species. J Physiol. 2003;552(2):335–44. doi:10.1111/j.1469-7793.2003.00335.x.
4. Nikinmaa M, Gassmann M, Bogdanova A. Oxygen sensing: the role of reactive oxygen species. In: Abele D, Vázquez-Media JP, Zenteno-Savín T, editors. Oxidative stress in aquatic ecosystems. UK: Wiley-Blackwell; 2012. 5. Welker AF, Moreira DC, Campos EG, Hermes-Lima M. Role of redox
metabolism for adaptation of aquatic animals to drastic changes in oxygen availability. Comp Biochem Physiol A Physiol. 2013. doi:10.1016/ j.cbpa.2013.04.003.
6. Gensch E, Gallup M, Sucher A, Li D, Gebremichael A, Lemjabbar H, et al. Tobacco smoke control of mucin production in lung cells requires oxygen radicals AP-1 and JNK. J Biol Chem. 2004;279(37):39085–93.
7. Heise K, Puntarulo S, Pörtner HO, Abele D. Production of reactive oxygen species by isolated mitochondria of the Antarctic bivalve Laternula elliptica (King and Broderip) under heat stress. Comp Biochem Phys. 2003;134(1):79–90.
8. Philipp E, Pörtner H-O, Abele D. Mitochondrial ageing of a polar and a temperate mud clam. Mech Ageing Dev. 2005;126(5):610–9. 9. Donaghy L, Hong H-K, Lambert C, Park H-S, Shim WJ, Choi K-S. First
characterisation of the populations and immune-related activities of hemocytes from two edible gastropod species, the disk abalone, Haliotis discus discus and the spiny top shell, Turbo cornutus. Fish & shellfish immunology. 2010;28(1):87–97.
10. Donaghy L, Kim B-K, Hong H-K, Park H-S, Choi K-S. Flow cytometry studies on the populations and immune parameters of the hemocytes of the Suminoe oyster, Crassostrea ariakensis. Fish & shellfish immunology. 2009;27(2):296–301.
11. Viarengo A, Burlando B, Cavaletto M, Marchi B, Ponzano E, Blasco J. Role of metallothionein against oxidative stress in the mussel Mytilus galloprovincialis. Am J Physiol Regul Integr Comp Physiol. 1999;277:1612–9.
12. Ferreira-Cravo M, Reinhardt Piedras F, Barros Moraes T, Ribas Ferreira JL, de Freitas DP S, Dornelles Machado M, et al. Antioxidant responses and reactive oxygen species generation in different body regions of the estuarine polychaeta Laeonereis acuta (Nereididae). Chemosphere. 2007;66(7):1367–74.
13. Brady NR, Elmore SP, van Beek JJHGM, Krab K, Courtoy PJ, Hue L, et al. Coordinated behaviour of mitochondria in both space and time: a reactive oxygen species-activated wave of mitochondrial depolarization. Biophys J. 2004;87(3):2022–34.
14. Kristiansen KA, Jensen PK, Møller IM, Schulz A. Monitoring reactive oxygen species formation and localisation in living cells by use of the fluorescent
2009;136(4):369–83.
15. Van Winkle WJ. Ciliary activity and oxygen consumption of excised bivalve gill tissue. Comp Biochem Physiol A Mol Integr Physiol. 1972;42(2):473–85. 16. Ward JE. Biodynamics of supension-feeding in adult bivalve molluscs:
particle capture, processing, and fate. Invertebr Biol. 1996;115(3):218–31. 17. Jørgensen C. Bivalve filter feeding revisited. Mar Ecol Prog Ser.
1996;142:287–302.
18. Hodgson AN, Fielden LJ. The structure and distribution of peripheral ciliated receptors in the bivalve molluscs Donax serra and D sordidus. J Molluscan Stud. 1984;50:104–12.
19. Beninger PG, Dufour SC. Evolutionary trajectories of a redundant feature: lessons from bivalve gill abfrontal cilia and mucocyte distributions. In: Harper EM, Taylor JD, Crame JA, editors. The Evolutionary Biology of the Bivalvia. London: Special Publication 177. Geological Society; 2000. 20. Riisgård HU, Larsen PS, Nielsen NF. Particle capture in the mussel Mytilus
edulis:the role of latero-frontal cirri. Mar Biol. 1996;127:259–66. 21. Beninger PG, St-Jean S, Poussart Y, Ward JE. Gill function and mucocyte
distribution in Placopecten magellanicus and Mytilus edulis (Mollusca: Bivalvia): the role of mucus in particle transport. Mar Ecol Prog Ser. 1993;98:275–82.
22. Beninger PG, Lynn JW, Dietz TH, Silverman H. Mucociliary transport in living tissue: the two-layer model confirmed in the mussel Mytilus edulis L. Biol Bull. 1997;193:4–7.
23. Gómez-Mendikute A, Elizondo M, Venier P, Cajaraville MP. Characterization of mussel gill cells in vivo and in vitro. Cell Tissue Res. 2005;321(1):131–40. 24. Bickmeyer U. The alkaloid Ageladine A, originally isolated from marine
sponges, used for pH-sensitive imaging of transparent marine animals. Marine Drugs. 2012;10(1):223–33.
25. Rivera-Ingraham GA, Bickmeyer U, Abele D. The physiological response of the marine platyhelminth Macrostomum lignano to different environmental oxygen concentrations. J Exp Biol. 2013;216:2741–51.
26. Kratzing JE. Regional variation in respiratory epithelium of the nasal cavity of the bandicoot (Isoodon macrourus). J Anat. 1982;134:1–9.
27. Duncan JR, Ramsey FK. Fine structural changes in the porcine nasal ciliated epithelial cell produced by Bordetella bronchiseptica rhinitis. Am J Pathol. 1965;47(4):601–12.
28. Domouhtsidou GP, Dimitriadis VK. Lysosomal, tissue and cellular alterations in the gills, palps and intenstine of the mussel Mytilus galloprovincialis, in relation to pollution. Mar Biol. 2004;145:109–20.
29. Kádár E, Lowe DM, Solé M, Fisher AS, Jha AN, Readman JW, et al. Uptake and biological responses to nano-Fe versus soluble FeCl3in excised mussel
gills. Anal Bioanal Chem. 2010;396(2):657–66.
30. Kasuya K, Miyoshi M. Fine structure of cilia and basal bodies, with reference to the mouse trachea. Medical Bulletin of Fukuoka University. 2001;28(1):29–36.
31. Di Lisa F, Blank P, Colonna R, Gambassi G, Silverman H, Stern M, et al. Mitochondrial membrane potential in single living adult rat cardiac myocytes exposed to anoxia or metabolic inhibition. J Physiol. 1995;486(Pt 1):1–13.
32. Smiley ST, Reers M, Mottola-Hartshorn C, Lin M, Chen A, Smith TW, et al. Intracellular heterogeneity in mitochondrial membrane potentials revealed by a J-aggregate-forming lipophilic cation JC-1. Proc Natl Acad Sci U S A. 1991;88:3671–5.
33. Collins TJ, Berridge MJ, Lipp P, Bootman MD. Mitochondria are morphologically and functionally heterogeneous within cells. The EMBO Journal. 2002;21(7):1616–27.
34. Reers M, Smiley ST, Mottola-Hartshorn C, Chen A, Lin M, Chen LB. Mitochondrial membrane potential monitored by JC-1 dye. Methods Enzymol. 1995;260:406–17.
35. Skulachev VP. Mitochondrial filaments and clusters as intracellular power-transmitting cables. Trends Biochem Sci. 2001;26(1):23–9.
36. Brown GC. Nitric oxide and mitochondrial respiration. Biochim Biophys Acta. 1999;1411:351–69.
37. Buchwalow IB, Podzuweit T, Bocker W, Samoilova VE, Thomas S, Wellner M, et al. Vascular smooth muscle and nitric oxide synthase. FASEB J. 2002;16:500–8.
38. Marechal G, Gailly P. Effects of nitric oxide on the contraction of skeletal muscle. Cell Mol Life Sci. 1999;55:1088–120.
39. Reid MB. Role of nitric oxide in skeletal muscle: synthesis, distribution and functional importance. Acta Physiol Scand. 1998;162(3):401–9.
40. Brady AJB, Warren JB, Poole-Wilson PA, Williams TJ, Harding SE. Nitric oxide attenuates cardiac myocyte contraction. Am J Physiol. 1993;265:H176–82. 41. Schipp R, Gabauer M. Nitric oxide: a vasodilatadory mediator in cephalic
aorta of Sepia officinalis (L.) (Cephalopoda). Invertebr Neurosci. 1999;4:9–15. 42. Fang FC. Mechanisms of nitric oxide-related antimicrobial activity. J Clin
Investig. 1997;99(12):2818–25.
43. Palumbo A. Nitric oxide in marine invertebrates: a comparative perspective. Comp Biochem Physiol A Mol Integr Physiol. 2005;142:241–8.
44. Stefano GB, Ottaviani E. The biochemical substrate of nitric oxide signaling is present in primitive non-cognitive organisms. Brain Res. 2002;924:82–9.
45. Rivera-Ingraham GA, Rocchetta I, Meyer S, Abele D. Oxygen radical formation in anoxic transgression and hypoxia-reoxygenation: foe or phantom? Experiments with an anoxia tolerant bivalve. Mar Environ Res. 2013;92:110–9.
46. Abele-Oeschger D, Oeschger R. Hypoxia induced autoxidation of haemoglobin in the benthic invertebrates Arenicola marina (Polychaeta) and Astarte borealis (Bivalvia): possible effect of hydrogen sulphide. J Exp Mar Biol Ecol. 1995;187:63–80.
47. Nakamura M, Mori K, Inooka S, Nomura T. In vitro production of hydrogen peroxide by the amoebocytes of the scallop, Patinopecten yessoensis (Jay). Dev Comp Immunol. 1985;9:407–17.
48. Le Gall G, Bachère E, Mialhe E. Chemiluminiscence analysis of the activity of Pecten maximus hemocytes stimulated with Zymosan and host-specific Rickettsiales-like organisms. Disease of Aquatic Organisms. 1991;11:181–6. 49. Larson KG, Roberson BS, Hetrick FM. Effect of environmental pollutants on
the chemiluminiscence of hemocytes from the American oyster Crassostrea virginica. Disease of Aquatic Organisms. 1989;6:131–6.
50. Bachère E, Hervio D, Mialhe E. Luminol-dependent chemiluminiscence by hemocytes of two marine bivalves, Ostrea edulis and Crassostrea gigas. Disease of Aquatic Organisms. 1991;11:173–80.
51. Pipe RK. Generation of reactive oxygen metabolites by the haemocytes of the mussel Mytilus edulis. Dev Comp Immunol. 1992;16:111–22. 52. Winston GW, Moore MN, Kirchin MA, Soverchia C. Production of reactive
oxygen species by hemocytes from the marine mussel, Mytilus edulis: lysosomal localization and effect of xenobiotics. Comp Biochem Physiol C Toxicol Pharmacol. 1996;113(2):221–9.
53. Kalyanaraman B, Darley-Usmar VM, Davies KJA, Dennery PA, Forman HJ, Grisham MB, et al. Measuring reactive oxygen and nitrogen species with fluorescent probes: challenges and limitations. Free Radic Biol Med. 2012;52(1):1–6.
54. Prakash P, Kumar GP, Laloraya M, Hemnani T, Parihar MS. Superoxide anion radical generation as a temperature stress response in the gills of freshwater catfish Heteropneustes fossilis: role in mucus exudation under elevated temperature. Comp Biochem Physiol C. 1998;119(2):211–6. 55. Segal AW. The function of the NADPH oxidase of phagocytes and its
relationship to other NOXs in plants, invertebrates, and mammals. Int J Cell Biol. 2008;40(4–3):604–18.
56. Proctor P, Kirkpatrick D, Mc-Ginnes J. A superoxide-producing system in the conjuctival mucus thread. Investig Ophthalmol Vis Sci. 1977;16(8):762–5. 57. Teshima S, Rokutan K, Nikawa T, Kishi K. Guinea pig gastric mucosal cells
produce abundant superoxide anion through an NADPH oxidase-like system. Gastroenterology. 1998;115(5):1186–96.
58. Strahl J, Abele D. Cell turnover in tissues of the long-lived ocean quahog Arctica islandica and the short-lived scallop Aequipecten opercularis. Mar Biol. 2010;157:1283–92.
59. Bickmeyer U, Grube A, Klings K-W, Köck M. Ageladine A, a pyrrole–imidazole alkaloid from marine sponges, is a pH sensitive membrane permeable dye. Biochem Biophys Res Commun. 2008;373(3):419–22. doi:10.1016/j. bbrc.2008.06.056. Corrigendum 2009, 383, 519.
60. Julian D, April KL, Patel S, Stein JR, Wohlgemuth S. Mitochondrial depolarization following hydrogen sulfide exposure in erythrocytes from a sulfide-tolerant marine invertebrate. J Exp Biol. 2005;208:4109–22. 61. Haberkorn H, Lambert C, Le Goïc N, Moal J, Suquet M, Guéguen M, et al.
Effects of Alexandrium minutum exposure on nutrition-related processes and reproductive output in oysters Crassostrea gigas. Harmful algae. 2010;9(5):427–39.
62. Donaghy L, Kraffe E, Le Goïc N, Lambert C, Volety AK, Soudant P. Reactive oxygen species in unstimulated hemocytes of the Pacific oyster Crassotrea gigas: a mitochondrial involvement. PLoS One. 2012;7(10), e46594. 63. Aebi H. Catalase in vitro. Methods Enzymol. 1984;105:121–6.
64. Livingstone DR, Lips F, Garcia Martinez P, Pipe RK. Antioxidant enzymes in the digestive gland of the common mussel Mytilus edulis. Mar Biol. 1992;112:265–76.
65. Bradford MM. A rapid and sensitive method for the quantitation of microgram quantities of protein utilizing the principle of protein-Dye binding. AnalBiochem. 1976;72:248–54.
• We accept pre-submission inquiries
• Our selector tool helps you to find the most relevant journal
• We provide round the clock customer support
• Convenient online submission
• Thorough peer review
• Inclusion in PubMed and all major indexing services
• Maximum visibility for your research Submit your manuscript at
www.biomedcentral.com/submit