HAL Id: hal-01188807
https://hal.archives-ouvertes.fr/hal-01188807
Submitted on 1 Sep 2015
HAL is a multi-disciplinary open access
archive for the deposit and dissemination of sci-entific research documents, whether they are pub-lished or not. The documents may come from teaching and research institutions in France or abroad, or from public or private research centers.
L’archive ouverte pluridisciplinaire HAL, est destinée au dépôt et à la diffusion de documents scientifiques de niveau recherche, publiés ou non, émanant des établissements d’enseignement et de recherche français ou étrangers, des laboratoires publics ou privés.
Affects Aerobic Capacities of the Golden Grey Mullet
Liza aurata in a Warming Seawater Context
Marie Vagner, Thomas Lacoue-Labarthe, Jose-Luis Zambonino-Infante, David
Mazurais, Emmanuel Dubillot, Hervé Le Delliou, Patrick Quazuguel, Christel
Lefrançois
To cite this version:
Marie Vagner, Thomas Lacoue-Labarthe, Jose-Luis Zambonino-Infante, David Mazurais, Emmanuel Dubillot, et al.. Depletion of Essential Fatty Acids in the Food Source Affects Aerobic Capacities of the Golden Grey Mullet Liza aurata in a Warming Seawater Context. PLoS ONE, Public Library of Science, 2015, 10 (6), pp.e0126489. �10.1371/journal.pone.0126489�. �hal-01188807�
Depletion of Essential Fatty Acids in the Food
Source Affects Aerobic Capacities of the
Golden Grey Mullet Liza aurata in a Warming
Seawater Context
Marie Vagner1☯*, Thomas Lacoue-Labarthe1☯, José-Luis Zambonino Infante2, David Mazurais2, Emmanuel Dubillot1, Hervé Le Delliou2, Patrick Quazuguel2, Christel Lefrançois1
1 UMR 7266 Littoral Environnement Sociétés, La Rochelle, France, 2 Ifremer, UMR 6539 Laboratoire des sciences de l’Environnement Marin, Plouzané, France
☯These authors contributed equally to this work. *marie.vagner@hotmail.fr
Abstract
The objective of this study was to evaluate the combined effects of thermal acclimation and n-3 highly unsaturated fatty acids (n-3 HUFA) content of the food source on the aerobic ca-pacities of fish in a thermal changing environment. The model used was the golden grey mulletLiza aurata, a species of high ecological importance in temperate coastal areas. For four months, fish were exposed to two food sources with contrasting n-3 HUFA contents (4.8% ecosapentaenoic acid EPA + docosahexaenoic acid DHA on the dry matter DM basisvs. 0.2% EPA+DHA on DM) combined with two acclimation temperatures (12°C vs. 20°C). The four experimental conditions were LH12, LH20, HH12 and HH20. Each group was then submitted to a thermal challenge consisting of successive exposures to five tem-peratures (9°C, 12°C, 16°C, 20°C, 24°C). At each temperature, the maximal and minimal metabolic rates, metabolic scope, and the maximum swimming speed were measured. Re-sults showed that the cost of maintenance of basal metabolic activities was particularly higher when n-3 HUFA food content was low. Moreover, fish exposed to high acclimation temperature combined with a low n-3 HUFA dietary level (LH20) exhibited a higher aerobic scope, as well as a greater expenditure of energy to reach the same maximum swimming speed as other groups. This suggested a reduction of the amount of energy available to per-form other physiological functions. This study is the first to show that the impact of lowering n-3 HUFA food content is exacerbated for fish previously acclimated to a warmer environ-ment. It raises the question of the consequences of longer and warmer summers that have already been recorded and are still expected in temperate areas, as well as the pertinence of the lowering n-3 HUFA availability in the food web expected with global change, as a fac-tor affecting marine organisms and communities.
OPEN ACCESS
Citation: Vagner M, Lacoue-Labarthe T, Zambonino Infante J-L, Mazurais D, Dubillot E, Le Delliou H, et al. (2015) Depletion of Essential Fatty Acids in the Food Source Affects Aerobic Capacities of the Golden Grey Mullet Liza aurata in a Warming Seawater Context. PLoS ONE 10(6): e0126489. doi:10.1371/journal.pone.0126489
Academic Editor: Daniel E Crocker, Sonoma State University, UNITED STATES
Received: December 19, 2014 Accepted: April 2, 2015 Published: June 1, 2015
Copyright: © 2015 Vagner et al. This is an open access article distributed under the terms of the
Creative Commons Attribution License, which permits unrestricted use, distribution, and reproduction in any medium, provided the original author and source are credited.
Data Availability Statement: All relevant data are within the paper and its Supporting Information files. Funding: This study was funded by the Contrat-Plan Etat-Région (regional and national financial support), as well as by the FEDER (European Research Funding) for the first author.
Competing Interests: The authors have declared that no competing interests exist.
Introduction
Thermal tolerance varies widely among species and has been shown to be dependent on the ac-climation temperature [1], as well as on the physiological plasticity of organisms [2]. In tem-perate latitudes, ectotherms often show a high physiological plasticity to thermal tolerance, which may greatly facilitate their adaptation to new environments and buffer the effects of daily or seasonal variations of environmental temperature on physiological processes [2].
When exposed to environmental temperature changes, ectotherms rapidly modulate the phospholipid composition of their cell membranes in terms of highly unsaturated fatty acids of the n-3 series (n-3 HUFA) in order to maintain their physiological performances [3,4]. This adjustment of the rate of n-3 HUFA in cell membrane determines the degree of unsaturation of the phospholipid and is necessary for maintaining membrane fluidity, and consequently the membrane functionality in a thermal changing environment [3]. For example, when the mem-brane fluidity tends to decrease at low temperatures, the degree of lipid unsaturation tends to increase to maintain its properties and functionality [5], and vice versa when the temperature increases [6]. These lipid adjustments in cell membranes can maintain the activity of trans-membrane proteins [7,8], and consequently are determinant for the maintenance of numerous physiological functions (for review see [9–11]). In marine fish, membranous n-3 HUFA are mainly represented by ecosapentaenoic acid (EPA, 20:5n-3) and docosahexaenoic acid (DHA, 22:6n-3; for reviews see [9,11]). These fatty acids have been shown to be essential for growth, survival, pigmentation, development and functionality of the brain, vision, and nervous system, as well as in resistance to stress and disease, as they are precursors of eicosanoids (for reviews see [9,11]).
Although they function as critical structural and physiological components of the cell mem-branes of most tissues [9], n-3 HUFA are weakly synthesised de novo by higher organisms, and must be brought by food. In the natural food web, they are mainly supplied by marine microal-gae, and especially by the dominating diatoms [12,13]. Several studies showed that n-3 HUFA present in the food source largely influenced swimming and metabolic performances that are essential to allow fish to migrate, feed, reproduce, or avoid predators [14–18]. However, these results are often conflicting, which may be related to the thermal environment of fish. For ex-ample, low levels of n-3 HUFA in the diet (replaced by a high rate of monounsaturated FA: oleic acid), and thus in cardiac tissue, led to higher swimming and cardiac performance of sea bass Dicentrarchus labrax acclimated to 20°C [16,17]. These authors suggested a more efficient oxidation of monounsaturated FAs when compared to polyunsaturated FAs in order to provide the necessary energy to the animal. A similar result was observed from a study performed at 9°C in Atlantic salmon [19,20]. However, a contrary result was measured in the same species tested at 10–12°C [18]. These different results for the same species could be due to the fact that the melting point of oleic acid is around 13°C, which would imply better membrane fluidity and thus modified physiological performance when the temperature is close to 13°C. These previous studies suggested some evidence of interactions between n-3 HUFA membrane con-tent and thermal history on the physiology of marine organisms. However, little is known about the relative importance and potential interacting effects between temperature and n-3 HUFA food content on fish performance.
This investigation is of particular importance given the actual and predicted ecological con-text in temperate coastal areas. It is now known that summers are warmer and longer in these areas, and that an increase of 3°C in ocean water is predicted for the end of this century [21]. In the area of the Pertuis Charentais, located at the Atlantic mid-coast of France, and renowned for shellfish production and fisheries, this warming would lead to fish experiencing increasing seasonal temperature variations from ~8–20°C [22], to ~11–23°C [21]. Moreover, over the last
twenty years, several studies have shown that modification of physicochemical parameters re-lated to global change (e.g. increasing temperature, pH; decreasing salinity and oxygen satura-tion) led to a decreasing n-3 HUFA profile in diatoms, as well as to a decrease of their biomass in favor of more-adapted species such as cyanobacteria [23–26] (for review see [27]). This would lead to a lowering n-3 HUFA availability at the base of the food web, which may propa-gate to higher trophic levels, because, in all animals, it is well known that the fatty acid (FA) composition of the tissue is a reflection of their diet [28]. This would then lead to variability in the membranous n-3 HUFA content of higher consumers, despite the fact that membrane lip-ids are regulated to a large extent. Consequently, this would induce changes in membrane structure and function of higher consumers, which have been shown to further impact individ-ual physiological performances.
In this context, the objective of this study was to evaluate the combined effect of thermal ac-climation and n-3 HUFA content in food source on the membrane composition of the skeletal muscle and their potential consequences on physiological performance of the golden grey mul-let, in terms of swimming and respiratory performances, in a thermal changing environment. The chosen species is of high ecological importance in the studied area as well as in European coastal areas because it is a microalgae grazer and a trophic vector of organic matter from inter-tidal to subinter-tidal areas [29,30]. Because of its diet, the mullet may be directly subject to the vari-ability of n-3 HUFA availvari-ability in primary producers, as no intermediate trophic steps will buffer their biochemical variability.
Materials and Methods
To reach this objective, fish were exposed during four months to two contrasting n-3 HUFA di-etary contents combined with two acclimation temperatures representative of mean winter and summer temperatures in the Pertuis Charentais. Then, fish were submitted to a thermal chal-lenge consisting of successive exposures to five temperatures covering both seasonal changes of water temperature and the temperatures expected during the last of the century in the studied area [21,22]. At each temperature and for each fish, minimal and maximal oxygen consump-tion (MO2minand MO2maxrespectively), maximum swimming speed Umax, and ventilation
rate fvwere measured.
Ethics statement
All fish manipulations were performed according to the Animal Care Committee of France (ACCF). No specific permissions were required from departmental service of fisheries to collect mullets Liza aurata in their natural environment, as this is not a protected or endangered spe-cies, and as few fish were collected (n = 160 individuals) regarding their abundance in this fish-ing area. The protocol was approved by the ACCF (approval number: 17-300-2). All fish manipulations were performed under anesthesia (tricaine methane sulphonate MS-222; 0.1 g L-1, Sigma-Aldrich, St Quentin-Fallavier, France), and all efforts were made to minimize
suffering.
Fish maintenance
Juvenile golden grey mullets [initial mean weight ± standard error (SE): 6.1 ± 0.2 g; initial mean standard length ± SE: 7.0 ± 0.1 cm] were caught in marine coastal area of La Rochelle (France) in 2012 and transported in aerated tank to our laboratory (Institut du Littoral et de l’Environnement, UMR 7266 CNRS-Université de La Rochelle, France) where all experiments were conducted. Upon arrival, the fish were transferred into four indoor tanks (volume: 400 L; n = 40 fish per tank) that were individually supplied with aerated recirculated sand-filtered
natural seawater and equipped with an external biological filter (Eheim professional 3 2080, Eheim, Deizisau, Germany). They were progressively acclimated to the water tank temperature, which was kept constant by a recirculating water system (TECO TR20, Conselice, Italy), and maintained in a temperature-controlled room (20°C) exposed to a 12L:12D photoperiod cycle. Temperature (18.7 ± 0.04°C), salinity (29.3 ± 0.5) and oxygen (87.9 ± 2.6% air saturation) were monitored daily using a conductimeter (WTW model Oxi 340i, Weildeim, Germany). After a few days of acclimation to the experimental structure, each of the four initial tanks was separat-ed in two tanks (n = 8 tanks in total with n = 20 fish per tank), and water temperature was pro-gressively modified until 12°C (12.5 ± 0.1°C; n = 4 tanks), or 20°C (19.8 ± 0.1°C; n = 4 tanks). Fish were fed with a commercial diet (Le Gouessant aquaculture, Lamballe, France) once a day for three weeks.
Then, fish were progressively fed with two experimental isolipidic and isoproteic diets con-trasting by their n-3 HUFA content, and made at the Ifremer-PFOM unit, UMR 6539 LEMAR (Plouzané, France): A high HUFA diet (HH: 4.8% EPA + DHA on dry matter basis), and a low-n-3 HUFA diet (LH: 0.2% EPA + DHA on dry matter basis DMB) which was obtained by replacing the fish oil present in the HH diet by soybean oil. For each of these two diets, 2 tanks per experimental temperature were fed for four months (2% of biomass day-1). Thus, the four
experimental conditions were reared in duplicate and called HH20, LH20, HH12 and LH12. The diets were formulated taking a standard diet as a reference (1.2% EPA+DHA on DMB) that was previously formulated [15] according to the needs of other species, as the needs of L. aurata are not well known. The composition and FA content of the two experimental HH and LH diets are summarized inS1 Table.
Lipid analysis
At the beginning of the experiment (T0), lipid analysis was performed on the muscle of 10 ran-domly sampled fish. After the four month experimental period, lipid analysis was performed on the muscle of 13 individuals randomly sampled for each experimental condition.
For each fish, whole frozen muscle was homogenized rapidly with a Hobart mixer in order to maintain a low temperature and then more accurately using a Polytron (PT 2100 Bioblock, Illkirch, France). A representative portion (~ 5g) was taken for lipid analysis and ~ 3g was taken for dry weight measurements (105°C in an oven for 24h). Lipid analysis was conducted on duplicates. Extraction of total lipids was performed automatically (Accelerated Solvent Ex-tractor 350 Dionex, Fisher Scientific, Illkirch, France) according to the Folch method [31], with chloroform being replaced by dichloro-methane. The separation of neutral NL and polar lipids PL was performed on fish samples according to the procedure described by Juaneda and Roquelin [32]. The total lipids TL extracts were fractionated on silica cartridges (Chromabond SiOH, Macherey-Nagel, Hoerdt, France), NL were eluted by chloroform and PL by methanol. Fatty acid methyl esters (FAME) of TL, NL and PL were prepared by saponification and then methylation. All FAMEs were separated by gas chromatography (GC Clarus 500 Perkin-Elmer, Villebon-sur-Yvette, France) with a flame ionisation detector, BPX 70 capillary column: 25 m x 0.22 mm i.d. x 0.25μm film thickness; split-splitless injector, with helium as a carrier gas. The injector and detector temperatures were 220 and 260°C, respectively. The temperature of the oven was initially 50°C, and then increased to 180°C in increments of 15°C min-1; here, it was
maintained for 5 min, and then finally increased to 220°C in increments of 3°C min-1. Data ac-quisition and handling were carried out by connecting the GC to a computer equipped with the TotalChrom workstation (Perkin-Elmer, Villebon-sur-Yvette, France). Individual FAMEs were identified by comparing the retention times of authentic standard mixtures. The results of individual FA composition were expressed as a percent of total identified FAME.
Chemical analyses of feed were performed in duplicate for each sample according to AOAC (Association of Official Analytical Chemists 1984) methods: ash (7 h at 550°C), crude fat [31], and crude protein (Dumas method with an Elementary NA 20001
, N × 6.25). FAME were ex-tracted and analyzed on total lipid fraction using the previously described method.
Growth performance
Just before being exposed to the two experimental LH and HH diets (T0), all 24h-starved fish were anaesthetized (MS-222; 0.1 g L-1, Sigma-Aldrich, St Quentin-Fallavier, France), weighed,
and pit-tagged (MS-120; biolog-id, Réseaumatique, Bernay, France). Then, each month, 24h-starved fish (n = 40 per experimental condition) were anesthetized (MS-222; 0.1 g L-1,
Sigma-Aldrich, St Quentin-Fallavier, France) and individually identified using a pit-tag reader (MS-120, biolog-id, Réseaumatique, Bernay, France) before measuring fresh weight (± 0.1 g), total length, standard length (i.e. notochord length), height and width (± 0.01 cm).
The specific growth rate SGR (% day-1) was calculated for each experimental condition
usingEq 1:
SGR ¼ 100ðLnfinal body weightNumberof days# Lninitial body weightÞ ð1Þ
The Fulton index (FI) representative of body condition was determined usingEq 2[33]:
FI ¼ 100WL3 ð2Þ
where W is the fish weight in g and L the total fish length in cm.
Thermal challenge
Experimental set-up. Fish metabolic and swimming performances were assessed during a thermal challenge using a swim-tunnel respirometer (Loligo Systems, Tjele, Denmark), which was made of a respirometer and an external bath. The respirometer (volume: 10 L) was com-posed of (i) a swim chamber with a square working section (40 cm of length, 10 cm height, 10 cm of width) and (ii) a hydraulic system placed upstream to promote a laminar flow in the swim chamber. No correction for solid blocking effects of the fish in the working section was made, since the calculated fractional error was < 5% of the working section area [34]. The flow in the respirometer was generated by an electric motor with a propeller. It was calibrated before the start of experiments and the speed ranged between 0 and 150 cm s-1. Temperature was kept
constant by a recirculating water system from the external bath (Teco TR20, Conselice, Italy). A flush pump allowed water exchange between the respirometer and the external bath, in which water temperature and oxygenation were controlled.
Oxygen consumption measurements. Oxygen concentration in the respirometer was continuously measured during the experiments with an oxygen probe (PreSens, GmbH, Re-gensburg, Germany) connected to an oxymeter (Oxy-4, PreSens, GmbH, ReRe-gensburg, Ger-many) transferring oxygen data every 10 s to a storage computer. The oxygen concentration was automatically adjusted according to the real-time temperature recorded in the respirome-ter. Oxygen consumption (MO2) was measured by intermittent-flow respirometry, based on
an alternation between (i) a flushing phase (5 min) and (ii) a measuring phase (20 min), during which the flush pump was turned off, preventing the inflow of water from the external bath
into the respirometer. The MO2(mgO2kg-1h-1) was calculated as in [15,35] (Eq 3): MO2meas:¼ D½O2& Dt ! " ' mV ! " ð3Þ
where Δ[O2] is the oxygen concentration decrease (mgO2L-1) relative to the fish oxygen
con-sumption with respect to time Δt (hours), V the swim tunnel water volume (10 L) minus the volume of the fish, and m the fish weight (kg).
For each MO2measurement, a linear regression was adjusted (Graphical Analysis 3.4,
Bea-verton, OR, USA) in order to determine Δ[O2]/Δt from the graph plotting [O2] versus time.
The regression coefficient of the linear relationship determined MO2measurement accuracy.
The bacterial MO2was measured for half an hour before and after each experiment and at each
temperature, and the mean was subtracted from the MO2measured.
As respiratory metabolism depends on the animal weight, MO2was standardized for a 100
g fish [35] (Eq 4): MO2cor:¼ MO2meas:' mmeas mcor ! " 1#A ð4Þ
where MO2cor(mgO2kg-1h-1) is the oxygen consumption for a corrected weight (mcor= 100
g), MO2measis the measured MO2(mgO2kg-1h-1) and mmeasis the fish weight (kg). A is the
al-lometric exponent describing the relation between the metabolic rate and the fish weight. The A value has never been determined for Liza aurata. Therefore, we used a value of 0.8 which was previously estimated in teleosts [36], and already employed for L. aurata [15].
Experimental protocol of the thermal challenge. The experimental protocol used is pre-sented inFig 1.
Next, 96h-starved fish [HH20 group: mean weight ± SE: 39.6 ± 2.3 g; mean standard length ± SE: 13.3 ± 0.2 cm, n = 11; LH20 group: mean weight ± SE: 40.2± 2.2 g; mean standard length ± SE: 13.3 ± 0.2 cm; n = 11; HH12 group: mean weight ± SE: 14.9 ± 1.1 g; mean stan-dard length ± SE: 9.5 ± 0.3 cm, n = 11; LH12 group: mean weight ± SE: 14.9 ± 1.4 g; mean
Fig 1. Diagram of the experimental protocol used for the thermal challenge. This diagram presents the evolution of swimming speed with time at one of the challenge temperature tested (i.e. 9°C, 12°C, 16°C, 20°C or 24°C). The different measures recorded for each fish and at each temperature are indicated in italic. MO2min: minimum oxygen consumption; MO2max: maximum oxygen consumption; Umax: maximum swimming speed; fv: ventilation rate after the
MO2maxchallenge; EPOC: the excess post-oxygen consumption recorded during the recovery period following the swim challenge. The same protocol was
repeated until each fish had been exposed to all challenge temperatures; one hour-acclimation to each new experimental challenge temperature was respected.
standard length ± SE: 9.4 ± 0.2 cm; n = 11] were randomly sampled in tanks using a net, and individually tested in the respirometer. This long starvation period ensured that swim-ming performance and oxygen consumption measurements were not influenced by digestion [37]. The day before the test, the fish were anesthetized (MS-222; 0.1 g L-1) and transferred into a plastic bag (without exposing the gills to the air, which may affect metabolism) from the indoor acclimatizing tank to the swim chamber of the swimming respirometer, in which the water temperature was similar to that of the rearing tank (i.e. 20°C or 12°C according to fish groups). After a short recovery period (about 5 min), the water flow was stabilized at a very low speed (0.5 Body Length BL s-1) and a screen darkening the upstream part of the swim
chamber was placed in order to motivate the fish to occupy upstream positions. The fish were allowed to recover at this low speed for the next 4-10h during which MO2was recorded to
de-termine MO2min[38]. The MO2minwas considered as the lowest MO2value recorded during
this period (Fig 1).
After this period, fish were submitted to an increasing swimming speed exercise to deter-mine MO2max(Fig 1). Swim tunnel was sealed from incoming oxygenated water from the
ex-ternal bath and MO2measurements started. Water speed was progressively increased (0.5 BL
min-1) until visual observation of the early stages of bursts and glide swimming suggesting that
the fish was approaching its maximum aerobic swimming speed. This step was maintained for 20 min during which water speed was lightly modulated to ensure that fish was maximally challenged without being pushed to the grid at the rear of the swim tunnel. The MO2maxwas
considered the steepest slope of water oxygen saturation vs. time obtained during a 5 min peri-od, and Umax(BL s-1) as the highest swimming speed reached during the test. Oxygen
satura-tion never fell below 75% of air saturasatura-tion during MO2measurements. At the end of the 20
min-swimming test, water speed was progressively decreased to 0.5 BL s-1and water of the res-pirometer was renewed through the flush pump reactivation during one minute, allowing the oxygen saturation to return over 85% of air saturation (Fig 1). Then, fish were allowed to recov-er for 50 min, during which MO2was recorded according to a cycle of 20 min of MO2
measur-ing and 5 min of recirculatmeasur-ing water, i.e. 2 MO2measurements were recorded (Fig 1). These
MO2measurements allowed the estimation of the excess post-exercise oxygen consumption
(EPOC) by integrating (Graphical Analysis vs. 3.4; Beaverton, OR, USA) the area between the post-test recovery MO2curve and the MO2min (0.5 BL s-1)measured before the swimming test
[46]. In addition, gill ventilation frequency (fv; beats min-1) was video-recorded (Handycam
DCR-HC23E, Sony) just after maximal swimming exercise. In order to get the highest ventila-tion rate, the first 15 s period was manually analyzed by counting opercula openings, by two ex-perimenters and in duplicate.
At the end of the recovery period, water temperature was progressively changed in order to measure MO2min, MO2max, EPOC, and fvat the five challenge temperatures: typically 9°C,
12°C, 16°C, 20°C and 24°C. Each new temperature was reached by increasing water tempera-ture at a rate of ~2°C h-1by regulating a heating system (Teco TR20, Conselice, Italy). Fish
were given 1h to adjust to this new temperature (Fig 1). Then, they were held for 4-10h at this new temperature, and the protocol described above was repeated (Fig 1). In order to avoid too high temperature variations, the order at which challenge temperatures were tested depended on the temperature at which the fish were previously acclimated: Fish acclimated at 12°C were successively challenged at 12°C, 9°C, 16°C, 20°C, and 24°C, while fish reared at 20°C were suc-cessively challenged at 20°C, 24°C, 16°C, 12°C, and 9°C.
The fish were then removed from the swim tunnel, anesthetized (MS-222; 0.1 g L-1, Sigma-Aldrich, St Quentin-Fallavier, France), electronically identified, weighed and measured before being replaced in the initial tank.
Data analyses
For each fish and at each temperature tested during the challenge, the aerobic scope AS and the net cost of transport at maximum exercise NCOT were calculated. AS (mgO2kg-1h-1) was
de-termined for each fish as MO2max—MO2minmeasured at the same temperature.
NCOT (mgO2kg-1m-1) was calculated according to Clark et al. [38]:
NCOT ¼ðMO2max# MO2minÞ
Umax
ð5Þ
Statistical analysis
The data are presented as mean ± standard error (SE). The effects of diet and acclimation tem-perature on SGR and lipid content in fish muscles were tested using a two-way ANOVA with n = the number of fish replicates for each dietary condition Statistica software vs.7 (StatSoft, Maison-Alfort, France). Prior to ANOVA analyses, normality distribution and homeodasticity were controlled using Kolmogorov-Smirnov and the Levene test, respectively (Statistica soft-ware vs.7; StatSoft, Maison-Alfort, France). The effects of acclimation temperature, food (con-sidered as a categorical covariate), challenge temperature (fixed effect), and factor interactions on ecophysiological variables (i.e. MO2max, MO2min, AS, Umax, NCOT, EPOC and fv max) have
been tested by applying multiple linear mixed effects models, where individual fish electronic identity has been considered a random factor. When covariate interactions were not signifi-cant, a simpler model was selected according to the Akaike Interaction Criterion (AIC). All models were computed using the lme fitting routine in R freeware (lme4 package; R Core Team, 2013). The level of significance for statistical analyses was always set at α = 0.05.
Results
All groups of fish appeared healthy and survival rate was close to 100% at the end of the experiment.
Fatty acid composition in fish
The initial and final FA compositions of fish are presented inS2andS3Tables, respectively. As expected, final fish FA composition reflected that of their diet, and EPA (20:5n-3) and DHA (22:6n-3) were preferentially incorporated in PL than in NL for all fish groups (one-way ANOVA: EPA: F1, 98= 159.6; P < 0.001; DHA: F1, 98= 70.2; P < 0.001).
Regarding the initial fish composition, and as expected, the HH diet induced an increase in n-3 HUFA and S n-3 FA (in particular: 20:3n-3, 20:4n-3, 22:5n-3, and 22:6n-3 FA) in fish PL, while the LH diet induced a depletion in these FA contents, but an increase in n-6 FA instead. In both lipid classes (PL and NL), S SFA, 22:6n-3 FA, S n-3 and S n-3 HUFA were higher in HH than in LH fish. EPA and the ratio n-3/n-6 FA contents were significantly affected by an interaction between acclimation temperature and diet, and EPA was less incorporated in PL and NL of LH20 fish. Concerning NL, 14:0, 16:0, 16:1, S MUFA, 18:2n-6, and S n-6 FA were significantly higher in HH fish, except for S n-6 and 18:2n-6, which were higher in LH fish. In PL, only 18:3n-3 was significantly affected by diet and was higher in LH than in HH fish.
FA integration in fish tissue also largely depends on acclimation temperature (S3 Table). In NL class, the 18:0 FA, S SFA, and the ratio DHA/EPA contents in fish were higher in fish reared at 12°C, while in PL class they were more efficiently incorporated in fish reared at 20°C. However, the opposite trend was observed for 14:0 FA. Concerning NL, 16:0, 18:2n-6, S n-6,
22:6n-3, S n-3 and S HUFA n-3 were preferentially incorporated in 12°C-acclimated than in 20°C-acclimated fish, except for the 16:0 FA, for which the contrary was observed. Concerning PL, the 20:0 FA, 16:1 FA, 18:3n-3 FA contents were higher in fish acclimated at 20°C than in those acclimated at 12°C.
Finally, an interactive effect of diet and acclimation temperature was observed for 18:3n-3 in NL, as for 18:2n-6 and S n-6 in PL class.
Growth performances and body condition
As expected, the SGR and FI were significantly higher for fish reared at 20°C (Fig2Aand2B). However, they were not affected by either the food, or by the interaction between food and ac-climation temperature (P > 0.05).
Fig 2. Combined effect of acclimation temperature and n-3 HUFA dietary content on growth
performances. Specific growth rate SGR during the four months experimental period (% day-1; Fig A; LH12:
n = 17; HH12: n = 37; LH20: n = 20; HH20: n = 34), and condition factor (Fulton Index FI) at the end of the experiment for fish which performed the thermal challenge (Fig B; n = 11 for each experimental fish group) for each experimental condition: high n-3 HUFA fed fish reared at 12°C (HH12) or 20°C (HH20), and low n-3 HUFA fed fish reared at 12°C (LH12) or 20°C (LH20). Bars with different letters are significantly different: for SGR: two-way ANOVA: effect of temperature:F1,103= 1328.46;P < 0.001; effect of food: F1,103= 1.917;
P = 0.17; interaction food*temperature: F1,103= 1.00;P = 0.32. For FI: two-way ANOVA: effect of
temperature:F1,104= 4.4;P = 0.037; effect of food: F1,3104= 0.61;P = 0.44; interaction food*temperature: F 1,104= 3.8;P = 0.053).
Swimming performances, energetics, and ventilation rate
The statistical results relative to MO2max, MO2min, AS, Umax, NCOT, and fvare reported in
Table 1.
MO2minvaried similarly throughout the thermal challenge in all experimental fish groups: it
decreased slightly from 9°C to 12°C, and was minimal at this temperature, and then increased until 24°C (Table 1;Fig 3A). However, regardless of the challenge temperature or the acclima-tion temperature, MO2minwas 20% lower for the HH fish than for LH. It was also almost 30%
higher for the 12°C-conditioned fish than for the 20°C-conditioned fish in both dietary groups (Fig 3A).
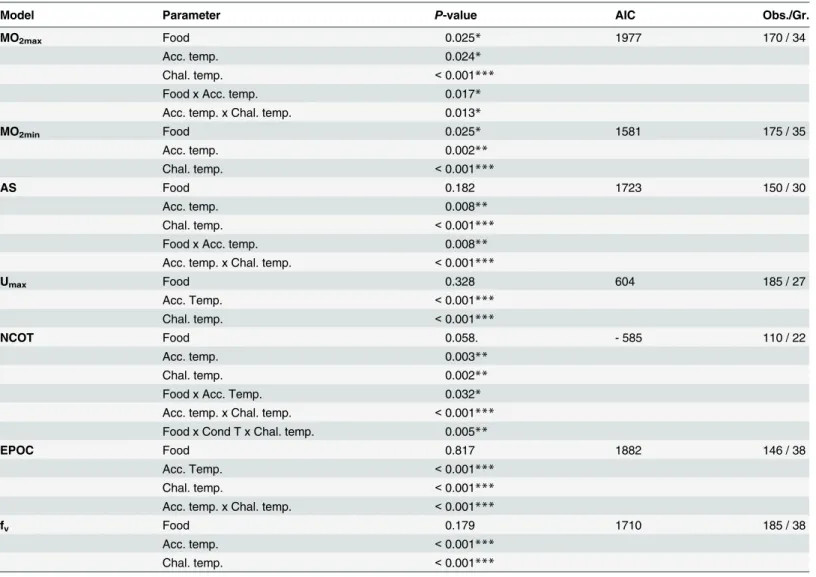
Table 1. Statistical effects of the environmental parameters tested onLiza aurata physiological performances.
Model Parameter P-value AIC Obs./Gr.
MO2max Food 0.025* 1977 170 / 34
Acc. temp. 0.024*
Chal. temp. <0.001***
Food x Acc. temp. 0.017*
Acc. temp. x Chal. temp. 0.013*
MO2min Food 0.025* 1581 175 / 35 Acc. temp. 0.002** Chal. temp. <0.001*** AS Food 0.182 1723 150 / 30 Acc. temp. 0.008** Chal. temp. <0.001*** Food x Acc. temp. 0.008** Acc. temp. x Chal. temp. <0.001***
Umax Food 0.328 604 185 / 27 Acc. Temp. <0.001*** Chal. temp. <0.001*** NCOT Food 0.058. - 585 110 / 22 Acc. temp. 0.003** Chal. temp. 0.002**
Food x Acc. Temp. 0.032*
Acc. temp. x Chal. temp. <0.001*** Food x Cond T x Chal. temp. 0.005**
EPOC Food 0.817 1882 146 / 38
Acc. Temp. <0.001***
Chal. temp. <0.001*** Acc. temp. x Chal. temp. <0.001***
fv Food 0.179 1710 185 / 38
Acc. temp. <0.001***
Chal. temp. <0.001***
Parameters of linear mixed effect models applied to the maximal oxygen consumption MO2max, the minimal oxygen consumption MO2min, the aerobic
scope AS, the maximal swimming speed Umax, the net cost of transport NCOT, the excess post-exercise oxygen consumption EPOC and the ventilation
rate after swimming effort fvas a function of the challenge temperature. Only significant interactions between factors tested are reported in this Table.
Abbreviations: Acc. temp.: acclimation temperature; AIC: Akaike Interaction Criterion; Chal. temp.: challenge temperature; Gr.: number of fish; Obs.: number of observations.
Fig 3. Combined effect of acclimation temperature and n-3 HUFA dietary content on aerobic metabolism. (A) Minimal (MO2 min) and (B) maximal oxygen consumption rate (MO2 max) and (C) aerobic
scope of fish acclimated at 20°C (dark symbols) and 12°C (light symbols) and fed with enriched (triangle; HH) or depleted (circle symbol; LH) n-3 HUFA regime as a function of the challenge temperature over a range from 9°C to 24°C. Regression lines are described by polynomial models of equation: AxChalTemp2
+ BxChalTemp + C, where ChalTemp is the challenge temperature tested. Statistical results are reported in
Table 1.
MO2maxwas significantly affected by an interactive effect between acclimation temperature
and challenge temperature (Table 1;Fig 3B). Fish acclimated at 20°C showed an increasing MO2maxall along the challenge but did not reach their maximal rate within the tested range of
challenge temperatures. Among them, the LH20 fish displayed a higher increase of MO2max
with challenge temperature than the HH20 (Table 1), reaching an MO2maxvalue 30% higher
than them at 24°C. Among the fish conditioned at 12°C, the LH12 displayed its highest MO2max
at 20°C (232.1 ± 33.3 mg O2kg-1h-1), while the HH12 fish displayed a slight but continuous
in-crease of MO2maxwith challenge temperature. These fish displayed their highest MO2below
10°C (Fig 3), but their MO2maxvalues did not exceed those of the HH20 fish at 24°C.
As for MO2max, AS was significantly affected by an interactive effect between acclimation
and challenge temperature, as well as by an interactive effect between acclimation temperature and diet (Table 1;Fig 3C). Globally, AS of the LH12 fish increased from 9°C to 17.7°C (until 215.0 ± 30.0 mg O2kg-1h-1), while LH20 fish tented to reach a maximum at 24°C (290.4 ± 44.7
mg O2kg-1h-1). In contrast, HH12 and HH20 fish kept increasing their maximum AS when
exposed to successive challenge temperatures (236.2 ± 24.8 mg O2kg-1h-1and 268.6 ± 25.1 mg
O2kg-1h-1at 24°C respectively).
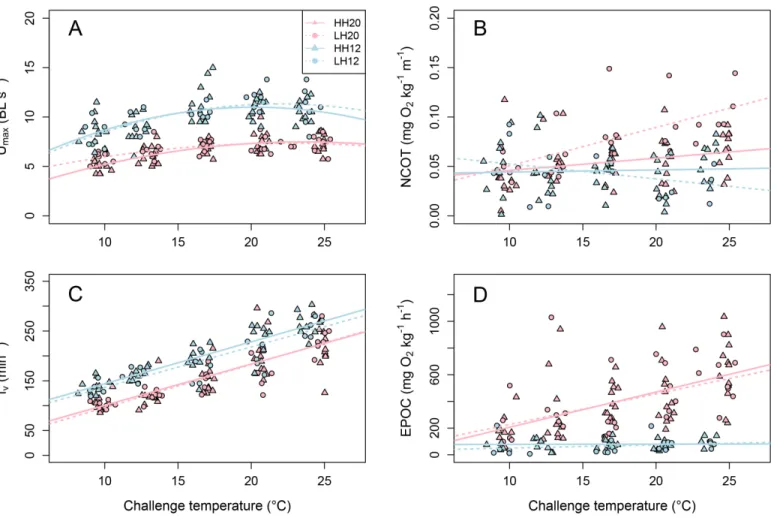
Umaxwas significantly affected by acclimation temperature but not by diet (Table 1;Fig 4A).
Regardless of the challenge temperature, Umaxwas about 40% higher in 12°C-acclimated fish
than in 20°C-acclimated group. Moreover, Umaxvaried similarly all along the thermal challenge
at both acclimation temperatures, increasing when challenge temperature increased from 9°C to 20°C, and remaining stable when challenge temperature increased from 20°C to 24°C: Umax
varied from 5.4 ± 0.2 at 9°C to 7.4 ± 0.2 BL s-1at 24°C and from 8.6 ± 0.3 at 9°C to 10.8 ± 0.3 at 24°C BL s-1for 20°C- and 12°C-acclimated fish, respectively.
The NCOT was stable throughout the challenge concerning 12°C-acclimated fish (from 0.05 ± 0.01 mg O2kg-1m-1at 9°C to 0.05 ± 0.01 mg O2kg-1m-1at 24°C;Table 1;Fig 4B).
How-ever, concerning 20°C-acclimated fish, NCOT progressively increased throughout the thermal challenge, and became progressively significantly higher in LH than in HH fish. This difference between dietary fish groups varied from 10% at 12°C, to 30% at 24°C.
As expected, the fvsignificantly increased with challenge temperature in all fish groups, due
to the increasing metabolic demand, as shown by the global MO2maxincrease with challenge
temperature, combined to the decreasing oxygen availability and blood oxygen affinity with in-creasing temperature [39,40] (Table 1;Fig 4C). The fvwas not affected by diet, but was 10% to
26% higher for the 12°C-acclimated fish than for the 20°C-acclimated fish throughout the ther-mal challenge (Table 1;Fig 4C).
Excess post-exercise oxygen consumption (EPOC)
The EPOC was not affected by diet, and was almost stable throughout the thermal challenge concerning the 12°C-acclimated fish, ranging from 63.7 ± 39.2 and 89.5 ± 28.7 mg O2kg-1h-1
at 9°C, to 82.2 ± 10.5 and 106.1 ± 24.4 mg O2kg-1h-1at 24°C for the LH and the HH fish,
re-spectively (Table 1;Fig 4D). However, it significantly increased with the challenge temperature in the 20°C-acclimated fish, and was from two- to six-fold higher than in the 12°C-acclimated fish from 9°C to 24°C.
Discussion
To the best of our knowledge, the present study is the first to highlight the combined effects of n-3 HUFA content in the food source and acclimation temperature on the swimming and met-abolic performances of Liza aurata in a thermal changing environment. While several studies reported the effects of n-3 HUFA on fish performance, this work revealed that these effects on
fish aerobic capacities are highly dependent on acclimation temperature. These results are of particular interest in the context of fish response to the natural or induced spatio-temporal var-iations of temperature and HUFA availability occurring in coastal areas.
This study aimed to use highly contrasting diets in terms of n-3 HUFA content, in order to observe highly contrasted physiological responses of fish. The n-3 HUFA content of the LH diet (0.2% EPA+DHA on DM) was about 24-fold lower than that of the HH diet (4.8% EPA +DHA on DM). Compared to the standard diet previously used for this species [15] and estab-lished from the needs known for other species (~1% EPA+DHA on DM), the LH diet was con-sidered deficient, while the HH diet was concon-sidered rich in n-3 HUFA. The immediate
consequence of feeding fish with both of these diets was the modification of the composition of the cell membrane bilayer in both LH and HH fish [41], [42], as (1) fish fed the LH diet pre-sented the lowest n-3 HUFA content, including EPA and DHA, and (2) both of these fatty acids were preferentially incorporated in PL rather than NL in both LH and HH fish, validating their integration in cell membranes [41].
Fig 4. Combined effect of acclimation temperature and n-3 HUFA dietary content on metabolic performances. (A) Maximal swimming speed (Umax),
(B) net cost of transport at maximum exercise (NCOT), (C) post-challenge ventilation rate (fv) and (D) excess post-exercise oxygen consumption (EPOC) of
fish acclimated at 20°C (dark points) and 12°C (light points) and fed with enriched (triangle symbol; HH) or depleted (circle symbol; LH) n-3 HUFA regime for four months as a function of the challenge temperature along a range from 9°C to 24°C. Regression lines for Umaxare described by polynomial models of the
equation: AxChalTemp2+ BxChalTemp + C, where ChalTemp is the challenge temperature tested. Statistical results are reported inTable 1.
First, clear differences in aerobic capacities have been highlighted with respect to the accli-mation temperature. Compared to 12°C-acclimated fish the 20°C-acclimated fish 1) spent much more energy (NCOT) to reach a lower swimming speed value (Umax) during effort and
2) showed a higher EPOC, revealing a higher oxygen debt during the recovery period following swimming effort. This higher EPOC indicates that the 20°C-acclimated fish relied more on an-aerobic metabolism during the swim challenge than the 12°C-acclimated fish [43–45]. This means that the ionic, osmotic and biochemical imbalances in metabolites such as lactate and glycogen [43] were associated with swimming effort, which induced a higher MO2to restore
tissue and cellular energy balance after the swim challenge. However, this higher EPOC was not correlated with a higher fvduring the recovery period [47–49], confirming that
20°C-accli-mated fish have a limited capacity to increase oxygen supply at the systemic level compared to 12°C-acclimated fish for which higher fvcombined with lower EPOC suggested a better
capaci-ty to recover from the test, regardless of the challenge temperature. This higher anaerobic me-tabolism utilization linked to a lower swimming performance may be partly explained by the lower number or diameter of oxidative fibers within the myotome, as observed following accli-mation to warm waters in mosquitofish [50], goldfish [51] or striped bass [52]. This reduced oxidative area would have then prevented swimming to be supported by aerobic muscular ac-tivity up to higher velocities, involving the recruitment of the fast anaerobic fibers.
Second, the basal metabolic cost of all fish groups increased when challenge temperature was above 15°C, implying that seawater warming may increase the cost of the maintenance of basal activities such as cardiac pump or osmoregulation for Liza aurata [53]. Moreover, for both acclimation temperatures tested, the LH fish displayed higher MO2minregardless of the
challenge temperature, suggesting that more energy is necessary to maintain vital functions when fish are exposed to deficient n-3 HUFA food sources. This is congruent with a previous result from McKenzie [14], who found that sturgeons and eels fed a rich n-3 HUFA diet had significantly lower basal metabolic rate than fish fed a depleted n-3 HUFA diet. These congru-ent results in differcongru-ent species indicate that dietary fatty acids can have very similar effects on metabolism in widely different taxonomic fish groups, irrespective of their thermal acclimation or temperature exposure.
The LH fish, when conditioned at 20°C (LH20), displayed a higher aerobic metabolism (showed by higher MO2maxand AS) than the other fish, supporting a higher capacity for
oxy-gen allocation towards energy-demanding activities such as swimming, foraging, growth and/ or digestion [53]. Nevertheless, these fish spent much more energy (higher NCOT) than HH20 to reach a similar maximum swimming speed (Umax), and this was even more
impor-tant as the challenge temperature increased. Taken together, these results imply that the sup-plementary oxygen quantity available for LH20 is much more rapidly consumed to perform the same level of activity as the HH20 fish. This revealed an altered yield between oxygen-con-sumption and muscular work caused by depleted n-3 HUFA supply. The higher energy spent by LH20 fish to swim at the same velocity may lead to less excess energy to perform other ergy-demanding activities. This is expected to be disadvantageous for mullets in a natural en-vironment, since they have to perform concomitantly several energy-consuming actions such as migration, foraging, or predator escape. In the long-term, this little excess energy could lead to a reduction of the specific growth rate, as the excess aerobic energy is expected to be allocat-ed to growth once other activities have been allocatallocat-ed [53]. Such a reduction in growth rate has not been observed in this study, based on 4 months of acclimation, but has been previously reported in the same species following 5-months of acclimation at 20°C with the LH diet [15]. It is noteworthy that, in our experimental conditions, the fish did not have to use their aerobic metabolism to forage (food provided in sufficient quantity) or to escape from predators. This implies that, in a natural environment where fish have to perform these other activities at the
same time as swimming, an alteration of energy metabolism due to n-3 HUFA deficiency could more rapidly impact on their ecophysiological performances such as growth. Longer ex-perimental work combined with fieldwork testing fish in their more restrictive natural envi-ronment would be valuable to validate this hypothesis and assess the time lapse for significant impact.
Thus, this study highlighted that LH fish displayed higher metabolic rates than HH fish, with higher MO2maxand AS when these LH fish were acclimated at 20°C than at 12°C. This
could be due to several mechanisms. First, EPA was the only FA content interactively affected by acclimation temperature and diet: it was less incorporated in the PL and NL when fish were acclimated at 20°C and fed the LH diet. Thus, the lipid composition seemed to have re-sponded to increasing temperature with a decreasing degree of unsaturation [6–8]. Moreover, high acclimation temperature reduced the content of 18:3n-3 FA in PL, an important EPA precursor, reducing the possibility of compensating for EPA decrease by de novo production. Consequently, the lower EPA incorporation measured in the LH20 fish could have modified membrane functionality, consequently impacting the physiological performances of fish. It is worth noting that, in addition, this lower EPA incorporation in LH20 fish could lead to an al-teration of their immune functions, as the EPA is a precursor of eicosanoids used to produce leukotrienes, thromboxanes and prostaglandins (for reviews see [12–14]). A second hypothe-sis would be a combined effect of low n-3 HUFA content in the food source and high accli-mation temperature on proton leak process, which is defined as an increasing mitochondrial MO2without increasing ATP production [54,55]. This MO2is controlled by inner membrane
permeability to protons. On one hand, the diet may have increased mitochondrial proton leak through a modification of permeability of the mitochondrial membranes. In mammals, n-3 HUFA deficiency in membrane has been previously shown to increase mitochondrial proton leak [56]. This theory may explain the higher MO2maxbut the similar Umaxreached
by the LH fish in comparison to the HH fish. On the other hand, proton leak may have been increased by warm-acclimation temperature [57]. Uncoupling proteins, capable of increasing proton leakage across the inner mitochondrial membrane and then reducing the aerobic ATP formation of cells, have been found in several fish species [57–60], and their level has been shown to be higher in warm-acclimated Antarctic eelpout Pachycara brachycephalum [57]. This suggested a lower ATP production combined to a higher MO2in these fish than in
cold-acclimated group. A third hypothesis could be the higher linoleic acid concentration in the LH diet, known to increase carnitine palmitoyl transferase activity, which may improve the aerobic metabolism of FAs in red muscle [61,62]. Previous works suggested that aerobic metabolism is primarily fuelled by FA oxidation, with MUFA being preferred over SFAs, which, in turn, are preferred over HUFA as substrates [61–63]. However, this last hypothesis is not supported by our results, as MUFA or SFA contents in the muscle of LH fish were lower than in HH fish.
This study brings a set of new clues showing that the impact of a trophic source depleted in n-3 HUFA is exacerbated for fish acclimated to a warmer environment, directly impacting sev-eral physiological functions that all depend on metabolic capacities, and in the long-term may reduce ecophysiological performance, such as growth. In a natural environment, these results raise the question of the ecological consequences of longer and warmer summers already re-corded and still expected in temperate areas [21]. Indeed, warmer events led to a decreasing n-3 HUFA profile in diatoms, as well as to a decrease of their biomass in favor of the development of poor-HUFA cyanobacteria (for review see [27]), exposing mullets to environmental condi-tions that could interactively challenge their metabolism. Beyond this seasonal aspect, where fish could respond through phenotypic plasticity or relocation, this work again underlines the
pertinence of the change of trophic source quality, especially within the context of the global warming, as a factor affecting living organisms and marine communities.
Supporting Information
S1 Table. Formulation and fatty acid composition in total lipids of the two experimental diets. Fatty acids for which the percentage was lower than 0.2% FAME are not represented. Each MUFA is represented as a sum of n-7, n-9 and n-11 FA.aSources: fish meal LT 94: Norse (Fyllingsdalen, Norway); casein: Sigma-Aldrich (Germany); soy oil: Système U (Créteil, France); fish oil: pure cod oil Cooper (Melun, France); precooked starch: Prégéflo Roquette frères (Lestrem, France); vitamin mixture (INRA Jouy-en-Josas, France).bVitamin mixture (g
kg-1vitamin mix): retinyl acetate, 1; cholecalciferol, 2 5; DL-α-tocopheryl acetate, 5; menadi-one, 1; thiamine-HCL, 0 1; riboflavin, 0 4; D-calcium panththenate, 2; pyridoxine-HCL, 0 3; cyanocobalamin, 1; niacin, 1; choline, 200; ascorbic acid (ascorbyl polyphosphate), 5; folic acid, 0 1; D-biotin, 1; meso-inositol, 30.cMineral mixture (g kg-1mineral mix): KCl, 90; KI, 0 04;
CaHPO42H2O, 500; NaCl, 40; CuSO45H2O, 3; ZnSO47H2O, 4; CoSO4, 0 02; FeSO47H2O, 20;
MnSO4H2O, 3; CaCo3, 215; MgOH, 124; Na2SeO3, 0 03; NaF, 1. Abbreviations: ARA:
arachi-donic acid; DHA docosahexaenoic acid; EPA: ecosapentaenoic acid; FA: fatty acids; HH: high n-3 HUFA diet; HUFA: highly unsaturated fatty acids; LH: low-n-3 HUFA diet; MUFA: mono-unsaturated fatty acids; SE: standard error; SFA: saturated fatty acids; TL: total lipids. (PDF)
S2 Table. Fatty acid composition of Liza aurata muscle before the experiment (T0). Total lipid TL content, neutral lipid NL content, polar lipid PL content (mg g-1of dry weight), fatty
acid profile of NL and PL (% of fatty acids methyl esters FAME) in Liza aurata white muscle at the T0 of the experiment (n = 10). Values are mean ± standard error. Abbreviations: ARA: ara-chidonic acid; DHA docosahexaenoic acid; EPA: ecosapentaenoic acid; HUFA: highly unsatu-rated fatty acids; MUFA: mono-unsatuunsatu-rated fatty acids; SFA: satuunsatu-rated fatty acids.
(PDF)
S3 Table. Fatty acid composition of Liza aurata muscle at the end of the experiment. Total lipid TL content, neutral lipid NL content, polar lipid PL content (mg g-1of dry weight), fatty acid profile of NL and PL (% of fatty acids methyl esters FAME) in Liza aurata white muscle at the end of the experiment according to rearing conditions (HH20: fish fed the high-n-3 HUFA diet and reared at 20°C, n = 14; LH20: fish fed the low-n-3 HUFA diet and reared at 20°C, n = 13; HH12: fish fed the high-n-3 HUFA diet and reared at 12°C, n = 13; and LH12: fish fed the low-n-3 HUFA diet and reared at 12°C, n = 10). Values are mean ± standard error. Statistical signifi-cance of diet (D), temperature (T), as well as the interaction between both factors (D(T) are
indi-cated through the P, F and df values (two-way ANOVA). Significance was considered from α < 0.05 and was indicated in bold case in the table. Values containing different letters on a same row are significantly different. Abbreviations: ARA: arachidonic acid; D: diet; D(T: interaction
be-tween diet and temperature; df1: degree of freedom of numerator; df2: degree of freedom of
de-nominator; DHA docosahexaenoic acid; EPA: ecosapentaenoic acid; HUFA: highly unsaturated fatty acids; MUFA: mono-unsaturated fatty acids; SFA: saturated fatty acids; T: temperature. (PDF)
Acknowledgments
Author Contributions
Conceived and designed the experiments: MV TLL JLZI. Performed the experiments: MV TLL HLD. Analyzed the data: MV TLL HLD. Contributed reagents/materials/analysis tools: CL JLZI DM PQ HLD ED. Wrote the paper: MV TLL CL JLZI DM HDL.
References
1. Das T, Pal AK, Chakraborty SK, Manush SM, Sahu NP, Mukherjee SC. Thermal tolerance, growth and oxygen consumption ofLabeo rohita fry (Hamilton, 1822) acclimated to four temperatures. J Therm Biol. 2005; 30: 378–383.
2. Sollid J, Nilsson GE. Plasticity of respiratory structures—adaptive remodeling of fish gills induced by ambient oxygen and temperature. Respir Physiol Neurobiol. 2006; 154: 241–251. doi:10.1016/j.resp. 2006.02.006PMID:16540380
3. Hazel JR, Williams EE. The role of alterations in membrane lipid composition in enabling physiological adaptation of organisms to their physical environment. Prog Lipid Res. 1990; 29: 167–227. PMID:
2131463
4. Cossins AR. Homeoviscous adaptation of biological membranes and its functional significance. Tem-perature adaptation of biological membranes. Portland Press. London: Cossins A. R.; 1994. pp. 63–76. 5. Selmi S, Mbarki R, Sadok S. Seasonal change of lipid and fatty acid composition of little tunaEuthynnus
alletteratus-by-products. Nutr Health. 2008; 19: 189–194. PMID:19009740
6. Person-Le Ruyet J, Skalli A, Dulau B, Le Bayon N, Le Delliou H, Robin JH. Does dietary n-3 highly un-saturated fatty acids level influence the European sea bass (Dicentrachus labrax) capacity to adapt to a high temperature? Aquaculture. 2004; 242: 571–588. doi:10.1016/j.aquaculture.2004.09.011PMID:
15029503
7. Raynard RS, Cossins AR. Homeoviscous adaptation and thermal compensation of sodium pump of trout erythrocytes. Am J Physiol. 1991; 260: R916–R924. PMID:2035703
8. Wodtke E. Temperature adaptation of biological membranes. Compensation of the molar activity of cy-tochrome C oxidase in the mitochondrial energy-transducing membrane during thermal acclimation of the carp (Cyprinus carpio L.). Biochim Biophys Acta. 1991; 640: 710–720.
9. Sargent J., Tocher DR, Bell JG. The lipids, Third edition. Fish Nutrition. Academic Press. London: Hal-ver J.E. & Hardy R.W.; 2002. pp. 182–259.
10. Glencross BD. Exploring the nutritional demand for essential fatty acids by aquaculture species. Re-views in Aquaculture. 2009; 1: 71–124. doi:10.1111/j.1753-5131.2009.01006.x
11. Tocher DR. Fatty acid requirements in ontogeny of marine and freshwater fish. Aquac Res. 2010; 41: 717–732. doi:10.1111/j.1365-2109.2008.02150.x
12. Pahl SL, Lewis DM, Chen F, King KD. Heterotrophic growth and nutritional aspects of the diatom Cyclo-tella cryptica (Bacillariophyceae): Effect of some environmental factors. J Biosci Bioeng. 2010; 109: 235–239. doi:10.1016/j.jbiosc.2009.08.480PMID:20159570
13. Crawford MA, Broadhurst CL. The role of docosahexaenoic and the marine food web as determinants of evolution and hominid brain development: the challenge for human sustainability. Nutr Health. 2012; 21: 17–39. doi:10.1177/0260106012437550PMID:22544773
14. McKenzie DJ. Effects of dietary fatty acids on the respiratory and cardiovascular physiology of fish. Comp Biochem Physiol A Mol Integr Physiol. 2001; 128: 605–619. doi:10.1016/S1095-6433(00) 00338-X
15. Vagner M, Zambonino-Infante J-L, Mazurais D, Imbert-Auvray N, Ouillon N, Dubillot E, et al. Reduced n-3 highly unsaturated fatty acids dietary content expected with global change reduces the metabolic capacity of the golden grey mullet. Mar Biol. 2014; doi:10.1007/s00227-014-2526-3PMID:25414525
16. Chatelier A, Imbert N, Infante JLZ, McKenzie DJ, Bois P. Effects of oleic acid on the high threshold bari-um current in seabassDicentrarchus labrax ventricular myocytes. J Exp Biol. 2006; 209: 4033–4039. doi:10.1242/jeb.02470PMID:17023597
17. Chatelier A. Associations between tissue fatty acid composition and physiological traits of performance and metabolism in the seabass (Dicentrarchus labrax). J Exp Biol. 2006; 209: 3429–3439. doi:10. 1242/jeb.02347PMID:16916978
18. Wagner G., Balfry S., Higgs D., Lall S., Farrell A. Dietary fatty acid composition affects the repeat swim-ming performance of Atlantic salmon in seawater. Comp Biochem Physiol A Mol Integr Physiol. 2004; 137: 567–576. doi:10.1016/j.cbpb.2003.11.005PMID:15123193
19. Dosanjh BS, Higgs DA, McKenzie DJ, Randall DJ, Eales JG, Rowshandeli N, et al. Influence of dietary blends of menhaden oil and canola oil on growth muscle lipid composition and thyroidal status of Atlan-tic salmon (Salmo salar) in sea water. Fish Physiol Biochem. 1998; 19: 123–134.
20. McKenzie DJ, Higgs D., Dosanjh BS, Deacon G, Randall DJ. Dietary fatty acid composition influences swimming performance in Atlantic salmon (Salmo salar) in seawater. Fish Physiol Biochem. 1998; 19: 111–122.
21. IPCC. Climate Change 2013: The Physical Science Basis. Contribution of Working Group I to the Fifth Assessment Report of the Intergovernmental Panel on Climate Change. Cambridge University Press, Cambridge, United Kingdom and New York, NY, USA. Stocker T.F., Qin D., Plattner G.-K., Tignor M., Allen S.K., Boschung J., Nauels A., Xia Y., Bex V. and Midgley P.M.; 2013. p. 1535.
22. Ifremer. Laboratoire Environnement Ressources des Pertuis Charentais. Bulldoser (Bulletin des Don-nées de la Surveillance de l’Environnement et des Ressources). 2012.
23. Béthoux J, Gentili B, Tailliez D. Warming and freshwater budget change in the Mediterranean since the 1940s, their possible relation to the greenhouse effect. Geophys Res Lett. 1998; 25: 1023–1026. doi:
10.1029/98GL00724
24. Goffart A, Hecq JH, Legendre L. Changes in the development of the winter-spring phytoplankton bloom in the Bay of Calvi (NW Mediterranean) over the last two decades: a response to changing climate? Mar Ecol Prog Ser. 2002; 236: 45–60.
25. Gypens N, Lacroix G, Lancelot C. Causes of variability in diatom and Phaeocystis blooms in Belgian coastal waters between 1989 and 2003: A model study. J Sea Res. 2007; 57: 19–35. doi:10.1016/j. seares.2006.07.004
26. Gómez F, Souissi S. The impact of the 2003 summer heat wave and the 2005 late cold wave on the phytoplankton in the north-eastern English Channel. C R Biol. 2008; 331: 678–685. doi:10.1016/j.crvi. 2008.06.005PMID:18722987
27. Kainz M, Brett MT, Arts MT, editors. Lipids in Aquatic Ecosystems [Internet]. New York, NY: Springer New York; 2009. Available:http://link.springer.com/10.1007/978-0-387-89366-2
28. Leu E, Wängberg S-Å, Wulff A, Falk-Petersen S, Børre Ørbæk J, Hessen DO. Effects of changes in am-bient PAR and UV radiation on the nutritional quality of an Arctic diatom (Thalassiosira antarctica var. borealis). J Exp Mar Biol Ecol. 2006; 337: 65–81. doi:10.1016/j.jembe.2006.06.005
29. Lebreton B, Richard P, Galois R, Radenac G, Pfléger C, Guillou G, et al. Trophic importance of diatoms in an intertidalZostera noltii seagrass bed: Evidence from stable isotope and fatty acid analyses. Estuar Coast Shelf Sci. 2011; 92: 140–153. doi:10.1016/j.ecss.2010.12.027
30. Carpentier A, Como S, Dupuy C, Lefrançois C, Feunteun E. Feeding ecology of Liza spp. in a tidal flat: Evidence of the importance of primary production (biofilm) and associated meiofauna. J Sea Res. 2014; 92: 86–91. doi:10.1016/j.seares.2013.10.007
31. Folch J, Lees M, Sloane GH. A simple method for the isolation and purification of total lipids from animal tissues. J Biol Chem. 1957; 226: 497–509. PMID:13428781
32. Juaneda P, Roquelin G. Rapid and convenient separation of phospholipids and non-phosphorus lipids from rat heart using silica cartridges. Lipids. 1985; 20: 400–41.
33. Fulton TW. The rate of growth of fishes. 22nd Annual Report of the Fishery Board of Scotland. 1904. pp. 141–241.
34. Webb PW. Acceleration performance of rainbow trout (Oncorhynchus mykiss). J Exp Biol. 1975; 63: 451–465.
35. Vagner M, Lefrançois C, Ferrari RS, Satta A, Domenici P. The effect of acute hypoxia on swimming sta-mina at optimal swimming speed in flathead grey mulletMugil cephalus. Mar Biol. 2008; 155: 183–190. doi:10.1007/s00227-008-1016-x
36. Schurmann H, Steffensen JF. Spontaneous swimming activity of Atlantic codGadus morhua exposed to graded hypoxia at three temperatures. J Exp Biol. 1994; 197: 129–142. PMID:9317484
37. Beamish FWH. Influence of starvation on standard and routine oxygen consumption. Trans Am Fish Soc. 1964; 93: 103–107. doi:10.1577/1548-8659(1964)93[103:IOSOSA]2.0.CO;2
38. Clark TD, Jeffries KM, Hinch SG, Farrell AP. Exceptional aerobic scope and cardiovascular perfor-mance of pink salmon (Oncorhynchus gorbuscha) may underlie resilience in a warming climate. J Exp Biol. 2011; 214: 3074–3081. doi:10.1242/jeb.060517PMID:21865520
39. Riggs A. Properties of fish hemoglobins. Academic Press. New York; 1970. pp. 209–252.
40. Cerezo J, Garcia BG. The effects of oxygen levels on oxygen consumption, survival and ventilatory fre-quency of sharpsnout sea bream (Diplodus puntazzo Gmelin, 1789) at different conditions of tempera-ture and fish weight. J Appl Ichtyol. 2004; 20: 488–492.
41. Linares F, Henderson RJ. Incorporation of 14C-labelled polyunsaturated fatty acids by juvenile turbot Scophtalmus maximus (L) in vivo. J Fish Biol. 1991; 38: 335–347.
42. Jobling M. Nutrient partitioning and the influence of feed composition on body composition. Food Intake in Fish. Blackwell Scientific. Oxford UK: Houlihan D, Boujard Jobling M; 2001. pp. 354–375.
43. Lee CG. Excess post-exercise oxygen consumption in adult sockeye (Oncorhynchus nerka) and coho (O. kisutch) salmon following critical speed swimming. J Exp Biol. 2003; 206: 3253–3260. doi:10.1242/ jeb.00548PMID:12909706
44. Luna-Acosta A, Lefrançois C, Millot S, Chatain B, Bégout M-L. Physiological response in different strains of sea bass (Dicentrarchus labrax): Swimming and aerobic metabolic capacities. Aquaculture. 2011; 317: 162–167. doi:10.1016/j.aquaculture.2011.03.004
45. He W, Xia W, Cao Z-D, Fu S-J. The effect of prolonged exercise training on swimming performance and the underlying biochemical mechanisms in juvenile common carp (Cyprinus carpio). Comp Biochem Physiol A Mol Integr Physiol. 2013; 166: 308–315. doi:10.1016/j.cbpa.2013.07.003PMID:23838144
46. Lee CG. Excess post-exercise oxygen consumption in adult sockeye (Oncorhynchus nerka) and coho (O. kisutch) salmon following critical speed swimming. J Exp Biol. 2003; 206: 3253–3260. doi:10.1242/ jeb.00548PMID:12909706
47. Dalla Valle AZ, Rivas-Diaz R, Claireaux G. Opercular differential pressure as a predictor of metabolic oxygen demand in the starry flounder. J Fish Biol. 2003; 63: 1578–1588.
48. Millidine KJ, Metcalfe NB, Armstrong JD. The use of ventilation frequency as an accurate indicator of metabolic rate in juvenile atlantic salmon (Salmo salar). Can J Fish Aquat Sci. 2008; 65: 2081–2087. 49. Frisk M, Skov PV, Steffensen JF. Thermal optimum for pikeperch (Sander lucioperca) and the use of ventilation frequency as a predictor of metabolic rate. Aquaculture. 2012; 324–325: 151–157. doi:10. 1016/j.aquaculture.2011.10.024
50. Hammill E, Wilson RS, Johnston IA. Sustained swimming performance and muscle structure are al-tered by thermal acclimation in male mosquitofish. J Therm Biol. 2004; 29: 251–257. doi:10.1016/j. jtherbio.2004.04.002
51. Johnston IA, Lucking M. Temperature induced variation in the distribution of different muscle fibre type in the goldfish (Carassius auratus). J Comp Physiol B. 1978; 124: 111–116.
52. Jones PL, Sidell BD. Metabolic responses of striped bass to temperature acclimation. II. Alterations in metabolic carbon sources and distributions of fiber types in locomotory muscle. J Exp Zool. 1982; 219: 163–171.
53. Fry FE. The effect of environmental factors on the physiology of fish. Fish Physiol. 1971; 6: 1–98. doi:
10.1016/S1546-5098(08)60146-6
54. Brand MD. The contribution of the leak of protons across the mitochondrial inner membrane to standard metabolic rate. J Theor Biol. 1990; 145: 267–286. PMID:2169556
55. Ramsey JJ, Harper M-E, Humble SJ, Koomson EK, Ram JJ, Bevilacqua L, et al. Influence of mitochon-drial membrane fatty acid composition on proton leak and H2O2 production in liver. Comp Biochem Physiol B Biochem Mol Biol. 2005; 140: 99–108. doi:10.1016/j.cbpc.2004.09.016PMID:15621515
56. Fontaine EM, Moussa M, Devin A, Garcia J, Ghisolfi J, Rigoulet M, et al. Effect of polyunsaturated fatty acids deficiency on oxidative phosphorylation in rat liver mitochondria. Biochim Biophys Acta BBA-Bioenerg. 1996; 1276: 181–187. PMID:8856103
57. Mark FC, Lucassen M, Pörtner HO. Thermal sensitivity of uncoupling protein expression in polar and temperate fish. 2006; 1: 365–374. doi:10.1016/j.cbd.2006.08.004PMID:20483268
58. Stuart JA, Harper JA, Brindle KM, Brand MD. Uncoupling protein 2 from carp and zebrafish, ectothermic vertebrates. Biochim Biophys Acta. 1999; 1413: 50–54. PMID:10524261
59. Liang X-F, Ogata HY, Oku H, Chen J, Hwang F. Abundant and constant expression of uncoupling pro-tein 2 in the liver of red sea breamPagrus major. Comp Biochem Physiol A Mol Integr Physiol. 2003; 136: 655–661. doi:10.1016/S1095-6433(03)00218-6PMID:14613793
60. Jastroch M, Withers K, Klingenspor M. Uncoupling protein 2 and 3 in marsupials: identification, phylog-eny, and gene expression in response to cold and fasting inAntechinus flavipes. Physiol Genomics. 2004; 17: 130–139. doi:10.1152/physiolgenomics.00165.2003PMID:14970361
61. Sidell BD, Driezic WR. Relationship between cardiac energy metabolism and cardiac work demand in fishes. Circulation, respiration and metabolism proceedings in life science. Springer. Berlin, Heidel-berg: Gilles R; 1985. pp. 386–401.
62. Egginton S. Effect of temperature on optimal substrate for β-oxidation. J Fish Biol. 1996; 49: 753–758. 63. Henderson RJ, Sargent J. Chain-length specificities of mitochondrial and peroxisomal β-oxidation of
fatty acids in livers of rainbow trout (Salmo gairdneri). Comp Biochem Physiol Part B Comp Biochem. 1985; 82: 79–85.