HAL Id: hal-01032111
https://hal.archives-ouvertes.fr/hal-01032111
Submitted on 31 May 2020
HAL is a multi-disciplinary open access
archive for the deposit and dissemination of
sci-entific research documents, whether they are
pub-lished or not. The documents may come from
teaching and research institutions in France or
abroad, or from public or private research centers.
L’archive ouverte pluridisciplinaire HAL, est
destinée au dépôt et à la diffusion de documents
scientifiques de niveau recherche, publiés ou non,
émanant des établissements d’enseignement et de
recherche français ou étrangers, des laboratoires
publics ou privés.
Drought Sensitivity of the Amazon Rainforest
Oliver L. Phillips, Luiz E.O.C. Aragao, Simon L. Lewis, Joshua, B. Fisher,
Jon Lloyd, Gabriela Lopez-Gonzales, Yadvinder Malhi, Abel Monteagudo,
Julie Peacock, Carlos A. Quesada, et al.
To cite this version:
Oliver L. Phillips, Luiz E.O.C. Aragao, Simon L. Lewis, Joshua, B. Fisher, Jon Lloyd, et al.. Drought
Sensitivity of the Amazon Rainforest. Science, American Association for the Advancement of Science,
2009, 323, pp.1344-1347. �10.1126/science.1164033�. �hal-01032111�
DOI: 10.1126/science.1164033
, 1344 (2009);
323
Science
et al.
Oliver L. Phillips,
www.sciencemag.org (this information is current as of March 6, 2009 ):
The following resources related to this article are available online at
http://www.sciencemag.org/cgi/content/full/323/5919/1344
version of this article at:
including high-resolution figures, can be found in the online
Updated information and services,
http://www.sciencemag.org/cgi/content/full/323/5919/1344/DC1
can be found at:
Supporting Online Material
found at:
can be
related to this article
A list of selected additional articles on the Science Web sites
http://www.sciencemag.org/cgi/content/full/323/5919/1344#otherarticles
, 11 of which can be accessed for free:
cites 30 articles
This article
http://www.sciencemag.org/cgi/collection/ecology
Ecology
:
subject collections
This article appears in the following
http://www.sciencemag.org/about/permissions.dtl
in whole or in part can be found at:
this article
permission to reproduce
of this article or about obtaining
reprints
Information about obtaining
is a
Science
2009 by the American Association for the Advancement of Science; all rights reserved. The title
Copyright
American Association for the Advancement of Science, 1200 New York Avenue NW, Washington, DC 20005.
(print ISSN 0036-8075; online ISSN 1095-9203) is published weekly, except the last week in December, by the
Science
on March 6, 2009
www.sciencemag.org
Drought Sensitivity
of the Amazon Rainforest
Oliver L. Phillips,1* Luiz E. O. C. Aragão,2Simon L. Lewis,1Joshua B. Fisher,2Jon Lloyd,1 Gabriela López-González,1Yadvinder Malhi,2Abel Monteagudo,3Julie Peacock,1
Carlos A. Quesada,1,4Geertje van der Heijden,1Samuel Almeida,5Iêda Amaral,4,6 Luzmila Arroyo,7,8Gerardo Aymard,9Tim R. Baker,1Olaf Bánki,10Lilian Blanc,11 Damien Bonal,12Paulo Brando,13,14Jerome Chave,15Átila Cristina Alves de Oliveira,4
Nallaret Dávila Cardozo,16Claudia I. Czimczik,17Ted R. Feldpausch,1Maria Aparecida Freitas,5 Emanuel Gloor,1Niro Higuchi,18Eliana Jiménez,19Gareth Lloyd,20Patrick Meir,21
Casimiro Mendoza,22Alexandra Morel,2David A. Neill,8,23Daniel Nepstad,24,25Sandra Patiño,1,11 Maria Cristina Peñuela,19Adriana Prieto,26Fredy Ramírez,16Michael Schwarz,1,27Javier Silva,2 Marcos Silveira,28Anne Sota Thomas,29Hans ter Steege,30Juliana Stropp,30Rodolfo Vásquez,3 Przemyslaw Zelazowski,2Esteban Alvarez Dávila,31Sandy Andelman,6Ana Andrade,4
Kuo-Jung Chao,1Terry Erwin,32Anthony Di Fiore,33Eurídice Honorio C.,34Helen Keeling,1 Tim J. Killeen,7William F. Laurance,4,35Antonio Peña Cruz,3Nigel C. A. Pitman,36 Percy Núñez Vargas,37Hirma Ramírez-Angulo,38Agustín Rudas,39Rafael Salamão,5 Natalino Silva,40John Terborgh,41Armando Torres-Lezama38
Amazon forests are a key but poorly understood component of the global carbon cycle. If, as anticipated, they dry this century, they might accelerate climate change through carbon losses and changed surface energy balances. We used records from multiple long-term monitoring plots across Amazonia to assess forest responses to the intense 2005 drought, a possible analog of future events. Affected forest lost biomass, reversing a large long-term carbon sink, with the greatest impacts observed where the dry season was unusually intense. Relative to pre-2005 conditions, forest subjected to a 100-millimeter increase in water deficit lost 5.3 megagrams of aboveground biomass of carbon per hectare. The drought had a total biomass carbon impact of 1.2 to 1.6 petagrams (1.2 × 10¹⁵to 1.6 × 10¹⁵grams). Amazon forests therefore appear vulnerable to increasing moisture stress, with the potential for large carbon losses to exert feedback on climate change.
O
ld-growth forests in Amazonia store 120 Pg (1.2 × 10¹⁷g) of carbon in their biomass (1), and through photosynthesis and respiration they process 18 Pg C annually (2), more than twice the rate of anthropogenic fossil fuel emissions. Relatively small changes in Amazon forest dynamics therefore have the potential to substantially affect the concen-tration of atmospheric CO2and thus the rateof climate change itself. A key parameter in determining the magnitude of this effect is the sensitivity—or resilience—of tropical forests
to drought. Increased moisture stress is a domi-nant feature of some modeled 21st-century climate scenarios for Amazonia, particularly for southern Amazonia (3–5), and there is some evidence that this has already commenced (6). Prolonged tropical droughts can kill trees (7–10), and some models predict climate-induced Am-azon dieback this century (4, 11, 12). But it has also been suggested that dry conditions may cause Amazon forests to“green up” (13, 14) and that increases in solar radiation during drier periods boost tropical productivity (15–17).
Large-scale on-the-ground assessments of the ecological impacts of tropical droughts are com-pletely lacking, precluding tests of these ideas.
In 2005, large areas of the Amazon Basin experienced one of the most intense droughts of the past 100 years (18), providing a unique opportunity to directly evaluate the large-scale sensitivity of tropical forest to water deficits. The 2005 event was driven not by El Niño, as is often the case for Amazonia, but by elevated tropical North Atlantic sea surface temperatures (18), which affected the southern two-thirds of Amazonia and especially the southwest through reduced precipitation as well as higher-than-average temperatures (18, 19). Both the anom-alous North Atlantic warming and its causal link to Amazon drought are reproduced in some recent modeled scenarios for 21st-century cli-mates (5, 12), and thus the event of 2005 may provide a proxy for future climate conditions. Through a large long-term research network, RAINFOR, we have monitored forest plots across the basin for 25 years. After the drought we con-ducted an emergency recensus program cover-ing all major Amazon nations, climates, soils, and vegetation types. Here we report the results of this large-scale natural experiment to assess the impact of tropical drought on the ground.
By 2005 the RAINFOR network consisted of 136 permanent plots located in old-growth forest distributed across 44 discrete landscapes (“sites”) (20). We used tree diameter, wood den-sity, and allometric models to compute biomass at each point in time, as well as rates of biomass gain (“growth”) and loss (“mortality”) between censuses, correcting for possible sampling ef-fects (20). To establish the pre-2005 Amazon baseline, we first determined the long-term bio-mass changes in our plots. To assess drought im-pacts, we focused on the 2005 event, evaluating net biomass change, growth, and mortality and the differences in these relative to earlier records, focusing on the 55 plots that were regularly censused both before and after the drought. To 1
Ecology and Global Change, School of Geography, University of Leeds, Leeds LS2 9JT, UK.2Environmental Change Institute, School of Geography and Environment, Oxford University, Ox-ford OX1 3QY, UK.3Jardín Botánico de Missouri, Oxapampa, Pasco, Peru.4Instituto Nacional de Pesquisas na Amazônia, Av. Andre Araujo, 1753 CP 478, 69060-011 Manaus AM, Brasil. 5Museu Paraense Emílio Goeldi, Av. Perimetral, 1901 Terra Firme, CEP: 66077-830 Belém PA, Brasil.6Tropical Ecology Assessment and Monitoring Network (TEAM), Conservation International, 2011 Crystal Drive, Suite 500, Arlington, VA 22202, USA.7Museo de Historia Natural Noel Kempff Mercado, Casilla 2489, Av. Irala 565, Santa Cruz, Bolivia.8Missouri Bo-tanical Garden, Box 299, St. Louis, MO 63166, USA.9Programa de Ciencias del Agro y del Mar, Herbario Universitario (PORT), Universidad Nacional Experimental de Los Llanos Occidentales Ezequiel Zamora, Mesa de Cavacas, Portuguesa 3350, Vene-zuela.10Nationaal Herbarium Nederland, W.C. van Unnikgebouw, Heidelberglaan 2, 3584 CS Utrecht, Netherlands.11Centre de Coopération Internationale en Recherche Agronomique pour le Développement (CIRAD), UMR EcoFoG, Campus Agronomique, BP 709, 97387 Kourou Cedex, French Guiana.12Institut National de la Recherche Agronomique (INRA), UMR EcoFoG, Campus Agronomique, BP 709, 97387 Kourou Cedex, French Guiana. 13
Instituto de Pesquisa Ambiental da Amazônia, Avenida Nazaré 669, CEP-66035, Belém PA, Brasil.14Department of
Botany and School of Natural Resources and Environment, University of Florida, P.O. Box 118526, Gainesville, FL 32611, USA.15Laboratoire EDB, Université Paul Sabatier, Bâtiment 4R3, 31062 Toulouse, France.16Universidad Nacional de la Amazonía Peruana, Iquitos, Loreto, Perú.17Department of Earth System Science, University of California, Irvine, CA 92697, USA. 18Departamento de Silvicultura Tropical, Manejo Florestal, Instituto Nacional de Pesquisas da Amazônia, Av. André Araújo, 2936 Petrópolis, Manaus AM, Brasil.19Universidad Nacional de Colombia, Kilómetro 2 Via Tarapacá, Leticia, Amazonas, Colombia. 20National Australia Bank, UB2211, 800 Bourke Street, Docklands, VIC 3008, Australia.21School of Geosciences, University of Edinburgh, Edinburgh EH8 9XP, UK.22FOMABO (Manejo Forestal en las Tierras Tropicales de Bolivia), Sacta, Bolivia.23Jatun Sacha Foundation, Casilla 17-12-867, Avenida Rio Coca 1734, Quito, Ecuador.24Woods Hole Research Center, Falmouth, MA 02540, USA.25Gordon and Betty Moore Foundation, P.O. Box 29910, San Francisco, CA 94129, USA.26Instituto Alexander von Humboldt, Claustro de San Agustín, Villa de Leyva, Boyacá, Colombia.27Bayreuth Center of Ecology and Environmental Research, University of Bayreuth, 95440 Bayreuth, Germany.28Depto de Ciências da Natureza, Universidade Federal do Acre, Rio Branco AC 69910-900, Brasil.29Faculty of Agriculture and Horticulture, Humboldt University of Berlin, Phillipstrasse 13, 10557 Berlin, Germany.
30
Institute of Environmental Biology, Department of Biology, Faculty of Science, Utrecht University, Sorbonnelaan 16, 3584 CA Utrecht, Netherlands. 31Facultad de Ingeniería Forestal, Universidad del Tolima, 546 Ibagué, Colombia.32Department of Entomology, National Museum of Natural History, Smithsonian Institution, MRC 187, P.O. Box 37012, Washington, DC 20013, USA.33Center for the Study of Human Origins, Department of Anthropology, New York University, New York, NY 10003, USA. 34Instituto de Investigaciones de la Amazonía Peruana, Av. José A. Quiñones km. 2.5, Apartado Postal 784, Loreto, Perú. 35
Smithsonian Tropical Research Institution, Roosevelt Avenue, Tupper Building 401 Balboa, Ancón, Panamá, República de Panamá.36Centro de Investigación y Capacitación del Río de Los Amigos, Madre de Dios, Perú. 37Universidad Nacional San Antonio Abad del Cusco, Av. de la Cultura 733, Cusco, Apartado Postal N° 921, Perú.38INDEFOR, Facultad de Ciencias Forestales, Universidad de Los Andes, Mérida, Venezuela.39Instituto de Ciencias Naturales, Universidad Nacional de Colombia, Apartado 7495, Bogotá, Colombia.40Serviço Florestal Brasileiro, SCEN Trecho 2, Ed. Sede do IBAMA Bloco H, 70.818-900 Brasília DF, Brasil.41Center for Tropical Conservation, Duke University, Box 90381, Durham, NC 27708, USA.
*To whom correspondence should be addressed. E-mail: [email protected]; Internet: www.rainfor.org
6 MARCH 2009 VOL 323 SCIENCE www.sciencemag.org 1344
REPORTS
on March 6, 2009
www.sciencemag.org
estimate the moisture stress at each location, we compiled meteorological data sets and determined the maximum dry-season intensity for each year in the 2005 measurement interval and for each year in the entire pre-2005 measurement period. Forest sensitivity to drought was then determined by relating the change in biomass dynamics to the change in mean maximum moisture stress. The results presented below are based on the sampling unit of individual plots; in (20) we ex-plore the sensitivity of our findings to varying both the spatial scale of the sampling unit and the method of estimating moisture stress.
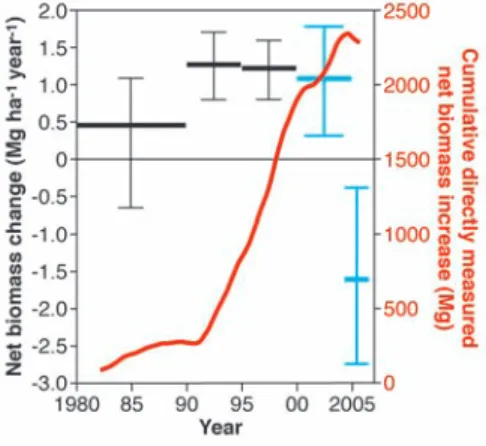
Before 2005, plots recorded a long-term net increase in aboveground (dry-weight) biomass, weighted by sampling effort, of 0.89 Mg ha−1 year−1(bootstrapped 95% confidence intervals: 0.65, 1.12). This increase occurred through a multidecadal period spanning dry and wet
epi-sodes, including several El Niño events. The net biomass gain was widespread and is not a sam-pling artifact (20). These results confirm pre-vious measured and modeled indications of a persistent biomass carbon sink—now based on a much larger data set—and are consistent with Amazon forest productivity increasing with time (21–25).
By contrast, through the 2005 drought pe-riod there was no net biomass increase in moni-tored plots [net rate of change –0.71 (–1.93, +0.30) Mg ha−1 year−1;n = 55, interval mean 1.97 years]. Before 2005, 76% of plots (93 of 123) gained biomass, but during the 2005 inter-val only 51% did so (28 of 55); this difference is highly significant (P < 0.01, Mann-Whitney U test). To assess whether biomass changes were drought-related, we developed meteorological and soil data sets to estimate evapotranspirational
demand and soil moisture stress (20). For plots with longer and more intense moisture deficits than normal, there were clear net losses [–1.62 (–3.16, –0.54) Mg ha−1year−1;n = 38,
inter-val mean 1.96 years]. The distribution through time of all measured biomass dynamics (Fig. 1) reveals that the drought coincided with the first substantial decline in measured biomass in Amazonian plots since measurements started. However, fingerprinting the drought impact is complicated by switching among plots being monitored, the nonequilibrium initial conditions, divergent climatologies and soils, and contrast-ing conditions in 2005 itself. Within-plot anal-yses help to control for such effects and confirm the drought’s impact: Relative to their extended period of earlier biomass gains, plots monitored through 2005 experienced negative change [difference = –1.50 (–3.01, –0.44) Mg ha−1 year−1;n = 43]. Among the 28 plots with longer and more severe water deficits than normal dur-ing 2005, the rate of aboveground woody bio-mass accumulation declined by 2.39 (1.12 to 3.97) Mg ha−1year−1, whereas by contrast the 15 non-droughted plots continued to gain [difference = +0.76 (–0.78, +2.00) Mg ha−1year−1].
The Amazon forest spans a large climatic range, from the almost aseasonal high-precipitation northwest to the strongly seasonal southern fringes with frequent prolonged moisture deficits (26, 27). Distributions of neotropical trees reflect their drought sensitivity (28), so we hypothesized that any drought impacts will be experienced by plants as a function of relative departure from their long-term environmental conditions. For each site, we therefore estimated the magnitude of the drought experienced during the 2005 interval relative to local, long-term estimates of water balance. We find that relative drought is indeed strongly Fig. 1. Interval-by-interval, plot-by-plot net
bio-mass change measured in Amazonia since 1980. The multidecadal carbon sink is evident, strongly reversed in 2005. Long sampling intervals may have obscured earlier fluctuations (see fig. S1). Red line (scale on right) represents the total cu-mulative biomass increase of Amazon trees≥10 cm in diameter as actually measured in permanent plots, as a function of the mid-date of each census interval, with a running mean of 50 intervals. Black and blue distributions (scale on left) represent mean and 95% bootstrapped confidence intervals for interval-by-interval biomass change weighted by sampling effort (20). Black distributions indi-cate predefined periods (1980–1989, 1990–1994, 1995–1999) where the chronological span of each bin represents the interval mid-dates that fall
within that period. Blue distributions align intervals with the 2005 drought event to reveal its impact, contrasting all 2000–2004 predrought measurements with all droughted plots monitored in 2005. Fig. 2. Biomass dynamics
response to the relative in-tensity of the 2005 drought. Differences in (A) plot bio-mass change (blue) and (B) mortality rate (red) and growth rate (green) are shown for trees≥10 cm in diameter for the drought in-terval relative to pre-2005 as a linear function of drought relative intensity, weighted by monitoring effort (20). Change in drought intensity is measured by change in maximum climatological wa-ter deficit (MCWD, accounts only for rainfall). Uncertainty in precipitation is included in the bootstrapped estimates of the relationship of dif-ference in biomass change versus difference in MCWD
and confidence intervals (20). Plots known to have different 2005 interval MCWD are treated as independent; values are otherwise averaged across contributing plots. Alternative models that account for variation in soil properties, evapotranspiration, and plot definitions give very similar results (20). Polynomial or break-point functions do not provide closer fits.
on March 6, 2009
www.sciencemag.org
implicated as the driver of the network-wide shift in forest behavior (Fig. 2) but that the absolute intensity of the 2005 dry period was only weakly related to biomass dynamics (fig. S5): Those forests experiencing the most elevated moisture stress relative to their long-term mean tended to lose the most biomass relative to their pre-2005 trend (Fig. 2). These losses were driven by oc-casionally large mortality increases and by wide-spread but small declines in growth. Our method may fail to capture growth impacts well because intervals were longer than the period of poten-tial moisture constraint, thereby masking its effects (drought can kill trees but can only tem-porarily stop growth). Analysis at the site level confirms that the relationship between forest response and droughting is not driven by a few anomalous plots (20), and accounting for local
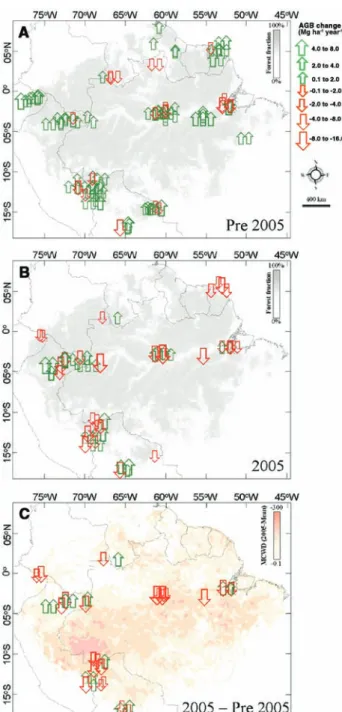
soil water-holding capacity, temperature, humid-ity, and radiation shows this relationship to be robust regardless of how the moisture balance is estimated (20). Moreover, just as the earlier net gains were widespread across the basin, the 2005 declines were well distributed spatially (Fig. 3). From Fig. 2, and assuming a proportional im-pact on smaller trees and lianas (20), we esti-mate that an average forest hectare subject to a 100-mm increase in maximum water deficit lost 5.3 Mg of aboveground biomass carbon over the average 1.97-year drought census interval rela-tive to pre-2005 conditions (bootstrapped confi-dence intervals 3.0, 8.1).
We also recorded the identity of trees that died. Fast-growing, light-wooded trees may be especially vulnerable to drought by cavitation or carbon starvation (7, 29–31), and consistent with
this, trees dying during the 2005 period had lower wood densities than those dying before. In 25 drier-than-average plots with dead trees identified, trees recorded as dead in 2006 were 5% lighter than in previous censuses [mean wood density of dead trees fell from 0.60 to 0.57 g cm−3(P = 0.02) (20)]. Apparently, Ama-zon drought kills selectively and therefore may also alter species composition, pointing to po-tential consequences of future drought events on the biodiversity in the Amazon region.
Relative to the predrought sink, we estimate a total impact of–1.21 Pg C (–2.01, –0.57) by simply scaling the per-plot impact by the total droughted area (~3.3 × 10⁸ ha) and assuming that nonmeasured components of biomass were equally affected. Scaling the per-site impact yields slightly greater values (20). Alternatively, we can scale the observed relationship between relative biomass change in plots and droughting (Fig. 2) by the moisture deficits across Amazonia esti-mated from remotely sensed rainfall data (19, 20). This suggests an even greater impact on the biomass carbon balance of the droughted area: –1.60 Pg C (–2.63, –0.83). Site-based scaling-up indicates similar values (20). Although better understanding of soils is needed to determine the local effects of meteorological drought, the magnitude and consistency of these estimates demonstrate Amazonia’s vulnerability to drought and the potential for changes in tropical climates to have large carbon cycle impacts. Our on-the-ground data reveal that, despite apparent “greening up” during dry periods (13, 14), Amazon drought accelerates mortality over large areas (Fig. 2B) (20).
The exceptional growth in atmospheric CO2
concentrations in 2005, the third greatest in the global record (32), may have been partially caused by the Amazon drought effects documented here. However, our findings do not translate simply into instantaneous flux estimates because carbon fluxes from necromass will lag the actual tree death events. Drought can suppress respiration (17, 33), so the system as a whole might even contribute a temporary net sink even though the live biomass was in negative mass balance. None-theless, our results constrain the aggregate im-pacts of drought because trees are by far the largest and longest-lived of the aboveground carbon stores. Tropical droughts may intensify and be-come more frequent this century as a result of anthropogenic climate change (1, 3–5, 11). In addition to directly affecting Amazonian peoples and biodiversity, such events appear capable of strongly altering the regional carbon balance and thereby accelerating climate change.
References and Notes
1. Y. Malhi et al., Science 319, 169 (2008); published online 27 November 2007 (10.1126/science.1146961). 2. Y. Malhi, J. Grace, Trends Ecol. Evol. 15, 332 (2000). 3. J. H. Christensen et al., in Climate Change 2007: The Physical Science Basis. Contribution of Working Group I to the Fourth Assessment Report of the Intergovernmental Panel on Climate Change, S. Solomon et al., Eds. (Cambridge Univ. Press, Cambridge, 2007).
Fig. 3. Aboveground biomass change in the Amazon Basin and contiguous lowland moist forests. The 2005 drought re-versed a multidecadal biomass carbon sink across Amazonia. Symbols represent magni-tude and direction of mea-sured change and approximate location of each plot. (A) Annu-al aboveground biomass change before 2005. (B) Annual above-ground biomass change during the 2005 interval. (C) Difference in rates of change in above-ground biomass, 2005 versus pre-2005, for those plots moni-tored throughout. Grayscale shading in (A) and (B) repre-sents proportion of area covered by forests. Colored shading in (C) indicates the intensity of the 2005 drought relative to the 1998–2004 mean as measured from space using radar-derived rainfall data [Tropical Rainfall Measuring Mission (TRMM)].
6 MARCH 2009 VOL 323 SCIENCE www.sciencemag.org 1346
REPORTS
on March 6, 2009
www.sciencemag.org
4. L. F. Salazar, C. A. Nobre, M. D. Oyama, Geophys. Res. Lett. 34, L09708 (2007).
5. P. M. Cox et al., Nature 453, 212 (2008). 6. W. Li, R. Fu, R. I. Negrón Juárez, K. Fernandes, Philos.
Trans. R. Soc. London Ser. B 363, 1767 (2008). 7. R. Condit, S. P. Hubbell, R. B. Foster, Ecol. Monogr. 65,
419 (1995).
8. G. B. Williamson et al., Conserv. Biol. 14, 1538 (2000). 9. D. C. Nepstad, I. M. Tohver, D. Ray, P. Moutinho, G. Cardinot,
Ecology 88, 2259 (2007).
10. P. M. Brando et al., Philos. Trans. R. Soc. London Ser. B 363, 1839 (2008).
11. P. M. Cox, R. A. Betts, C. D. Jones, S. A. Spall, I. J. Totterdell, Nature 408, 184 (2000).
12. P. P. Harris, C. Huntingford, P. M. Cox, Philos. Trans. R. Soc. London Ser. B 363, 1753 (2008).
13. A. R. Huete et al., Geophys. Res. Lett. 13, L06405 (2006). 14. S. R. Saleska, K. Didan, A. R. Huete, H. R. da Rocha,
Science 318, 612 (2007).
15. R. Condit et al., J. Trop. Ecol. 20, 51 (2004). 16. E. A. Graham, S. Mulkey, K. Kitajima, K. N. Phillips,
S. J. Wright, Proc. Natl. Acad. Sci. U.S.A. 100, 572 (2003).
17. D. Bonal et al., Global Change Biol. 14, 1917 (2008). 18. J. A. Marengo et al., J. Clim. 21, 495 (2008). 19. L. E. O. C. Aragão et al., Geophys. Res. Lett. 34, L07701
(2007).
20. See supporting material on Science Online. 21. O. L. Phillips et al., Science 282, 439 (1998). 22. R. R. Nemani et al., Science 300, 1560 (2003).
23. T. R. Baker et al., Philos. Trans. R. Soc. London Ser. B 359, 353 (2004).
24. S. L. Lewis et al., Philos. Trans. R. Soc. London Ser. B 359, 421 (2004).
25. K. Ichii, H. Hashimoto, R. Nemani, M. White, Global Planet. Change 48, 274 (2005).
26. C. von Randow et al., Theor. Appl. Climatol. 78, 5 (2004). 27. N. Hasler, R. Avissar, J. Hydrometeorol. 8, 380 (2007). 28. B. M. Engelbrecht et al., Nature 447, 80 (2007). 29. M. Tyree, J. Sperry, Annu. Rev. Plant Phys. Plant Mol.
Biol. 40, 19 (1989).
30. U. Hacke, J. Sperry, W. Pockman, S. Davis, K. McCuloh, Oecologia 126, 457 (2001).
31. N. McDowell, W. Pockman, C. Allen, D. Breshears, N. Cobb, New Phytol. 178, 719 (2008).
32. National Oceanic and Atmospheric Administration, Trends in Atmospheric Carbon Dioxide, Global (www.esrl.noaa. gov/gmd/ccgg/trends, 2008).
33. P. Meir, D. B. Metcalfe, A. C. Costa, R. A. Fisher, Philos. Trans. R. Soc. London Ser. B 363, 1849 (2008). 34. This paper is a product of the RAINFOR network. Funding
for the 2006 recensuses came primarily from a Natural Environment Research Council (NERC) Urgency Grant. The results summarized here also depend on contributions from numerous field assistants and rural communities in Brazil, Bolivia, Colombia, Ecuador, French Guiana, Guyana, Peru, and Venezuela, many previously acknowledged. I. Huamantupa, N. Jaramillo, N. Saavedram (Peru), V. Peña (Ecuador), J.-C. Arias, and D. Navarrete (Colombia) assisted with recent censuses. We thank CNPQ (Brazil), MCT (Brazil),
Ministerio del Medio Ambiente, Vivienda y Desarrollo Territorial (Colombia), Ministerio de Ambiente (Ecuador), the Forestry Commission (Guyana), INRENA (Perú), and Ministerio del Ambiente para el Poder Popular (Venezuela) for research permissions, and the Large Scale Biosphere-Atmosphere Experiment in Amazonia (LBA) for logistical support. This paper was supported by the Leverhulme Trust (O.L.P.), NERC grants NE/B503384/1 and NE/D01025X/1 (O.L.P.), NER/A/S/2003/00608/2 (Y.M.), WOTRO (W84-581) (H.t.S., O.B.), the Royal Society (S.L.L., Y.M.), University of Leeds (T.R.B., K.-J.C., G.L.-G.), and a Gordon and Betty Moore Foundation grant to RAINFOR. Some of the data used in these analyses were collected with support from the TEAM Network of Conservation International, funded by the Gordon and Betty Moore Foundation. We thank D. Galbraith, L. Anderson, C. Michelaki, J. Ratnam, and M. Wagner for discussions; three anonymous reviewers for comments on the manuscript; M. García-Hernandez for help in managing co-author contributions; and A. Manson and D. Appleyard for help in creating the figures.
Supporting Online Material
www.sciencemag.org/cgi/content/full/323/5919/1344/DC1 Materials and Methods
SOM Text Figs. S1 to S8 Tables S1 to S7 References
31 July 2008; accepted 24 December 2008 10.1126/science.1164033
Species Response to Environmental
Change: Impacts of Food Web
Interactions and Evolution
Jason P. Harmon,1* Nancy A. Moran,2Anthony R. Ives1How environmental change affects species abundances depends on both the food web within which species interact and their potential to evolve. Using field experiments, we investigated both ecological and evolutionary responses of pea aphids (Acyrthosiphon pisum), a common agricultural pest, to increased frequency of episodic heat shocks. One predator species ameliorated the decrease in aphid population growth with increasing heat shocks, whereas a second predator did not, with this contrast caused by behavioral differences between predators. We also compared aphid strains with stably inherited differences in heat tolerance caused by bacterial endosymbionts and showed the potential for rapid evolution for heat-shock tolerance. Our results illustrate how ecological and evolutionary complexities should be incorporated into predictions of the consequences of environmental change for species’ populations.
S
pecies throughout the world face many anthropogenic environmental disturbances (1). Some disturbances, such as land-use change, occur progressively and predictably. Others take place as increases in the frequency or magnitude of environmental shocks, such as the anticipated increase in tropical storm severity (2). Regardless of the mode of disturbance, changes in species abundance will depend on the multi-generational response of their survival and repro-duction within ecosystems. Although the responseof species’ populations depends on the direct ef-fects of environmental disturbances on species physiology, behavior, and life history (3, 4), three additional complexities may play major roles in the long-term change in species’ populations (5). First, the change in a species’ population growth rate in response to an environmental dis-turbance depends on how the species interacts ecologically with other species in the ecosystem (6). For example, if a competitively dominant spe-cies is sensitive to a disturbance, then a compet-itively subordinate species may benefit indirectly from the disturbance through competitive release (7). Although the role of food web interactions is well-known in theoretical work (8) and a growing number of empirical studies document these ef-fects (9–11), most of this work has not considered
how the strength of these interactions might change because of density-dependent effects during the environmental change.
A second complexity is the possibility that species may evolve tolerance to the environmen-tal change (12). Empirical studies have now doc-umented a growing list of species that have undergone evolutionary responses to environ-mental changes (13, 14). If genetic variation exists, then environmental disturbances with large impacts on population growth rates may drive rapid evolution of tolerance.
The third complexity is that ecological and evolutionary complexities might interact (15). If ecological interactions modify the response of population growth rates to environmental changes, then they might also modify the selective regime for tolerance and, hence, evolution. In turn, evo-lution may change population growth rates and interactions among species, thereby increasing the complexities of predicting population changes.
Here, we investigate these three complexities for predicting population changes of pea aphids in response to increasing frequency of episodic heat shocks. To show that ecological interactions can modify population responses to environ-mental disturbances, we subjected field-caged populations of pea aphids and predators to an experimentally increased frequency of heat shocks (16). Our goal was to contrast the effects of two similar ladybeetle predators, investigating how species-specific differences in aphid density– dependent attack rates affect the change in aphid population growth rates when subjected to envi-ronmental change. To investigate the potential for evolution, we constructed aphid strains that dif-fered in the presence of stably inherited endo-symbionts that affect heat-shock tolerance. We 1Department of Zoology, University of Wisconsin, Madison,
WI 53706, USA.2Department of Ecology and Evolutionary Biology, University of Arizona, Tucson, AZ 85721, USA. *To whom correspondence should be addressed. E-mail: [email protected]